Significance
Fibroblasts constitute an important element of tumors and have received considerable attention in recent years due to their tumor-promoting and immunosuppressive properties. As a consequence, tumor-associated fibroblasts (TAFs) are considered an attractive target for cancer therapies. However, their origin remains controversial, with some evidence pointing at a local origin, whereas many publications suggest a significant contribution of progenitors from bone marrow. We found that TAFs derive almost exclusively from local sources. Therefore, therapeutic strategies to target fibroblasts must exploit local recruitment and the unique transcriptional and response patterns of fibroblasts from different sites.
Keywords: stroma, origin, bone marrow, collagen, mesenchymal
Abstract
Fibroblasts are common cell types in cancer stroma and lay down collagen required for survival and growth of cancer cells. Although some cancer therapy strategies target tumor fibroblasts, their origin remains controversial. Multiple publications suggest circulating mesenchymal precursors as a source of tumor-associated fibroblasts. However, we show by three independent approaches that tumor fibroblasts derive primarily from local, sessile precursors. First, transplantable tumors developing in a mouse expressing green fluorescent reporter protein (EGFP) under control of the type I collagen (Col-I) promoter (COL-EGFP) had green stroma, whereas we could not find COL-EGFP+ cells in tumors developing in the parabiotic partner lacking the fluorescent reporter. Lack of incorporation of COL-EGFP+ cells from the circulation into tumors was confirmed in parabiotic pairs of COL-EGFP mice and transgenic mice developing autochthonous intestinal adenomas. Second, transplantable tumors developing in chimeric mice reconstituted with bone marrow cells from COL-EGFP mice very rarely showed stromal fibroblasts expressing EGFP. Finally, cancer cells injected under full-thickness COL-EGFP skin grafts transplanted in nonreporter mice developed into tumors containing green stromal cells. Using multicolor in vivo confocal microscopy, we found that Col-I–expressing fibroblasts constituted approximately one-third of the stromal mass and formed a continuous sheet wrapping the tumor vessels. In summary, tumors form their fibroblastic stroma predominantly from precursors present in the local tumor microenvironment, whereas the contribution of bone marrow-derived circulating precursors is rare.
Tumor-associated fibroblasts (TAFs) are a prominent cellular component of tumors, often assumed to be the most abundant cell type in tumor stroma, and there is an interest in TAFs as a therapeutic target in cancer. However, therapeutic interventions are limited by the lack of truly TAF-specific targets and uncertainty about their origins. If TAFs were predominantly recruited from circulating bone marrow (BM)-derived precursors, only systemic but not local therapies would prevent the recruitment of TAF precursors into tumors to suppress their growth. It is generally thought that at least a fraction of the fibroblasts in tumor stroma is derived from circulating BM-derived progenitors/stem cells. The idea that mononuclear blood cells could differentiate into fibroblasts was suggested already in 1892 (1–3). A century later, several reports indicated that circulating CD14+ monocytes or CD45+CD34+ collagen I+ “fibrocytes” (4) could be progenitors for fibroblasts in vitro (5–7) or in vivo (8). Other recent reports also highlight the derivation of TAFs from circulating BM-derived progenitors of either hematopoietic or mesenchymal lineage (9–12). If TAFs were predominantly recruited from local sources, site-specific differences could be exploited to develop much more selective therapeutics to target TAFs with fewer systemic side effects. It is increasingly clear that fibroblasts from different tissues can constitute well-specialized, tissue-specific populations. Fibroblasts from different anatomic sites have positional memory, and differ in transcriptional expression (13–15), responsiveness to local stimuli [e.g., steroid hormones (16)], and their capacity to inhibit cancer cell growth (17), which could well be linked to the organotropism of metastases (18, 19) and could represent a mechanistic basis for the “seed and soil” hypothesis (20). We therefore examined in this study the relative contributions of circulating cells and locally derived fibroblasts to the development of tumor stroma.
Fibroblasts are the most common cell type producing collagen, and over 90% of collagen in the body is type I (21). Genes for type I collagen (Col-I) are only active in mesenchymal cell types such as osteoblasts, odontoblasts, and, most relevant for this study, fibroblasts and circulating mesenchymal progenitors (3, 22). We therefore chose expression of an EGFP reporter driven by the collagen α1(I) promoters/enhancers to unambiguously mark fibroblasts (23). α-Smooth muscle actin (αSMA) does not exclusively mark fibroblasts, but can be up-regulated on activated fibroblasts (called myofibroblasts) in conditions involving active ECM deposition such as fibrosis, wound healing, and cancer (24–26). Thus, we also studied the origin of αSMA+ cells using the αSMA-Discosoma sp. Red (SMA-DsRed) mouse model (23). We found that Col-I+ and αSMA+ TAFs derive predominantly from local sources, whereas finding TAFs derived from circulating progenitors is a very rare event.
Results
Tumor Growth Is Associated with the Appearance of αSMA and the Continuous Presence of Collagen α1(I)-Expressing Fibroblasts.
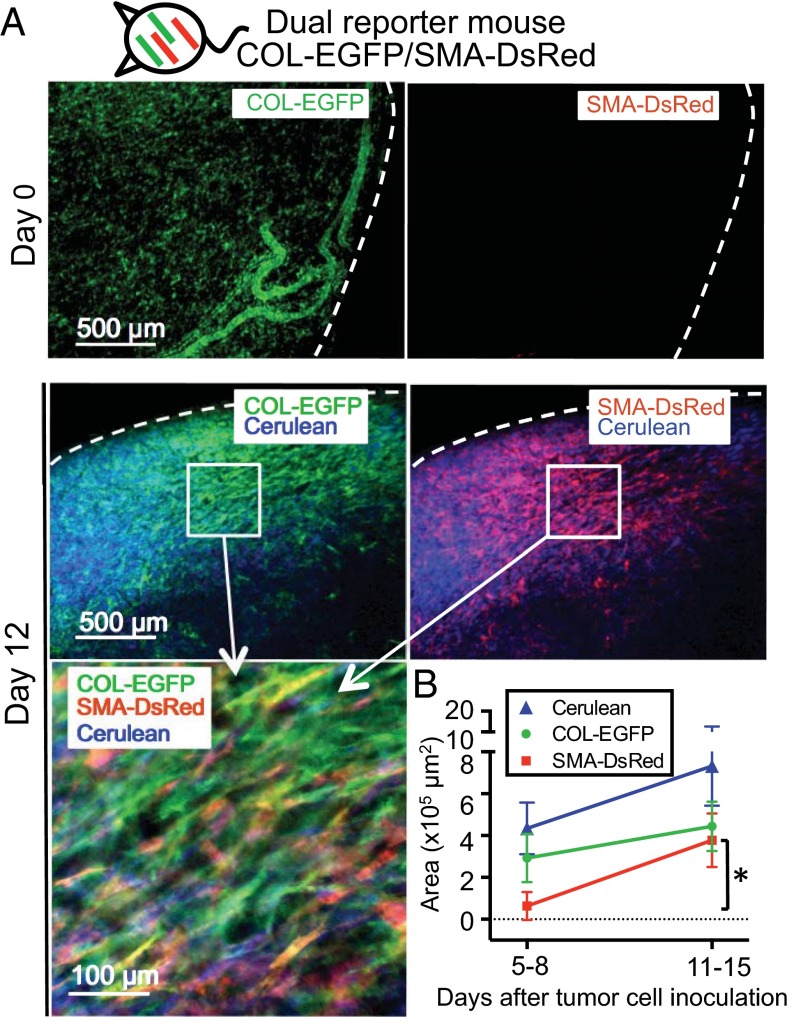
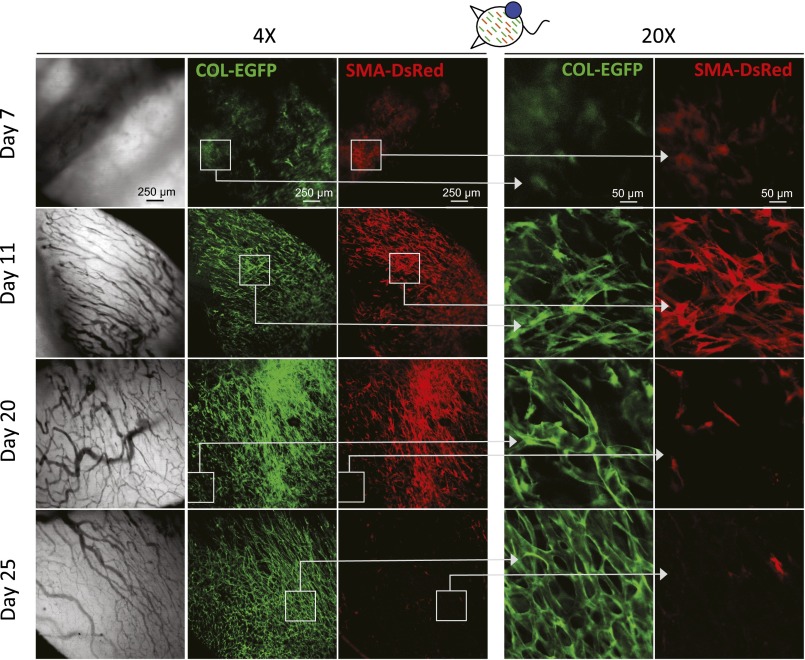
To study the distribution of TAFs during tumor development, we generated dual COL-EGFP/SMA-DsRed reporter mice (23) (Fig. S1) and implanted dorsal skinfold windows and cancer cells for longitudinal analysis of tumors (27). As can be seen in Fig. 1A, healthy skin (day 0) in dual reporter mice shows normal dermal fibroblasts expressing Col-I (COL-EGFP+), whereas the expression of αSMA is rare. After cancer cell inoculation, SMA-DsRed+ cells appeared around days 5–8 and became significantly more abundant around days 11–15 (Fig. 1B, Fig. S2, and Table S1). Expression of COL-EGFP showed an increasing trend between the same time points, although it was not statistically significant (Fig. 1B). The appearance of SMA-DsRed+ cells coincided with the development of tumor vasculature (Fig. S2). Several fibrosarcoma (MC57, Pro4L, and 8101Pro) and one carcinoma (MC38 colon cancer) cell lines growing in immunodeficient or immunocompetent mice rendered similar results (Table S1).
Fig. S1.
Schematic representation of the mouse models used for in vivo imaging experiments using dorsal skinfold window chambers.
Fig. 1.
Tumor growth is associated with the appearance of αSMA and the continuous presence of collagen α1(I)-expressing fibroblasts. (A) Expression of COL-EGFP and SMA-DsRed on healthy skin (day 0) and 12 d after MC57-Cerulean tumor cells were injected in a dual reporter COL-EGFP/SMA-DsRed Rag−/− mouse bearing a dorsal skinfold window chamber. Dotted lines indicate window and tumor boundary. (B) Quantification of the area (mean and SD) occupied by COL-EGFP+, SMA-DsRed+, and Cerulean+ (cancer) cells in images obtained from tumors developing in dual reporter mice. Data were pooled from five independent experiments using COL-EGFP/SMA-DsRed Rag−/− mice injected with MC57, Pro4L, and 8101Pro fibrosarcomas (n = 1 mouse each) and COL-EGFP/SMA-DsRed Rag+/+ mice injected with MC38 colon carcinoma and 8101Pro fibrosarcoma (n = 1 each); all cell lines expressed Cerulean. Two to eight tumor regions were averaged per mouse and time point before pooling the data from individual mice. *P = 0.031.
Fig. S2.
αSMA-DsRed+ cells appear with the onset of vascularization but disappear at later stages in growing s.c. tumors. Expression of COL-EGFP and SMA-DsRed at different times after s.c. injection of MC38 cancer cells in an immunocompetent window chamber-bearing dual reporter COL-EGFP/SMA-DsRed mouse.
Table S1.
Appearance of αSMA-DsRed+ cells in tumors developing in SMA-DsRed C57BL/6 mice
| Tumor | Host | Experiment no. | Days after cancer cell inoculation | |
| First appearance | Maximal numbers | |||
| MC57 | Rag−/− | 1 | 8* | 15† |
| 2 | 8 | 14 | ||
| 3 | 5 | 12 | ||
| 4 | 7 | 13 | ||
| Pro4L | Rag−/− | 1 | 11 | 14 |
| 2 | 7 | 11 | ||
| 8101Pro | Normal | 1 | 8 | 15 |
| Rag−/− | 1 | 7 | 11 | |
| MC38 | Normal | 1 | 7 | 11 |
First day that expression of αSMA-DsRed was observed in tumors growing in window chambers.
Day when the area of αSMA-DsRed+ cells reached its peak in tumors growing in window chambers. Tumors were observed longitudinally once or twice per week.
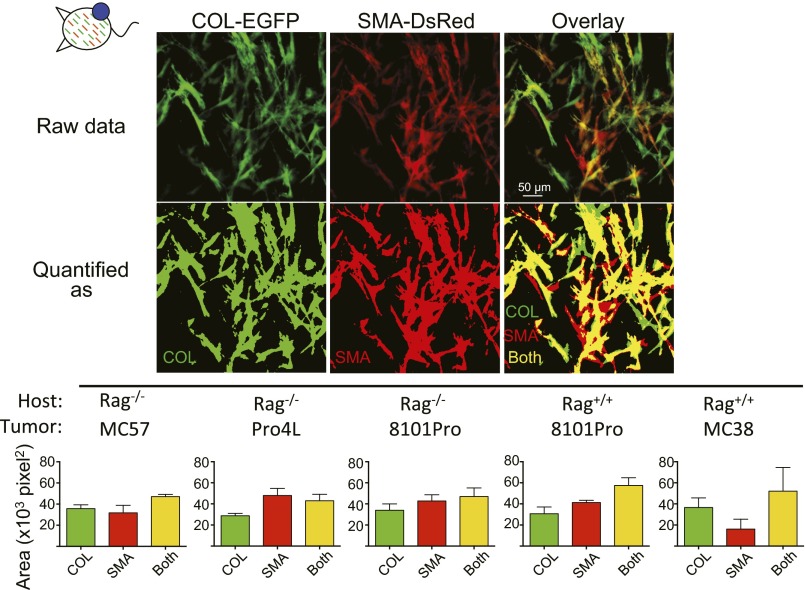
To determine whether αSMA and Col-I were expressed by the same or different cells, colocalization studies were performed in confocal high-magnification images (20×) from established tumors (Fig. S3). More than half of the cells that were positive for Col-I also expressed αSMA and vice versa at days 14–22 of tumor growth (average Mander’s coefficients varied between 0.56 ± 0.04 and 0.77 ± 0.29 for COL-EGFP and 0.56 ± 0.1 and 0.83 ± 0.21 for SMA-DsRed). Therefore, a majority of cells were positive for both markers, but there was always a fraction of cells that expressed only one or the other.
Fig. S3.
Expression of αSMA and collagen α1(I) in established tumors overlap only partially. Colocalization of COL-EGFP and SMA-DsRed expression. The area occupied by green-only and red-only cells or cells that were both green and red was quantified. The areas assigned to each category are shown in a representative example: green (COL), red (SMA), and green+red (both). Averages and SDs from three to five regions per tumor (original magnification 20×) are shown. The images used are from days 14–22 of tumor growth.
Tumor-Associated Fibroblasts Derive Predominantly from Local, and Not Circulating, Precursors.
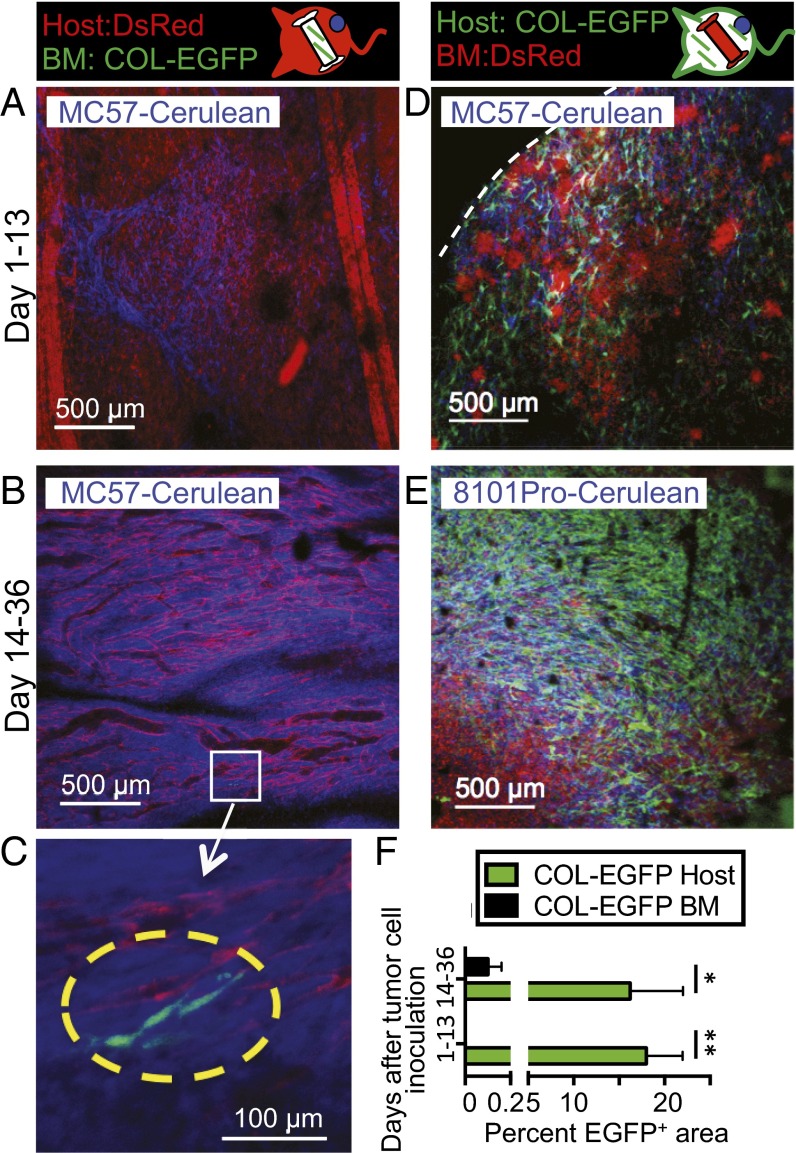
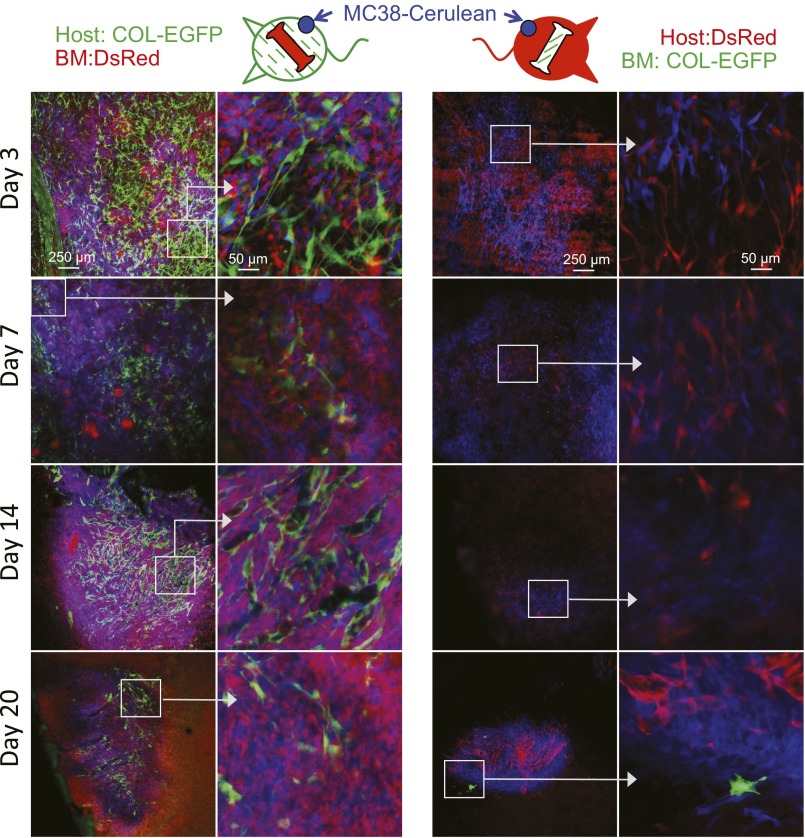
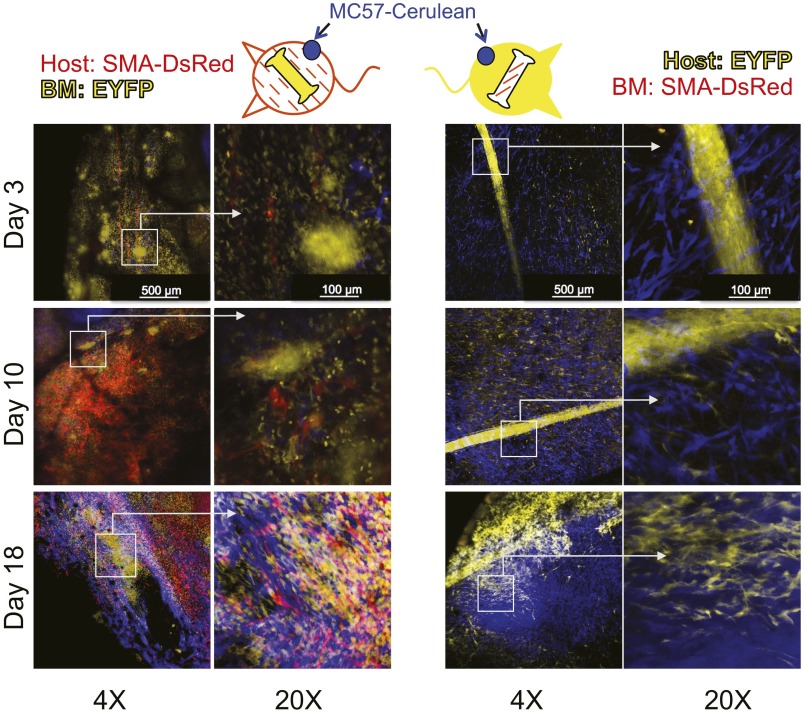
To determine the origin of TAFs, two types of BM chimeric mice were generated from COL-EGFP or SMA-DsRed transgenic mice, in which either only the BM or only the lethally irradiated host had the potential to generate fluorescently labeled fibroblasts. In four independent experiments using four tumor models, TAFs were visible during the first weeks following tumor implantation exclusively in the tumors of the chimeras expressing the transgene in the non-BM (sessile) compartment (Fig. 2 A, D, and F and Fig. S4). After 2–4 wk of tumor growth, only a few BM-derived TAFs were observed in the chimeras that had been reconstituted with BM from COL-EGFP transgenic mice (Fig. 2 B, C, and F and Fig. S4). No BM-derived SMA-DsRed+ cells were found in mice reconstituted with BM from SMA-DsRed transgenic mice in two independent experiments (Fig. S5).
Fig. 2.
Newly transplanted BM precursors do not significantly contribute to form TAFs. (A–E) Representative images from BM chimeric mice in which only the BM (A–C) or only the irradiated host (D and E) expressed the COL-EGFP transgene and were injected with Cerulean-expressing tumor cells in dorsal windows. EGFP-expressing cells were almost exclusively observed when COL-EGFP was expressed in the irradiated host. A few cells derived from BM precursors could be observed only at late time points (yellow dotted line in C). The white dotted line indicates tumor boundary. (F) Quantification of the area (mean and SD) occupied by COL-EGFP+ cells in images from BM chimera experiments. Data have been pooled from four independent longitudinal experiments using MC57 and Pro4L cell lines growing in Rag−/− chimeras and 8101Pro and MC38 growing in Rag+/+ chimeras (n = 1 mouse per cell line). Two to 11 tumor regions were pooled per mouse and time point before pooling the data from individual mice. *P = 0.029, **P = 0.01.
Fig. S4.
TAFs derive predominantly from sessile precursors in a murine colon carcinoma model. Immunocompetent BM chimeric mice in which only the irradiated host (Left) or only the bone marrow (Right) expressed the COL-EGFP transgene were injected with Cerulean-expressing MC38 colon carcinoma in a dorsal window. EGFP-expressing cells were mainly observed when COL-EGFP was expressed in the irradiated host.
Fig. S5.
BM precursors do not contribute to form SMA-DsRed–expressing cells in tumors. BM chimeric mice in which only the BM (Right) or only the irradiated host (Left) expressed the SMA-DsRed transgene were injected with Cerulean-expressing tumor cells in dorsal windows, as in Fig. 2. We could not observe any DsRed+ cells that originated from BM precursors at any time point analyzed in two independent experiments using two different cell lines (MC57 and Pro4L) grown in Rag−/− mice. In contrast, abundant DsRed+ cells were found in chimeras expressing SMA-DsRed in the sessile compartment.
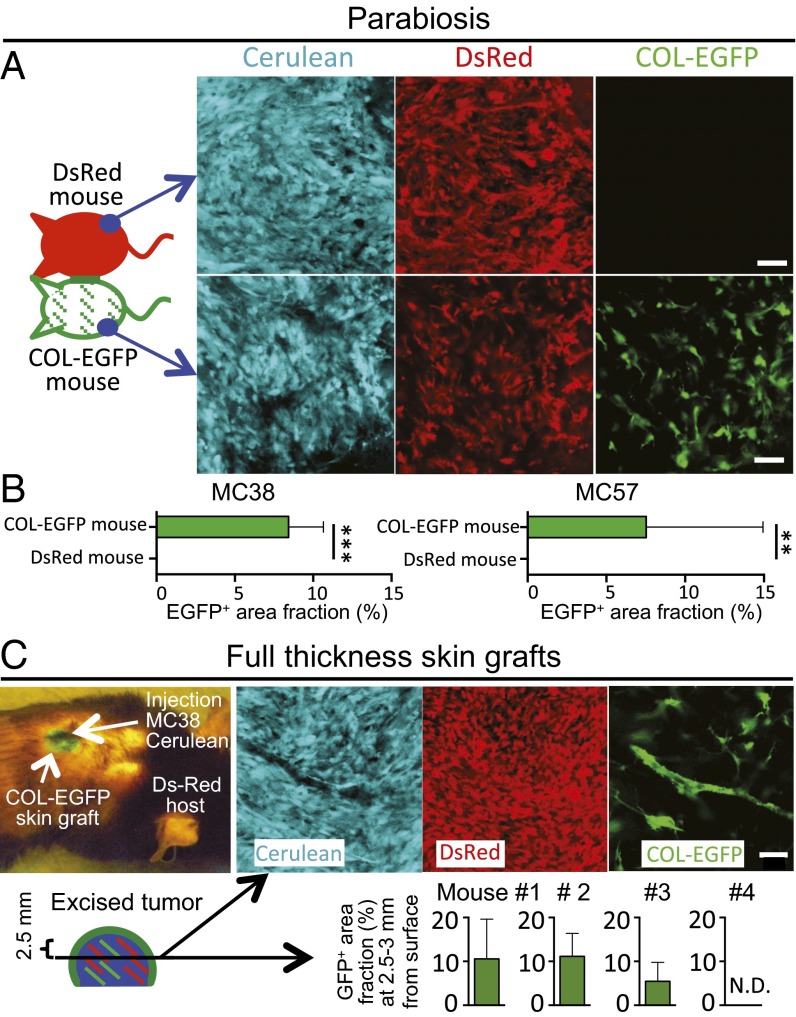
Because the BM chimera model could be limited by an incomplete deletion of mesenchymal stromal cells and engraftment of the newly transferred mesenchymal progenitors in the BM of irradiated mice (28), we generated parabiotic mouse pairs (Fig. 3 A and B). In such pairs, one mouse was COL-EGFP transgenic and the other mouse expressed DsRed ubiquitously under the chicken beta-actin promoter. Around 2 wk after the surgery, the presence of similar percentages of DsRed+ cells in both animals indicated that circulation was shared (Fig. S6). Cancer cells were injected into the distal flanks in both mice. No COL-EGFP+ cells could be found in the tumors grown in the DsRed mice parabiosed to COL-EGFP mice (Fig. 3 A and B). These data in parabiotic mice prove that the collagen α1-expressing TAFs are derived from local sessile precursors. To further investigate the local origin of TAFs, we made use of DsRed mice transplanted with full-thickness skin grafts from COL-EGFP mice (Fig. 3C). Upon s.c. injection of cancer cells underneath the grafts, abundant COL-EGFP+ cells were detected in freshly explanted sections of the tumors. We performed two experiments, one of which is shown in Fig. 3B. In five of seven total mice from two independent experiments, COL-EGFP+ cells could be detected in tumor sections cut 2.5–3 mm below the graft surface and, in three of seven mice, some COL-EGFP+ cells could be found even 4–6 mm from the surface. COL-EGFP+ cells were found in the tumors when cancer cells had been injected either under the center of the grafted skin (4/5 total mice) or into its margin (2/2 mice). Therefore, EGFP+ TAFs had derived from local precursors present in the original COL-EGFP skin grafts.
Fig. 3.
TAFs derive predominantly from local sessile precursors. (A) Parabiotic pairs of mice were created where only one mouse expressed COL-EGFP and the other mouse expressed DsRed ubiquitously. Two pairs were created: pair 1 contained immunocompetent mice with MC38-Cerulean tumors; pair 2 had MC57-Cerulean tumors in Rag−/− mice. On each mouse of the parabiotic pairs, cancer cells were injected into the distal flank. (A) Representative images are shown from the freshly explanted MC57 tumors from pair 2 at week 3 of tumor growth (n = 6–9 areas per tumor; mean and SD). (B) Quantification of the EGFP+ area fraction (mean and SD) in the tumors from parabiosed mice. **P = 0.0022, ***P = 0.001. (C) Full-thickness skin grafts from COL-EGFP mice were transplanted into four DsRed Rag−/− mice. One month later, MC38-Cerulean cancer cells were injected s.c. into the center of the green skin grafts with the help of a UV lamp. At day 12 (mouse 1) or 25 (mice 2–4) of tumor growth, mice were killed and 1- to 2-mm-thick slices were cut from freshly explanted tumors at a distance of 2.5–3 mm from the surface. The area fraction occupied by COL-EGFP+ cells was quantified in 4–17 optical regions per mouse (mean and SD). A second experiment in which cancer cells were injected 2 mo after skin graft transplantation gave similar results (n = 3 mice). N.D., nondetectable. (Scale bars, 50 μm.)
Fig. S6.
Evidence for shared circulation in parabiotic mouse pairs. (A) Peripheral blood was drawn from each mouse in DsRed and COL-EGFP parabiotic mouse pairs from Fig. 3A to provide evidence for shared circulation. FACS plots were generated with the peripheral blood cells after red blood cell lysis. The peripheral blood cells from COL-EGFP mice do not contain EGFP-expressing cells, indicating that type I collagen-expressing cells are not found in the circulation. (B) As technical controls and for instrument settings, peripheral blood cells from a DsRed mouse and an EGFP transgenic mouse with ubiquitous expression of the fluorescent proteins were analyzed in parallel. The numbers indicate the percentage of cells in each quadrant.
Circulating Cells Do Not Contribute Significantly to TAFs in Parabiosed Mice Developing Autochthonous Intestinal Tumors.
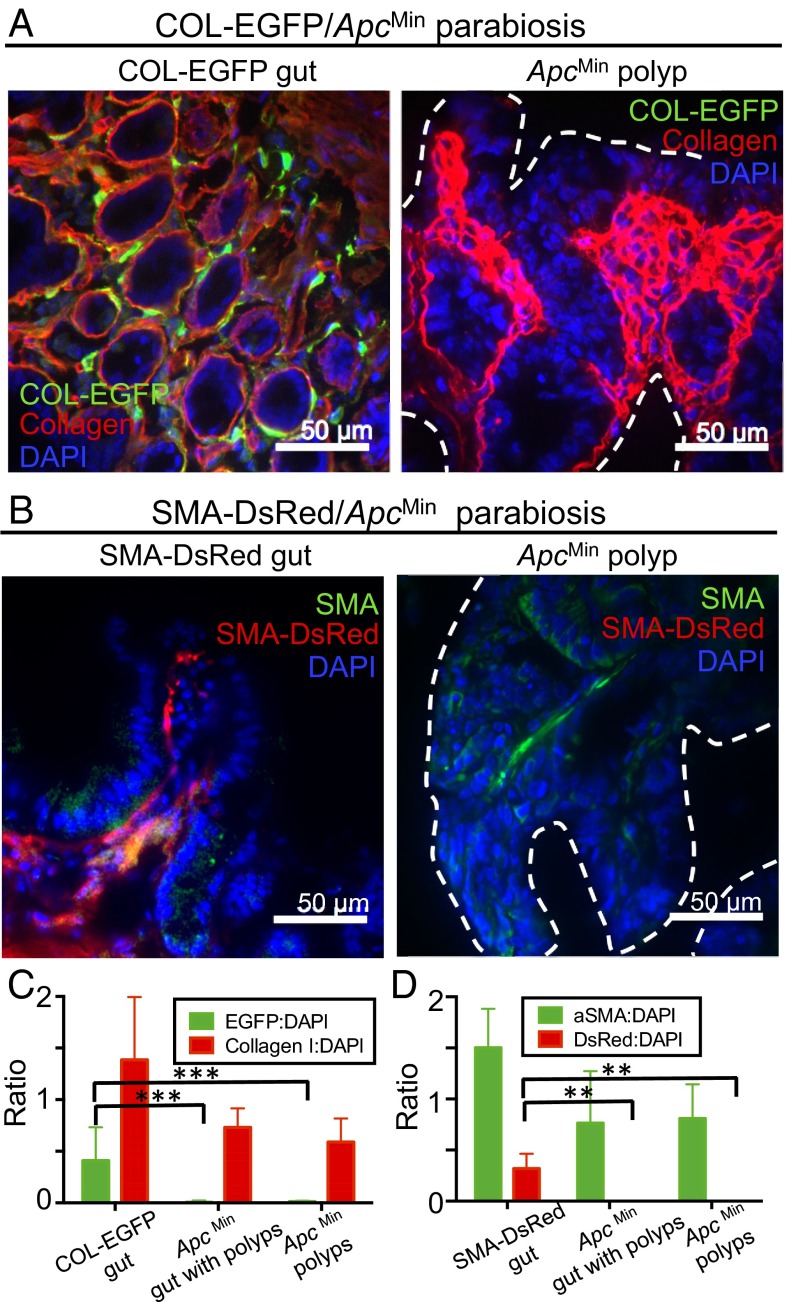
To confirm our results from transplantable models, we parabiosed fibroblast reporter mice (COL-EGFP or SMA-DsRed) with ApcMin (Apc, adenomatosis polyposis coli; Min, multiple intestinal neoplasia) transgenic mice that develop intestinal adenomas starting at puberty (29). This tumor model recreates more closely some aspects of the process of tumorigenesis in humans because tumors are autochthonous. For the COL-EGFP/ApcMin pairs, as can be seen in Fig. 4 A and C, Col-I could readily be detected by immunofluorescence (IF) in the intestine from the COL-EGFP mouse and the ApcMin mouse; however, EGFP could exclusively be found in the COL-EGFP mouse sample. Similarly, no DsRed+, but many αSMA+, cells could be detected in the polyps from an ApcMin mouse parabiosed with an SMA-DsRed mouse for 10 wk (Fig. 4 B and D). Thorough scanning of IF sections from ApcMin mice “Swiss gut rolls,” containing both normal gut and adenomatous tissue, showed that fibroblasts were not recruited from circulation into either healthy or malignant tissue (Fig. 4 C and D). Thus, our results with autochthonous tumors in the parabiosis model support the conclusion that TAFs originate mainly from local sessile precursors.
Fig. 4.
TAFs originating from circulating cells cannot be detected in autochthonous ApcMin intestinal adenomas. ApcMin mice that develop intestinal adenomas were parabiosed with fibroblast reporter mice. Animals were killed when the ApcMin mice became moribund, and intestinal sections were stained with antibodies against EGFP and Col-I (A and C) or DsRed and αSMA (B and D). Representative immunofluorescence images are shown from (A) a COL-EGFP/ApcMin pair parabiosed for 5 wk and (B) an SMA-DsRed/ApcMin pair parabiosed for 10 wk. Dotted lines indicate polyp boundary. Data from experiments shown in A and B are quantified in C and D, respectively, as the ratio of (C) EGFP+ and collagen I+ or (D) DsRed+ and αSMA+ area to nuclear area (DAPI) in positive control sections from normal reporter mouse gut versus sections of Swiss gut rolls containing both normal gut and polyps or only ApcMin polyps from the ApcMin mouse (mean and SD). Quantitative data were derived using 5× magnification images from scanned IF slides, comprising most of the sample (at least 8–11 5× regions per slide or its entirety). Data are from three ApcMin Swiss roll slides and five slides containing only polyps (C), three ApcMin Swiss roll slides, and one slide containing only polyps (D), plus one positive control slide in each case. Two additional parabiosis experiments in the COL-EGFP model showed consistent results. **P < 0.01, ***P < 0.001.
TAFs Constitute One-Third of the Tumor Stroma.
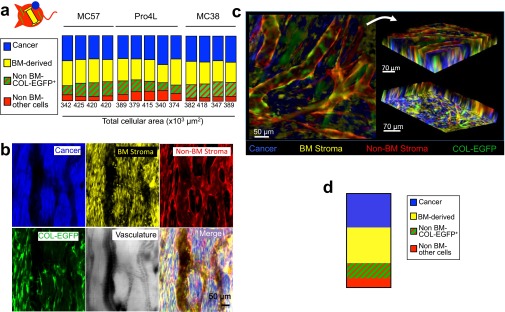
To determine the contribution of each component to the total tumor mass by live microscopy image quantification, mice were used in which the following compartments were color-coded: cancer cells (Cerulean), BM-derived stroma [enhanced yellow fluorescent protein (EYFP)], and non–BM-derived stroma (DsRed) including COL-EGFP+ type I collagen-expressing fibroblasts (DsRed and EGFP) (Figs. S1 and S7 and Movies S1 and S2). Using this approach, collagen-expressing fibroblasts constituted the third most prominent cell type in four different tumors. Cancer cells and BM-derived stromal cells constituted most of the cellular volume, their ratio being about 1:1 (Fig. S7 A and D). The non–BM-derived cells that were negative for COL-EGFP included cells lining the vessels (probably endothelial cells) and most likely some COL-EGFP−αSMA+ fibroblasts (Fig. S7 B and C and Movies S1 and S2).
Fig. S7.
Contribution of the different cellular compartments to the total tumor mass. (A) Parts of the whole graph showing the relative area occupied by the four different cellular compartments in tumors: cancer cells (blue), BM-derived cells (yellow), non–BM-derived cells expressing collagen (red and green), and non–BM-derived cells not expressing collagen (only red). COL-EGFP/DsRed+ mice that also expressed EGFP under the collagen α1(I) promoter were lethally irradiated and reconstituted with BM cells from B6 EYFP+ mice. After 2 mo, window chambers were installed and cancer cells (MC57, Pro4L, or MC38) expressing Cerulean were injected in three independent longitudinal experiments. Hosts were Rag−/− for MC57 and Pro4L, and Rag+/+ for MC38 (n = 1 per cell line). Areas were quantified in images obtained from established 12-d MC38 tumors and 22- to 28-d MC57 and Pro4L tumors (four or five regions per mouse and cell line). Each column represents an individual tumor region. The total cellular area quantified is indicated below each column. On average, fibroblasts accounted for 30 ± 5.8% of the stroma, whereas BM-derived cells were 67 ± 12.2%. (B) Representative images of a region analyzed for quantification in A are shown from a 28-d MC57 tumor. (C) Z stacks were obtained from a 22-d MC57 tumor. Z stacks were generated by acquiring nine images (optical slices) at 8-μm intervals (total depth of 72 μm). Top and bottom views of a 3D reconstruction of a Z stack, corresponding to Movie S1, are shown. (D) The volume occupied by the different cellular compartments in the 3D Z stack was quantified. A representative graph is displayed showing the relative contribution of each compartment to the total cellular volume (2.15 × 108 μm3). Percentages are similar to those in A, where areas were quantified instead of volumes, showing that both approaches rendered similar results.
TAFs Form Perivascular Structures.
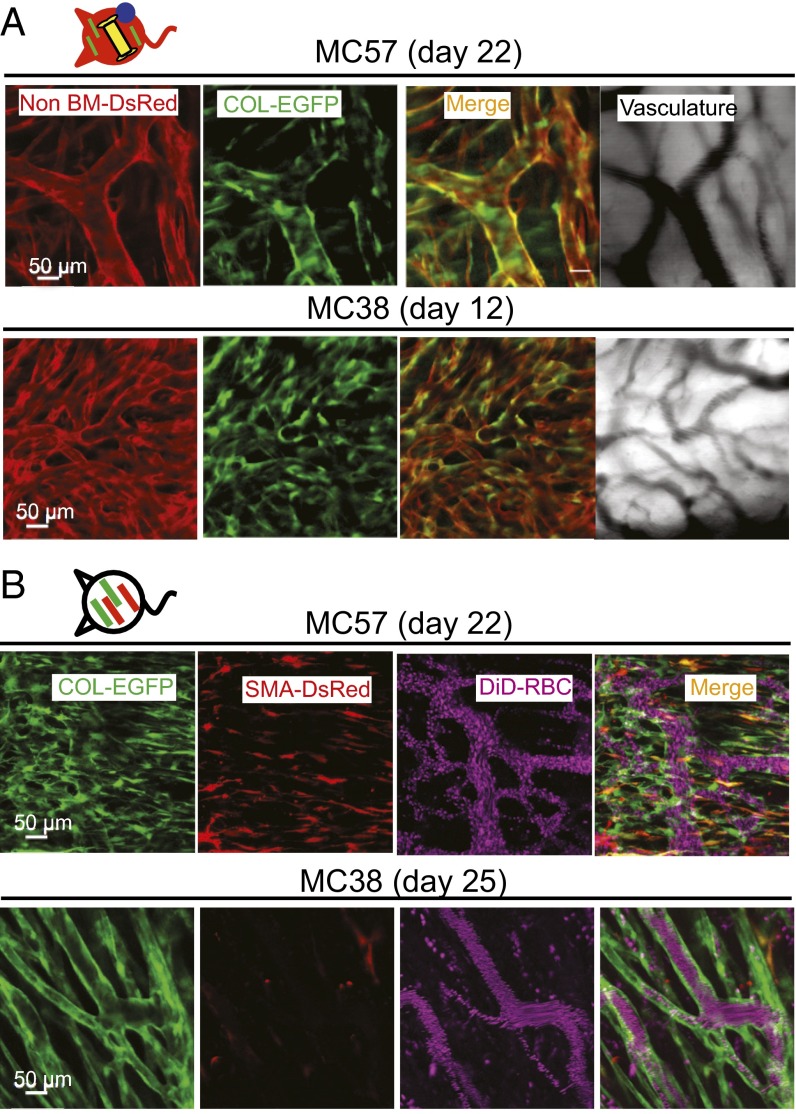
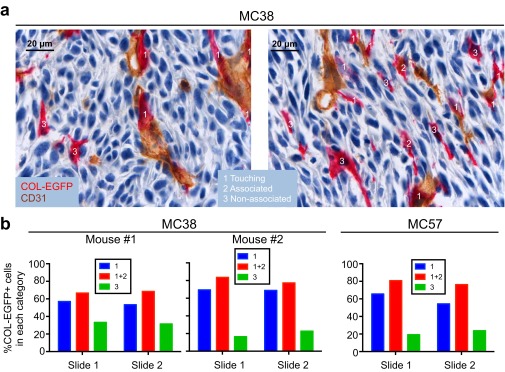
In the “multicolor” tumor model described above, many DsRed+COL-EGFP+ cells wrapped the vessels once the tumor was established (Fig. 5A and Movie S1). Consistently, 66–83% of the total COL-EGFP+ cells were found in close proximity to, or in direct contact with, an endothelial cell by two-color immunohistochemistry (Fig. S8). In dual reporter COL-EGFP/SMA-DsRed mice, COL-EGFP+ cells often formed tubular structures around vessels in well-established tumors (Fig. 5B and Fig. S2). In the same tumors, αSMA+ cells could also be found next to vessels (Fig. S2, day 11), although were less abundant at late stages (Fig. 5B and Fig. S2, MC38, day 25). These data suggest that TAFs associate spatially and temporally with the development of tumor vasculature.
Fig. 5.
Col-I–expressing cells form perivascular structures. (A) COL-EGFP+ cells are found in close association with tumor vessels. COL-EGFP+ structures wrap the DsRed+ vessels in MC57 fibrosarcoma and MC38 carcinoma growing in DsRed+COL-EGFP+ chimeric mice with an EYFP+ BM. Representative images are shown from two out of three independent longitudinal experiments performed with MC57, MC38, and Pro4L-Cerulean tumors (n = 1 mouse each). COL-EGFP+ cells wrapping vessels were observed in normal (non-BM chimeric) COL-EGFP mice in five more independent experiments. (B) SMA-DsRed+ cells do not form tubular structures around vessels in late-stage established tumors. In day 22–25 MC57 and MC38 tumors grown in COL-EGFP/SMA-DsRed dual reporter mice, structures that are COL-EGFP+ but SMA-DsRed− wrap the vessels. DiD-labeled red blood cells (DiD-RBC) were injected i.v. to visualize blood flow. Representative images are shown from two out of three independent longitudinal experiments performed using Cerulean-expressing MC57, Pro4L, and MC38 (n = 1 mouse each). The host was Rag−/− for the MC57 and Pro4L tumors.
Fig. S8.
Most type I collagen-expressing cells locate near endothelial cells in established tumors. MC38 and MC57 cancer cells were injected into COL-EGFP Rag−/− transgenic mice. When tumors were established (2–3 wk), mice were killed and the tumors were processed for CD31 and EGFP two-color immunohistochemistry on frozen sections; 10× magnification images were subjected to automated analysis using Fiji software to determine the distance of each COL-EGFP+ cell (red) to a CD31+ endothelial cell (brown), as detailed in SI Experimental Procedures. Three categories were established according to whether a COL-EGFP+ cell was touching, associated with (i.e., at a distance of less than 6.5 μm from a CD31+ cell), or not associated with a CD31+ endothelial cell. Two representative images are shown in A, with examples of COL-EGFP+ cells in each category. (B) Quantified data from three independent tumors: two MC38 tumors and one MC57 tumor. Two tumor sections (slides) were quantified per tumor. The number of COL-EGFP+ cells analyzed per slide was between 72 and 176. The majority (more than 50%) of COL-EGFP+ cells were found to be touching or associated with CD31+ cells within each tumor slide. Binomial test P values were as follows: MC38: mouse 1: P = 0.00147, P = 0.00046; mouse 2: P = 0.00000, P = 0.00000; MC57: P = 0.00000, P = 0.00000.
Discussion
In contrast to other stromal cells [e.g., pericytes (30), macrophages (31), and endothelial cells (32)], the origin of TAFs has remained unresolved. Here we show that TAFs derive predominantly from local sessile precursors and only rarely from BM circulating cells. Recruitment of BM-derived circulating cells to the tumor was uncompromised, as the majority of the stromal compartment was BM-derived.
Three lines of experimentation support the main conclusion of this study. (i) In BM chimeric mice, fibroblast reporter genes were expressed almost exclusively in cells derived from the non-BM compartment. (ii) In parabiotic pairs of COL-EGFP and DsRed mice, DsRed cells were abundant in the tumor grown in the COL-EGFP transgenic partner, whereas COL-EGFP+ cells could not be detected in the tumor grown in the DsRed mouse; similarly, no COL-EGFP+ cells were found in autochthonous tumors from ApcMin mice parabiosed to COL-EGFP mice. (iii) COL-EGFP+ TAFs were found in tumors developing in skin grafts from COL-EGFP mice transplanted into nonreporter mice.
The process of recruitment and activation of fibroblasts in growing tumors is not well-understood. Leukocytes play an important role in promoting skin wound healing by secreting IL-22, which activates extracellular matrix production and expression of αSMA by dermal fibroblasts (33). Importantly, in wound healing, as well as in renal fibrosis, fibroblasts are also predominantly derived from local tissues (22, 34–37). It is plausible that tumor stromal BM-derived cells could similarly secrete factors that recruit local fibroblast precursors and induce their activation. Consistently, we found an almost immediate (14-h) infiltration of leukocytes into cancer cell inoculation sites (27) and a delay in the expression of αSMA compared with the earlier observation of αSMA−COL-EGFP+ TAFs (Fig. 1 and Fig. S2). The close proximity of BM-derived stromal cells and fibroblasts in tumors (Fig. S7) would allow easy access of leukocyte-produced factors to neighboring cells. Alternatively, resident fibroblasts may convert into tumor-promoting TAFs through TGF-β– and SDF-1–mediated autocrine signaling loops (38).
The partial overlap between expression of αSMA+ and Col-EGFP observed by us (Fig. S3) and others (23, 35), may reflect different states of activation of the promoters. The expression of Col-I seems to be more stable and probably detects most of the fibroblasts, whereas αSMA could be induced or decreased under certain circumstances such as active tumor formation and/or neovascularization. Interestingly, many COL-EGFP+ cells in the tumor wrapped vessels, forming “sheaths.” This is somewhat surprising, because Col-I is not generally considered a component of the vessel wall. This wrapping was not so evident with αSMA-expressing cells, maybe because of the more transient expression of αSMA (Fig. 5B and Fig. S2). However, αSMA expression began with tumor vascularization, therefore temporally correlating with the development of tumor vessels. These findings are consistent with abundant in vitro experimental evidence showing the role of fibroblasts in endothelial cell tubulogenesis by promoting vessel sprouting and, especially, formation of intercellular lumens (reviewed in ref. 39). Endothelial cells also produce extracellular matrix metalloproteinase inducer (EMMPRIN), which drives induction of αSMA and activation of fibroblasts (40). The production of ECM and VEGF by living fibroblasts in close association with endothelial cells seems to be required for tubulogenesis to occur (41). Our conclusions are also consistent with the suggested local origin of pericytes in tumors (30). It is therefore possible that some of the αSMA- and/or Col-I–expressing cells we describe are pericytes, although costaining with other markers (42) would be necessary to properly characterize them.
Although we do not know the precise identity of the local precursors of type I collagen- and αSMA-expressing cells, mesenchymal progenitors (30) or mesenchymal stem cells (MSCs) are likely candidates. MSCs are radioresistant (43, 44), reside in multiple organs in perivascular locations (45), and have migratory capability (45). It has even been speculated that all MSCs could be pericytes, although not all pericytes are MSCs (46). Therefore, MSCs, pericytes, and most fibroblasts in tumors may well represent various states of differentiation of the same cellular lineage.
Multiple factors contribute to the contradictory reports on the origin of TAFs. First is the lack of specificity of most of the markers used to identify TAFs (24). Second, there is some confusion about the terminology referring to circulating mesenchymal precursors. This terminology has sometimes been applied to hematopoietic (nonmesenchymal) precursors that differentiate into cells with fibroblastoid morphology (47). It is thought that the number of TAF precursors circulating in blood might be extremely low (47–49). Third, many studies highlight the BM contribution to mesenchymal cells in tumors without a side-by-side comparison of the relative contributions of circulating versus local sources (10, 12, 50). In our hands, the BM contribution is minimal compared with the contribution of the non-BM compartment. Interestingly, we observed occasional BM-derived TAFs only at later time points during tumor development and only in the BM chimera setting, whereas we could not detect any BM-derived TAFs in the experiments in parabiotic mice. We cannot exclude the possibility that under certain pathophysiological conditions, such as the injury induced by total-body irradiation, the contribution of circulating precursors to TAFs can be increased. Finally, identification of TAFs in most previous studies relied on morphology and immunofluorescence of tumor sections. This is reminiscent of the controversy involving the origin of endothelial cells in tumors, in that marker colocalization on a single cell in tumor sections can be easily mistaken for two juxtaposing/overlapping cells, as shown previously for endothelial cells (32). The predominant origin of endothelial cells was eventually shown to be local (32). Here, we reach the same conclusion about TAFs through the direct observation of live or freshly explanted tumors.
We have shown previously that both BM and non-BM compartments of tumor stroma must be targeted for T cell-mediated tumor eradication (51, 52). TAFs are also targets for other types of cancer therapy in preclinical studies (53–57) and even in clinical trials (58–60) because of their role in tumor promotion and resistance to drug therapy (reviewed in ref. 26) and immunosuppression (61). A better understanding of the origins and development of TAFs is essential for successful targeting. Our results should not discourage strategies to target tumor stroma such as genetic manipulation of mesenchymal stem cells. However, this manipulation has to occur at the site of tumor growth. If mesenchymal stem cells were to be used as “Trojan horses” (62), we would need to learn to attract them efficiently from distant sources. Until this is achieved, local therapies such as radiotherapy may be more appropriate than systemic treatments to target the formation of mesenchymal stroma. Our findings should also encourage the search for more selective targets for destroying or inhibiting TAFs, based on the unique transcriptional and response patterns of fibroblasts from different sites/organs of the body.
Experimental Procedures
COL-EGFP (63) and SMA-DsRed (αSMA-RFP) mice (23) were a generous gift from D. A. Brenner (University of California, San Diego, La Jolla, CA). Tg(ACTB-DsRed*MST)1Nagy/J and 129-Tg(ACTB-EYFP)7AC5Nagy/J mice expressing the red fluorescent protein variant DsRed.MST or EYFP gene, respectively, under the control of the chicken beta-actin promoter coupled with the cytomegalovirus immediate-early enhancer were backcrossed to C57BL/6 mice for 20 generations and then crossed to Rag-1 KO mice to obtain DsRed and EYFP Rag-1 KO mice, respectively. All strains were purchased from The Jackson Laboratory. Mice were bred and maintained in a specific pathogen-free barrier facility at The University of Chicago according to Institutional Animal Care and Use Committee (IACUC) guidelines. All animal experiments were approved by the IACUC of The University of Chicago. Methylcholanthrene-induced MC57G fibrosarcoma was provided by P. Ohashi (University of Toronto, Toronto, Canada), with permission of H. Hengartner (University Hospital Zurich, Zurich, Switzerland). The fibrosarcoma cell lines Pro4L and 8101Pro were induced by UV light in C3H/HeN and C57BL/6 mice, respectively (64, 65). MC38 colon adenocarcinoma was induced by s.c. injection of dimethylhydrazine in C57BL/6 mice (66), and was generously provided by A. Schietinger and P. Greenberg (University of Washington, Seattle, WA). MC57, Pro4L, and 8101Pro fibrosarcomas and MC38 carcinoma were retrovirally infected with pMFG-Cerulean (27) and FACS-sorted to generate lines expressing the fluorescent protein Cerulean. More methods are available in SI Experimental Procedures.
SI Experimental Procedures
Bone Marrow Chimeras.
To generate colored BM chimeras, recipient mice were lethally irradiated (800 cGy) and reconstituted within the next 24 h with 5 × 10⁶ BM cells from donor mice. For most of the BM chimeric mice that received window chambers, surgery was done 2–3 mo after BM reconstitution, or up to 19 mo after BM reconstitution for one experiment.
In Vivo and ex Vivo Microscopy.
Dorsal skinfold windows were surgically implanted into the backs of anesthetized mice as in ref. 27. Immediately after surgical implantation of the window, 1–3 × 10⁶ Cerulean-expressing tumor cells (single-cell suspension in a total volume of 100 μL) were placed within it. A glass window was placed to cover the exposed tissue and secured with a snap C ring. Tumor development was monitored by fluorescence confocal microscopy using a Leica TCS SP5 II tandem scanner two-photon spectral confocal microscope with XY motorized stage. Long-working distance 20×/N.A. 0.45 and 4×/N.A. 0.16 dry lenses were from Olympus and a 25×/N.A. 0.95 water lens was from Leica. Excitation (ex) wavelengths were CFP 458, EGFP 488, EYFP 514, DsRed 561, and DiD 633 nm. Narrow emission (em) windows were used at peak emission to minimize cross-talk of probes [e.g., (458,463–478; 488,493–502; 514,528–541; 561,576–694; 633,697–736; respectively) (ex,em)]. Our imaging method involves a window over an unrestrained, growing tumor (27). Unlike early window chamber models, in which both the front and rear epidermal layers of skin were surgically removed and covered by two glass slides, here only one layer was removed in a circular area of ∼1 cm in diameter, leaving the rear skin layer with its dermis and fascia intact. During the first imaging session, within 1 wk after surgery, all areas (usually two to five) containing live fluorescent cancer cells and fibroblasts within the 1-cm-diameter window were imaged at low magnification (4×). Within those 4× regions, about two to six representative 20× images per d and mouse were taken; 20× regions were selected on the basis of (i) showing fibroblasts and (ii) being as distant as possible from each other, to cover the sample as thoroughly as possible. The same initial 4× areas were revisited and imaged as long as viable during the subsequent sessions, at one to two sessions per wk. If the original 4× regions became nonviable at some point during the experiment and any new live regions had developed in the meantime, these new regions were subsequently tracked instead. The tumors in our imaging system grow “freely” above the window, but when they reach a large size the center of the tumor becomes necrotic, which prevents us from continuing imaging beyond 28 ± 8 d, when viable tissue is no longer found within the window. The depth of penetration into the tissue that is reached for imaging with this technique is ∼100–300 μm (27). Mice were anesthetized with inhaled isoflurane during the imaging sessions. For visualization of the tumor vasculature, some mice were injected with DiD-labeled red blood cells (RBCs). RBCs were obtained from the peripheral blood of B6 Rag−/− mice and stained with DiD (Invitrogen) for 30 min at 37 °C. After three washes with PBS, DiD-labeled RBCs were injected intravenously. For ex vivo visualization of tumors grown in parabiotic mice or mice transplanted with skin grafts, mice were euthanized and tumors were freshly explanted. One- to 2-mm-thick sections were cut at different depths and kept in PBS during the imaging session. Sections were imaged for the presence of COL-EGFP+ cells. The fraction of EGFP+ area was quantified in COL-EGFP+ cells containing tumor images between six and nine per tumor. An equivalent or higher number of tumor regions were examined in samples where no COL-EGFP+ cells could be found.
Quantitative Analysis of Images.
To determine the colocalization of SMA-DsRed and COL-EGFP expression, images from dual reporter mice were analyzed using Imaris (Bitplane) and Fiji (67). The DsRed and COL-EGFP areas were determined using automatic thresholding, and the colocalization areas were then calculated and quantified. Data were corrected for partial cell colocalization by subtracting the percentage of “colocalized” particles whose size was smaller than a cell. Fiji was used to determine the fraction of area occupied by the different cell subpopulations in multicolor BM chimera mice. To quantify volumes from Z stacks, two approaches were followed, rendering similar results. First, the areas occupied by the different cell populations were measured in the individual optical slices and the resulting total areas were multiplied by the voxel depth and total number of optical slices. Alternatively, the 3D Objects Counter function from Fiji was used, and the resulting 3D object volumes were added up for each channel. Three-dimensional Z stacks were reconstructed and digitally processed using Imaris to generate Movies S1 and S2. A macro was created in Fiji to automatically analyze distances of EGFP+ cells to CD31+ cells. Two-color immunohistochemistry images were subjected to color deconvolution to separate red and brown color signals. Those images were contrast-inverted to display signal on a black background. CD31+ signal was automatically thresholded using the Otsu method (https://imagej.nih.gov/ij/plugins/otsu-thresholding.html). Signal area was measured and masks of cells were created. Candidate cells were limited to a minimum size to exclude subcellular objects from analysis. A Euclidean distance map was created from this CD31+ thresholded area mask. EGFP+ area was similarly thresholded and mask-created. Measurements on the EGFP+ masks were redirected to the CD31+ distance map to obtain the distance of each EGFP+ cell to CD31+ cells. A list of individual EGFP cells and their distances to CD31+ cells was exported to Excel. EGFP+ cells at a minimum distance of 0 pixels from CD31+ cells were counted as “touching.” EGFP+ cells at a minimum distance of less than 100 pixels (6.5 μm; cutoff based on observation of multiple 100× pictures) were considered “associated with” an endothelial cell. Remaining EGFP+ cells were considered not associated with an endothelial cell. The fraction of EGFP+ cells in each category was established by analyzing a minimum of 70 COL-EGFP+ cells from a total of 7–19 representative 100× images per section, taken randomly from viable tumor regions (i.e., excluding necrotic regions).
Parabiosis Experiments.
Mice were anesthetized with isoflurane and united by the technique of Wright et al. (68). Buprenorphin was injected s.c. every 12 h for a minimum of 48 h postsurgery or until all signs of pain were absent. DsRed Rag+/+ or Rag+/− were joined at 12–20 wk with age-matched COL-EGFP Rag+/+ or Rag+/− mice, respectively. Cancer cells were s.c. injected into both parabionts 14–21 d after surgery. Blood chimerism was checked before cancer cell injection by flow cytometry to detect the percentage of DsRed+ circulating cells in each mouse. ApcMin mice were joined at 6–8 wk to age-matched COL-EGFP or SMA-DsRed mice. The pair was sacrificed when the ApcMin mouse became moribund, between 5 and 10 wk after surgery. Blood chimerism was checked before mouse sacrifice by injecting DiD-labeled red blood cells i.v. into one mouse and detecting DiD+ cells in circulation in the other mouse within 2.5 h by flow cytometry. At the moment of sacrifice, ApcMin mice had between 99 and 193 polyps in the intestines. In two instances, the pair had to be sacrificed 3 wk after surgery because of health issues in the fibroblast reporter mouse (COL-EGFP). In those two cases, the ApcMin mice had 7 and 27 polyps at the moment of sacrifice. After sacrifice, tissues were fixed by intracardiac perfusion with PBS followed by 4% (vol/vol) paraformaldehyde (PFA). The intestines were retrieved, cut into four equal-length parts, flushed with PBS, cut open, fixed for 4 h at room temperature in PBS with 4% PFA, 10% (wt/vol) sucrose, cryoprotected by overnight 4-°C incubation in 30% sucrose, and frozen in OCT as Swiss gut rolls. For intestinal segments containing fewer than 10 polyps, individual polyps were excised and preserved in OCT in “polyp-only–containing sections,” to ensure the presence of tumor tissue on the slide.
Immunofluorescence and Immunohistochemistry.
The presence of adenomatous polyps in frozen ApcMin intestine samples was first verified by touch-prep H&E staining. Once the presence of malignant tissue was confirmed, 4-μm-thick sections were cut serially on salinized slides (Dako). After a short (10-min) enzymatic antigen retrieval treatment, sections were stained with the following antibodies in humidified chambers, in successive 1-h incubations: for SMA-DsRed staining: rabbit anti-RFP (Rockland) or control rabbit IgG (Zymed) followed by goat anti-rabbit Alexa Fluor (Invitrogen), then mouse monoclonal anti–SMA-FITC clone 1A4 (Sigma) followed by goat anti-FITC (Pierce) and donkey anti-goat Alexa Fluor 488 (Abcam); for COL-EGFP staining: goat anti–GFP-DyLight 488 (Rockland) or goat IgG isotype control Alexa Fluor 488 (Bioss), then rabbit anti-collagen I (Abcam) or rabbit IgG control (Zymed) followed by goat anti-rabbit Alexa Fluor 647 (Invitrogen). Sections were mounted using ProLong Diamond Antifade Mountant with DAPI from Life Technologies. Reporter mouse intestine sections were processed in parallel in each experiment as positive controls for the stainings. IF images were acquired on an Olympus spinning-disk confocal microscope using 10×/N.A. 0.3 dry or 40×/N.A. 1.0 oil lenses. IF sections were also scanned in their entirety using a CRi Pannoramic Scan Whole Slide Scanner (PerkinElmer) with a 20× lens. Pannoramic view software was used to capture images at 5× magnification comprising the whole sample (for polyp-only–containing sections) or 80–100% of the sample in Swiss roll sections. Images were then exported to Fiji and fluorescent areas were quantified for the different channels, using the same threshold for all of the images acquired on the same day and with the same instrument settings. Immunohistochemistry staining for CD31 and EGFP was performed on 4-μm-thick frozen sections from OCT-embedded mouse tumor blocks. Briefly, following gentle retrieval in 3× diluted Bond Enzyme solution (Leica Biosystems) for 10 min, the sections were incubated for 10 min in Dual Endogenous Enzyme block (Dako) and endogenous biotin was blocked using an Avidin/Biotin Blocking Kit (Vector Laboratories) according to the manufacturer’s protocol. Subsequently, sections were incubated with monoclonal rat anti-mouse CD31 antibody (clone MEC13.3; BD Biosciences) at 1:50 dilution for 60 min followed by biotinylated goat anti-rat IgG (H+L) (Vector Laboratories) at 1:400 for 30 min and treatment with the Vectastain Elite ABC Detection System (Vector Laboratories) for 30 min, followed by peroxidase development in a liquid DAB+ substrate chromogen solution (Dako) under microscope control for 10 min. Subsequently, sections were transferred to a Bond-III automated IHC/ISH platform (Leica Microsystems) and incubated with rabbit anti-GFP antibody (Rockland) at 1:400 for 25 min followed by treatment with the alkaline phosphatase Bond Polymer Refine Red Detection System (Leica Biosystems) for 25 min, and then alkaline phosphatase reaction development with chromogen provided in the detection system. Sections were counterstained with hematoxylin for 5 min, dehydrated in alcohols, cleared in xylene, and cover-spilled. Negative controls omitting anti-CD31 and anti-GFP antibodies were run in parallel. Sections were photographed at 100× oil-objective magnification using an Olympus BX53 microscope and ProgRes 2/3′′ CCD 5.0 Mpix camera with ProgRes CapturePro software (Jenoptik Optical Systems).
Skin Transplantation.
The back skin of euthanized donor mice was cleaned with 70% ethanol. Segments of skin (1 × 1 cm) were removed with sterile scissors and attached to a Petri dish maintained at 4 °C, where they were kept moist with a sterile gauze soaked in 0.9% NaCl. Recipient mice were anesthetized with ketamine/xylazine. The surgical site was shaved and disinfected with povidone-iodine. Using sterile curved scissors, an area of full-thickness back skin was removed. The donor skin graft was placed on the prepared graft bed and secured with two Band-Aids. After 7 d, the adhesive Band-Aids were removed.
Statistical Analysis.
Binomial tests were used for each mouse to test whether the proportions of COL-EGFP+ cells associated with CD31+ cells within each tumor slice were greater than 50% (Fig. S8). Quantifications of the areas occupied by COL-EGFP+, SMA-DsRed+, and Cerulean+ cells in images obtained from tumors grown in dual reporter mice at two different time points were compared using Wilcoxon signed-rank tests (Fig. 1B). All other group comparisons for continuous parameters were tested using either one-sided (Fig. 2F) or two-sided two-sample Wilcoxon rank-sum tests. P values were evaluated at the 5% significance level. All analyses were performed in R version 3.2.2 (R Foundation for Statistical Computing, Vienna, Austria, https://www.R-project.org).
Supplementary Material
Acknowledgments
We thank David A. Brenner for the generous donation of the COL-EGFP and SMA-DsRed mice, and F. Gounari for the generous donation of the ApcMin mice. We also thank Christine Labno, Shirley Bond, Rolando Torres, Dorothy Kane, Christian Friese, and Khashayarsha Khazaie for expert assistance with technical protocols; Karin Schreiber for providing animals for experiments; Sydeaka Watson from the University of Chicago Biostatistics Core for help with statistical analysis; and Donald A. Rowley, Boris Engels, David Binder, and Douglas Fearon for productive discussions. This work was supported by National Institutes of Health Grants P01-CA97296, R01-CA22677, and R01-CA37516; the Berlin Institute of Health and Einstein Foundation (H.S.); and the Ludwig Foundation (R.R.W.). A.A. had a fellowship from Fundación Alfonso Martín Escudero (Spain).
Footnotes
The authors declare no conflict of interest.
This article is a PNAS Direct Submission.
Data deposition: Imaging data reported in this paper have been deposited in The Cell Image Library www.cellimagelibrary.org/.
This article contains supporting information online at www.pnas.org/lookup/suppl/doi:10.1073/pnas.1600363113/-/DCSupplemental.
References
- 1.Metchnikoff E. Leçons sur la pathologie comparée de l’inflammation. Faites à l’Institut Pasteur en Avril et Mai 1891. Masson; Paris: 1892. [Google Scholar]
- 2.Maximov A. Culture of blood leukocytes. From lymphocytes and monocytes to connective tissue. Arch Exp Zellforsch. 1928;5:169–268. [Google Scholar]
- 3.Friedenstein A. Stromal-hematopoietic interrelationships: Maximov’s ideas and modern models. Haematol Blood Transfus. 1989;32:159–167. doi: 10.1007/978-3-642-74621-5_27. [DOI] [PubMed] [Google Scholar]
- 4.Bucala R, Spiegel LA, Chesney J, Hogan M, Cerami A. Circulating fibrocytes define a new leukocyte subpopulation that mediates tissue repair. Mol Med. 1994;1(1):71–81. [PMC free article] [PubMed] [Google Scholar]
- 5.Labat ML, et al. Cystic fibrosis: Production of high levels of uromodulin-like protein by HLA-DR blood monocytes differentiating towards a fibroblastic phenotype. Biomed Pharmacother. 1991;45(9):387–401. doi: 10.1016/0753-3322(91)90003-c. [DOI] [PubMed] [Google Scholar]
- 6.Kuwana M, et al. Human circulating CD14+ monocytes as a source of progenitors that exhibit mesenchymal cell differentiation. J Leukoc Biol. 2003;74(5):833–845. doi: 10.1189/jlb.0403170. [DOI] [PubMed] [Google Scholar]
- 7.Abe R, Donnelly SC, Peng T, Bucala R, Metz CN. Peripheral blood fibrocytes: Differentiation pathway and migration to wound sites. J Immunol. 2001;166(12):7556–7562. doi: 10.4049/jimmunol.166.12.7556. [DOI] [PubMed] [Google Scholar]
- 8.Phillips RJ, et al. Circulating fibrocytes traffic to the lungs in response to CXCL12 and mediate fibrosis. J Clin Invest. 2004;114(3):438–446. doi: 10.1172/JCI20997. [DOI] [PMC free article] [PubMed] [Google Scholar]
- 9.LaRue AC, et al. Hematopoietic origins of fibroblasts: I. In vivo studies of fibroblasts associated with solid tumors. Exp Hematol. 2006;34(2):208–218. doi: 10.1016/j.exphem.2005.10.009. [DOI] [PubMed] [Google Scholar]
- 10.Reddy K, Zhou Z, Schadler K, Jia SF, Kleinerman ES. Bone marrow subsets differentiate into endothelial cells and pericytes contributing to Ewing’s tumor vessels. Mol Cancer Res. 2008;6(6):929–936. doi: 10.1158/1541-7786.MCR-07-2189. [DOI] [PMC free article] [PubMed] [Google Scholar]
- 11.Spaeth EL, et al. Mesenchymal stem cell transition to tumor-associated fibroblasts contributes to fibrovascular network expansion and tumor progression. PLoS One. 2009;4(4):e4992. doi: 10.1371/journal.pone.0004992. [DOI] [PMC free article] [PubMed] [Google Scholar]
- 12.Quante M, et al. Bone marrow-derived myofibroblasts contribute to the mesenchymal stem cell niche and promote tumor growth. Cancer Cell. 2011;19(2):257–272. doi: 10.1016/j.ccr.2011.01.020. [DOI] [PMC free article] [PubMed] [Google Scholar]
- 13.Chang HY, et al. Diversity, topographic differentiation, and positional memory in human fibroblasts. Proc Natl Acad Sci USA. 2002;99(20):12877–12882. doi: 10.1073/pnas.162488599. [DOI] [PMC free article] [PubMed] [Google Scholar]
- 14.Sági B, et al. Positional identity of murine mesenchymal stem cells resident in different organs is determined in the postsegmentation mesoderm. Stem Cells Dev. 2012;21(5):814–828. doi: 10.1089/scd.2011.0551. [DOI] [PubMed] [Google Scholar]
- 15.Higuchi Y, et al. Gastrointestinal fibroblasts have specialized, diverse transcriptional phenotypes: A comprehensive gene expression analysis of human fibroblasts. PLoS One. 2015;10(6):e0129241. doi: 10.1371/journal.pone.0129241. [DOI] [PMC free article] [PubMed] [Google Scholar]
- 16.Mukudai S, et al. Differential responses to steroid hormones in fibroblasts from the vocal fold, trachea, and esophagus. Endocrinology. 2015;156(3):1000–1009. doi: 10.1210/en.2014-1605. [DOI] [PMC free article] [PubMed] [Google Scholar]
- 17.Flaberg E, et al. The architecture of fibroblast monolayers of different origin differentially influences tumor cell growth. Int J Cancer. 2012;131(10):2274–2283. doi: 10.1002/ijc.27521. [DOI] [PubMed] [Google Scholar]
- 18.Klein G. Evolutionary aspects of cancer resistance. Semin Cancer Biol. 2014;25:10–14. doi: 10.1016/j.semcancer.2014.01.001. [DOI] [PubMed] [Google Scholar]
- 19.Klein-Goldberg A, Maman S, Witz IP. The role played by the microenvironment in site-specific metastasis. Cancer Lett. 2014;352(1):54–58. doi: 10.1016/j.canlet.2013.08.029. [DOI] [PubMed] [Google Scholar]
- 20.Paget S. Distribution of secondary growths in cancer of the breast. Lancet. 1889;133(3421):571–573. [PubMed] [Google Scholar]
- 21.Cormack DH. Essential Histology. 2nd Ed Lippincott Williams & Wilkins; Philadelphia: 2001. [Google Scholar]
- 22.Roufosse C, et al. Bone marrow-derived cells do not contribute significantly to collagen I synthesis in a murine model of renal fibrosis. J Am Soc Nephrol. 2006;17(3):775–782. doi: 10.1681/ASN.2005080795. [DOI] [PubMed] [Google Scholar]
- 23.Magness ST, Bataller R, Yang L, Brenner DA. A dual reporter gene transgenic mouse demonstrates heterogeneity in hepatic fibrogenic cell populations. Hepatology. 2004;40(5):1151–1159. doi: 10.1002/hep.20427. [DOI] [PubMed] [Google Scholar]
- 24.Kalluri R, Zeisberg M. Fibroblasts in cancer. Nat Rev Cancer. 2006;6(5):392–401. doi: 10.1038/nrc1877. [DOI] [PubMed] [Google Scholar]
- 25.De Wever O, Demetter P, Mareel M, Bracke M. Stromal myofibroblasts are drivers of invasive cancer growth. Int J Cancer. 2008;123(10):2229–2238. doi: 10.1002/ijc.23925. [DOI] [PubMed] [Google Scholar]
- 26.Polanska UM, Orimo A. Carcinoma-associated fibroblasts: Non-neoplastic tumour-promoting mesenchymal cells. J Cell Physiol. 2013;228(8):1651–1657. doi: 10.1002/jcp.24347. [DOI] [PubMed] [Google Scholar]
- 27.Schietinger A, et al. Longitudinal confocal microscopy imaging of solid tumor destruction following adoptive T cell transfer. OncoImmunology. 2013;2(11):e26677. doi: 10.4161/onci.26677. [DOI] [PMC free article] [PubMed] [Google Scholar]
- 28.Morikawa S, et al. Prospective identification, isolation, and systemic transplantation of multipotent mesenchymal stem cells in murine bone marrow. J Exp Med. 2009;206(11):2483–2496. doi: 10.1084/jem.20091046. [DOI] [PMC free article] [PubMed] [Google Scholar]
- 29.Moser AR, Pitot HC, Dove WF. A dominant mutation that predisposes to multiple intestinal neoplasia in the mouse. Science. 1990;247(4940):322–324. doi: 10.1126/science.2296722. [DOI] [PubMed] [Google Scholar]
- 30.De Palma M, et al. Tie2 identifies a hematopoietic lineage of proangiogenic monocytes required for tumor vessel formation and a mesenchymal population of pericyte progenitors. Cancer Cell. 2005;8(3):211–226. doi: 10.1016/j.ccr.2005.08.002. [DOI] [PubMed] [Google Scholar]
- 31.Cortez-Retamozo V, et al. Origins of tumor-associated macrophages and neutrophils. Proc Natl Acad Sci USA. 2012;109(7):2491–2496. doi: 10.1073/pnas.1113744109. [DOI] [PMC free article] [PubMed] [Google Scholar]
- 32.Purhonen S, et al. Bone marrow-derived circulating endothelial precursors do not contribute to vascular endothelium and are not needed for tumor growth. Proc Natl Acad Sci USA. 2008;105(18):6620–6625. doi: 10.1073/pnas.0710516105. [DOI] [PMC free article] [PubMed] [Google Scholar]
- 33.McGee HM, et al. IL-22 promotes fibroblast-mediated wound repair in the skin. J Invest Dermatol. 2013;133(5):1321–1329. doi: 10.1038/jid.2012.463. [DOI] [PMC free article] [PubMed] [Google Scholar]
- 34.Ross R, Everett NB, Tyler R. Wound healing and collagen formation. VI. The origin of the wound fibroblast studied in parabiosis. J Cell Biol. 1970;44(3):645–654. doi: 10.1083/jcb.44.3.645. [DOI] [PMC free article] [PubMed] [Google Scholar]
- 35.Lin SL, Kisseleva T, Brenner DA, Duffield JS. Pericytes and perivascular fibroblasts are the primary source of collagen-producing cells in obstructive fibrosis of the kidney. Am J Pathol. 2008;173(6):1617–1627. doi: 10.2353/ajpath.2008.080433. [DOI] [PMC free article] [PubMed] [Google Scholar]
- 36.Barisic-Dujmovic T, Boban I, Clark SH. Fibroblasts/myofibroblasts that participate in cutaneous wound healing are not derived from circulating progenitor cells. J Cell Physiol. 2010;222(3):703–712. doi: 10.1002/jcp.21997. [DOI] [PubMed] [Google Scholar]
- 37.Rinkevich Y, et al. Skin fibrosis. Identification and isolation of a dermal lineage with intrinsic fibrogenic potential. Science. 2015;348(6232):aaa2151. doi: 10.1126/science.aaa2151. [DOI] [PMC free article] [PubMed] [Google Scholar]
- 38.Kojima Y, et al. Autocrine TGF-beta and stromal cell-derived factor-1 (SDF-1) signaling drives the evolution of tumor-promoting mammary stromal myofibroblasts. Proc Natl Acad Sci USA. 2010;107(46):20009–20014. doi: 10.1073/pnas.1013805107. [DOI] [PMC free article] [PubMed] [Google Scholar]
- 39.Hughes CC. Endothelial-stromal interactions in angiogenesis. Curr Opin Hematol. 2008;15(3):204–209. doi: 10.1097/MOH.0b013e3282f97dbc. [DOI] [PMC free article] [PubMed] [Google Scholar]
- 40.Huet E, et al. Extracellular matrix metalloproteinase inducer/CD147 promotes myofibroblast differentiation by inducing alpha-smooth muscle actin expression and collagen gel contraction: Implications in tissue remodeling. FASEB J. 2008;22(4):1144–1154. doi: 10.1096/fj.07-8748com. [DOI] [PubMed] [Google Scholar]
- 41.Berthod F, Germain L, Tremblay N, Auger FA. Extracellular matrix deposition by fibroblasts is necessary to promote capillary-like tube formation in vitro. J Cell Physiol. 2006;207(2):491–498. doi: 10.1002/jcp.20584. [DOI] [PubMed] [Google Scholar]
- 42.Morikawa S, et al. Abnormalities in pericytes on blood vessels and endothelial sprouts in tumors. Am J Pathol. 2002;160(3):985–1000. doi: 10.1016/S0002-9440(10)64920-6. [DOI] [PMC free article] [PubMed] [Google Scholar]
- 43.Dickhut A, et al. Mesenchymal stem cells obtained after bone marrow transplantation or peripheral blood stem cell transplantation originate from host tissue. Ann Hematol. 2005;84(11):722–727. doi: 10.1007/s00277-005-1067-8. [DOI] [PubMed] [Google Scholar]
- 44.Bartsch K, et al. Mesenchymal stem cells remain host-derived independent of the source of the stem-cell graft and conditioning regimen used. Transplantation. 2009;87(2):217–221. doi: 10.1097/TP.0b013e3181938998. [DOI] [PubMed] [Google Scholar]
- 45.Crisan M, et al. A perivascular origin for mesenchymal stem cells in multiple human organs. Cell Stem Cell. 2008;3(3):301–313. doi: 10.1016/j.stem.2008.07.003. [DOI] [PubMed] [Google Scholar]
- 46.Caplan AI. All MSCs are pericytes? Cell Stem Cell. 2008;3(3):229–230. doi: 10.1016/j.stem.2008.08.008. [DOI] [PubMed] [Google Scholar]
- 47.He Q, Wan C, Li G. Concise review: Multipotent mesenchymal stromal cells in blood. Stem Cells. 2007;25(1):69–77. doi: 10.1634/stemcells.2006-0335. [DOI] [PubMed] [Google Scholar]
- 48.Wexler SA, et al. Adult bone marrow is a rich source of human mesenchymal ‘stem’ cells but umbilical cord and mobilized adult blood are not. Br J Haematol. 2003;121(2):368–374. doi: 10.1046/j.1365-2141.2003.04284.x. [DOI] [PubMed] [Google Scholar]
- 49.da Silva Meirelles L, Chagastelles PC, Nardi NB. Mesenchymal stem cells reside in virtually all post-natal organs and tissues. J Cell Sci. 2006;119(Pt 11):2204–2213. doi: 10.1242/jcs.02932. [DOI] [PubMed] [Google Scholar]
- 50.Direkze NC, et al. Bone marrow contribution to tumor-associated myofibroblasts and fibroblasts. Cancer Res. 2004;64(23):8492–8495. doi: 10.1158/0008-5472.CAN-04-1708. [DOI] [PubMed] [Google Scholar]
- 51.Spiotto MT, Rowley DA, Schreiber H. Bystander elimination of antigen loss variants in established tumors. Nat Med. 2004;10(3):294–298. doi: 10.1038/nm999. [DOI] [PubMed] [Google Scholar]
- 52.Zhang B, Karrison T, Rowley DA, Schreiber H. IFN-gamma- and TNF-dependent bystander eradication of antigen-loss variants in established mouse cancers. J Clin Invest. 2008;118(4):1398–1404. doi: 10.1172/JCI33522. [DOI] [PMC free article] [PubMed] [Google Scholar]
- 53.Schüler T, Körnig S, Blankenstein T. Tumor rejection by modulation of tumor stromal fibroblasts. J Exp Med. 2003;198(10):1487–1493. doi: 10.1084/jem.20030849. [DOI] [PMC free article] [PubMed] [Google Scholar]
- 54.Ostermann E, et al. Effective immunoconjugate therapy in cancer models targeting a serine protease of tumor fibroblasts. Clin Cancer Res. 2008;14(14):4584–4592. doi: 10.1158/1078-0432.CCR-07-5211. [DOI] [PubMed] [Google Scholar]
- 55.Huang S, et al. Evaluation of the tumor targeting of a FAPα-based doxorubicin prodrug. J Drug Target. 2011;19(7):487–496. doi: 10.3109/1061186X.2010.511225. [DOI] [PubMed] [Google Scholar]
- 56.Olive KP, et al. Inhibition of Hedgehog signaling enhances delivery of chemotherapy in a mouse model of pancreatic cancer. Science. 2009;324(5933):1457–1461. doi: 10.1126/science.1171362. [DOI] [PMC free article] [PubMed] [Google Scholar]
- 57.Provenzano PP, et al. Enzymatic targeting of the stroma ablates physical barriers to treatment of pancreatic ductal adenocarcinoma. Cancer Cell. 2012;21(3):418–429. doi: 10.1016/j.ccr.2012.01.007. [DOI] [PMC free article] [PubMed] [Google Scholar]
- 58.Hofheinz RD, et al. Stromal antigen targeting by a humanised monoclonal antibody: An early phase II trial of sibrotuzumab in patients with metastatic colorectal cancer. Onkologie. 2003;26(1):44–48. doi: 10.1159/000069863. [DOI] [PubMed] [Google Scholar]
- 59.Narra K, et al. Phase II trial of single agent Val-boroPro (talabostat) inhibiting fibroblast activation protein in patients with metastatic colorectal cancer. Cancer Biol Ther. 2007;6(11):1691–1699. doi: 10.4161/cbt.6.11.4874. [DOI] [PubMed] [Google Scholar]
- 60.Eager RM, et al. Phase II trial of talabostat and docetaxel in advanced non-small cell lung cancer. Clin Oncol (R Coll Radiol) 2009;21(6):464–472. doi: 10.1016/j.clon.2009.04.007. [DOI] [PubMed] [Google Scholar]
- 61.Kraman M, et al. Suppression of antitumor immunity by stromal cells expressing fibroblast activation protein-alpha. Science. 2010;330(6005):827–830. doi: 10.1126/science.1195300. [DOI] [PubMed] [Google Scholar]
- 62.Studeny M, et al. Mesenchymal stem cells: Potential precursors for tumor stroma and targeted-delivery vehicles for anticancer agents. J Natl Cancer Inst. 2004;96(21):1593–1603. doi: 10.1093/jnci/djh299. [DOI] [PubMed] [Google Scholar]
- 63.Yata Y, et al. DNase I-hypersensitive sites enhance alpha1(I) collagen gene expression in hepatic stellate cells. Hepatology. 2003;37(2):267–276. doi: 10.1053/jhep.2003.50067. [DOI] [PubMed] [Google Scholar]
- 64.Singh S, Ross SR, Acena M, Rowley DA, Schreiber H. Stroma is critical for preventing or permitting immunological destruction of antigenic cancer cells. J Exp Med. 1992;175(1):139–146. doi: 10.1084/jem.175.1.139. [DOI] [PMC free article] [PubMed] [Google Scholar]
- 65.Dubey P, et al. The immunodominant antigen of an ultraviolet-induced regressor tumor is generated by a somatic point mutation in the DEAD box helicase p68. J Exp Med. 1997;185(4):695–705. doi: 10.1084/jem.185.4.695. [DOI] [PMC free article] [PubMed] [Google Scholar]
- 66.Rosenberg SA, et al. A new approach to the therapy of cancer based on the systemic administration of autologous lymphokine-activated killer cells and recombinant interleukin-2. Surgery. 1986;100(2):262–272. [PubMed] [Google Scholar]
- 67.Schindelin J, et al. Fiji: An open-source platform for biological-image analysis. Nat Methods. 2012;9(7):676–682. doi: 10.1038/nmeth.2019. [DOI] [PMC free article] [PubMed] [Google Scholar]
- 68.Wright DE, Wagers AJ, Gulati AP, Johnson FL, Weissman IL. Physiological migration of hematopoietic stem and progenitor cells. Science. 2001;294(5548):1933–1936. doi: 10.1126/science.1064081. [DOI] [PubMed] [Google Scholar]
Associated Data
This section collects any data citations, data availability statements, or supplementary materials included in this article.


