

Abstract
Please cite this paper as: Cornwell B. (2012) Unemployment and widespread influenza in America, 1999–2010. Influenza and Other Respiratory Viruses 6(1), 63–70.
Background Research shows that unemployment reduces access to health care and vaccines and increases financial difficulty, family conflict, and other sources of stress that are known to suppress immune function. In addition, seasonal unemployment rates parallel seasonal influenza activity. Following a theory that argues that macroeconomic conditions affect population health, this paper examines whether there is an association between monthly unemployment rates and influenza activity.
Methods Data from influenza activity surveillance reports from the Centers for Disease Control and Prevention are combined with information from the Bureau of Labor Statistics on state‐level unemployment rates in the U.S. for the flu seasons between 1999 and 2010. Pooled time‐series cross‐section logistic regression analyses are conducted to examine the effect of the unemployment rate on the likelihood of widespread and/or regional influenza activity in the 48 contiguous states throughout this period. A total of 3712 state‐month observations are examined.
Results Net of other factors included in the multivariate regression analysis, a one‐percentage‐point increment in the unemployment rate is associated with between a 7·1% and 37·0% increment in the odds of widespread influenza (Odds ratio = 1·21). Likewise, a one‐percentage‐point increment in the unemployment rate is associated with between a 17·1% and 44·7% increment in the odds of at least regional influenza (Odds ratio = 1·30). Results hold regardless of whether time‐varying state‐level characteristics are included.
Conclusions Higher state‐level unemployment increases the likelihood of regional and widespread influenza activity.
Keywords: Epidemic, influenza, seasonal, social factors, unemployment
Seasonal influenza, which typically involves a marked increase in flu infections during winter months, poses a persistent threat to populations in temperate climates. It is estimated that 24·7 million Americans contract and more than 40 000 people die from seasonal influenza each year. 1 Influenza viruses spread through direct or indirect interpersonal contacts – through aerosolization or the direct transmission of respiratory droplets (e.g. because of coughing or sneezing), via direct physical contact with an infected individual (e.g. a handshake), or through contact with contaminated surfaces. 2 Influenza can survive on non‐porous surfaces and then transfer to a person’s hands for up to 24 hours. 3 Factors that help to account for variation in seasonal influenza activity include viral evolution, seasonal host health, and seasonal climate change, as well as social factors such as air travel, and local social mixing and crowding patterns. 4 , 5 , 6
This paper examines the possibility that population‐level unemployment rates, given their seasonal nature, also contribute to seasonal influenza activity. Research shows that other population health measures, such as the mortality rate, are affected by macroeconomic conditions including annual GDP per capita and unemployment. 7 , 8 One reason for this is that fluctuation in the business cycle leads to stress and skill obsolescence, which disproportionately affect socioeconomically disadvantaged individuals. 9 Macroeconomic conditions may therefore help to explain seasonal influenza activity because of their influences on health. Researchers have documented consequences of socioeconomic disadvantage for individuals’ access to health care and exposure to stressful events that suppress immune function. 10 People who lack health insurance and who have low household income are less likely to receive influenza vaccination. 11 , 12 Unemployed persons also have no access to flu vaccination programs that are organized by employers to reduce downstream labor costs caused by worker absenteeism. 13 Beyond this, unemployment leads to increases in stress, loneliness, depression, low self‐esteem, and financial strain, which can increase susceptibility to infection. 14 , 15 , 16 , 17 , 18 , 19 , 20
Furthermore, it is important to note that the risk of influenza infection is not solely a function of individual‐level experiences. For one, broader labor market conditions can have an effect on individuals’ immune function that is independent of those individuals’ own employment situations. Fear of job loss and perceived job insecurity during periods of high unemployment increase psychological distress and morbidity even among employed persons. 21 , 22 , 23 In addition, there is evidence that employed persons who escape layoffs experience more stress, depression, and illness because of the combined effects of job insecurity, guilt, and increased workloads. 24 , 25 , 26 , 27 , 28 The partners and children of unemployed individuals also experience health problems because of the stresses of financial difficulty and family conflict. 29 , 30 Furthermore, because influenza is an infectious disease that diffuses through direct and indirect interpersonal contact, it spreads from unemployed individuals to others in a way that other health outcomes that have been linked to macroeconomic conditions (e.g. cardiovascular disease, cirrhosis, accidental death, and suicide) do not. For all of these reasons, we might expect to find higher rates of influenza activity in the general population (including unemployed as well as employed individuals) in areas where unemployment is high.
Methods
This analysis examines the impact of the level of unemployment on levels of flu activity in a given area. I use reports of overall influenza activity provided by the Centers for Disease Control and Prevention (CDC). Influenza surveillance coordinators and epidemiologists in each state summarize data on influenza activity levels for CDC each week throughout the regular flu season (October through mid May). Their summaries are based on a number of data inputs, including virologic surveillance reports from public health laboratories, medical centers, and outpatient care sites, as well as vital statistics, and estimates derived from diffusion models.
State epidemiologists cull and analyze these data then provide a summary assessment of flu activity levels within their state each week: ‘no activity,’‘sporadic,’‘local,’‘regional,’ or ‘widespread.’ The ‘widespread’ classification is of particular interest, as it indicates serious levels of flu activity, which have immediate public health implications. Influenza is classified as widespread when there is evidence of ‘outbreaks of influenza or increases in [influenza‐like illness], and recent laboratory‐confirmed influenza, in at least half the regions of the state.’ 31 The ‘regional’ classification is similar to the widespread classification but indicates that influenza activity is only evident in more than two but fewer than half of the regions of a state. ‘Local’ refers to outbreaks of influenza a single region of the state, while ‘sporadic’ activity reflects small numbers of laboratory‐confirmed influenza cases reported or a single outbreak, but no recent increase in cases of influenza‐like illness. These classifications lack precision, but they are less prone to selection bias caused by differential access to health care that plague mortality and hospital data. I record these classifications for each week comprising the 1999–2000 through the 2010–2011 flu seasons. In my analysis, I focus primarily on specifying the association between unemployment and the likelihood of ‘widespread’ influenza activity. Because ‘regional’ activity is not trivial and is often a precursor of widespread activity, I also conduct a parallel set of analyses in which I specify the risk of the lower threshold of widespread or regional influenza activity during a given time period.
Measurement of unemployment
State‐specific unemployment data are available from the Bureau of Labor Statistics (BLS) via the monthly Current Population Surveys (CPS). The CPS is a monthly survey of about 50 000 households conducted by the Bureau of the Census. An individual is classified as unemployed if s/he does not have a job, s/he has actively looked for work at some point in the past 4 weeks, and s/he is currently available for work. These cases are aggregated each month by state and expressed as a percent of the total labor force. This definition focuses on people who want to be working but are not and thereby captures the relative size of the most affected segment of the population. The BLS often adjusts unemployment rates for typical seasonal unemployment (e.g. because of seasonal fluctuation in construction, agricultural, or tourism work). I present analyses that use the original unadjusted rates, as seasonal unemployment is also a source of uncertainty, stress, and poverty in some areas. 32 , 33 However, supplementary analyses that use seasonally adjusted unemployment rates yield comparable results (available upon request).
Statistical analysis
Centers for Disease Control and Prevention reports state influenza activity levels on a weekly basis during the regular flu season, while state‐level unemployment data are only available by month. To estimate the relationship between unemployment and influenza activity levels, I construct a set of state‐month observations for all flu seasons between October 1999 and December 2010. I use the weekly influenza activity reports to determine the highest level of flu activity reported for each state during each month of the study period. The analysis includes all months between October and May for each flu season, yielding 91 months of observations. The primary dependent variable, Y, is a dichotomous indicator of whether influenza activity was ever ‘widespread’ during the month in question. A secondary dependent variable indicates whether influenza activity was ever ‘widespread’ or ‘regional’ during the month in question.
Given that these outcomes are dichotomous and vary over time, a logistic time‐series cross‐section regression model is appropriate:
where P is the probability that flu is ‘widespread’ (Y = 1) in a given state during a given month‐year. X includes a set of 11 predictors of influenza that are measured for a given state in the month prior to the observation (described later), where the state’s unemployment rate is the primary predictor of interest. Because influenza has a predictable seasonal pattern, T is a set of 17 fixed effects that specify the time period of the observation, including six separate parameters for the month of the observation (e.g. January) as well as 11 parameters for the flu season in which it occurs (e.g. 2009–2010). To capture unobserved unit heterogeneity, the model incorporates fixed effects for each state, S, which control for factors that could affect the overall rate of influenza spread in a given state, such as geographic size, transportation infrastructure, number of large cities, as well as differences in influenza surveillance strategies and resources. 34 Finally, to attenuate autocorrelation across time points within states and to capture the survivability of the virus, the model also includes Y s, t−1, which is an indicator of whether flu was widespread in the state in question in the month prior to the outcome observation.
X includes 10 time‐varying state‐specific covariates alongside the measure of unemployment. First, the seasonality of both influenza activity and the unemployment rate has been linked to climate, as the survivability of influenza viruses is greater where air is cool and dry. 6 The peak of influenza during the winter months may also be due to behavioral changes like more frequent congregation of groups indoors. 35 Failure to take climate into account may therefore result in omitted variable bias that yields misleading estimates of the impact of unemployment on influenza. As proxies for climatic factors that may affect influenza survivability, I use data on temperature (°F) and precipitation (in inches) compiled by the Northeast Regional Climate Center (NRCC). The data include daily measurements by multiple stations within each state. I average these across all days and stations to generate mean averages for each state‐month for the entire period. Including both average temperature and precipitation variables simultaneously resulted in variance inflation, but removing one or the other does not change the results.
Spatial autocorrelation is a potential concern, as the influenza activity level in one state could reflect broader regional factors. States are not only exposed to similar climates as adjacent states, they are also exposed to influenza viruses circulating within adjacent states because of interstate travel associated with daily commutes and commerce. This facilitates the between‐state progression of influenza. 36 To take this into account, I identify all states that border a given state and calculate the average influenza activity levels (measured ordinally: 0 = ‘no activity,’ 3 = ‘widespread’) of those states in the previous month. This measure, which is included in X, is an approximation of the extent to which influenza is encroaching on a given state at a given time.
A number of other covariates may vary with both influenza activity and unemployment. Using monthly CPS data, I created measures of the size of the labor force, percent urban (spatial concentration of the population), percent college‐educated and percent impoverished, percent married, average household size, and age for the month prior to the observation in question. These are state‐month‐specific covariates that are also included in X. Because these measures are so sluggish and do not change much from month to month within states, they are effectively collinear with the state fixed effects and therefore give rise to major variance inflation. Norming these variables within states by expressing them as z‐scores for the state in question (e.g. for a given state, how many standard deviations below/above the norm was the observed percent of residents who were college‐educated in a given month, as compared with all other months observed for that state) eliminated this multicollinearity.
I limit the analysis to months during the flu season – October through May. Because influenza activity surveillance is not reported for September, there are no data on previous time points to predict the October observations. This restricts outcomes to be predicted by the models to those that occur during the 7‐month period between November and May, which is when epidemic peaks are most evident. 37 With 48 contiguous states and an observation for each of 7 months between the 1999–2000 flu season, and for the first 2 months of the 2010–2011 flu season, this equals 79 time periods, and a total of 3792 possible state‐months of observation. There are 80 observations missing because of missing reports of influenza activity during a given month in a given state (or in adjoining states), yielding a total of 3712 valid state‐month observations.
Results
Table 1 displays the distribution of influenza activity levels across states, by month, from October 1999 to December 2010. Widespread influenza activity designations are least common in November, April, and May and are most common in February, with 43·1% of states reaching that level of influenza activity at least once during that month. A similar pattern is evident when the lower threshold of ‘regional or widespread’ activity is used. A seasonal connection between influenza activity and the unemployment rate becomes evident when comparing the distribution of influenza activity levels to the distribution of the average unadjusted unemployment rate across states, by month, during the study period (Figure 1). Unemployment peaks in January, 1 month prior to the peak in the prevalence of widespread and regional influenza activity.
Table 1.
Estimates of average monthly state‐level unemployment rates and influenza activity levels during the regular flu season, November 1999–December 2010 (N = 3712)*
| Month | Proportion of states reporting influenza level: | Average state‐level Unemployment rate (95% CI) | |
|---|---|---|---|
| Widespread (95% CI) | Regional or widespread (95% CI) | ||
| November | 0·103 (0·078, 0·128) | 0·183 (0·151, 0·215) | 5·243 (5·073, 5·413) |
| December | 0·177 (0·146, 0·209) | 0·387 (0·346, 0·427) | 5·338 (5·164, 5·511) |
| January | 0·296 (0·257, 0·335) | 0·687 (0·647, 0·727) | 5·931 (5·760, 6·102) |
| February | 0·431 (0·389, 0·474) | 0·729 (0·691, 0·768) | 5·867 (5·691, 6·043) |
| March | 0·337 (0·296, 0·377) | 0·596 (0·553, 0·638) | 5·731 (5·555, 5·907) |
| April | 0·064 (0·043, 0·085) | 0·211 (0·176, 0·246) | 5·256 (5·086, 5·427) |
| May | 0·017 (0·006, 0·029) | 0·060 (0·040, 0·081) | 5·233 (5·057, 5·408) |
*Estimates are based on observations that are included in the multivariate regression analysis.
Figure 1.
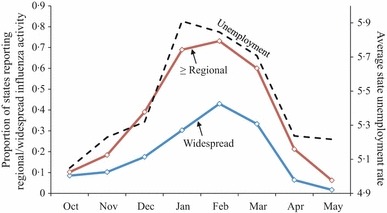
Average proportion of states reporting regional and/or widespread influenza and average state‐level unemployment rate during the regular flu season, October 1999–December 2010 (N = 4367 state‐month observations). aThe figure is based on all observations for which data are available.
Table 2 displays trends in influenza activity for the flu seasons that comprise the study period, from 1999 to 2010. In general, both influenza activity and unemployment increased during the study period. The most recent season for which complete data are available – the 2009–2010 flu season – peaked unusually early. The beginning of that season was the most active on record for this study period (93·8% of states reported regional or widespread activity in November 2009), while the typical peak of flu season (February) was one of the two weakest peaks on record for the study period (14·6% of states reported regional or widespread activity in February 2010).
Table 2.
Estimates of average monthly state‐level unemployment rates and influenza activity levels for ten consecutive regular flu seasons, November 1999–May 2010 (N = 3618)*
| Flu season | Average number of months at influenza level: | Average state‐level Unemployment rate (95% CI) | |
|---|---|---|---|
| Widespread (95% CI) | Regional or widespread (95% CI) | ||
| 1999–2000 | 0·164 (0·124, 0·204) | 0·368 (0·316, 0·420) | 3·867 (3·763, 3·972) |
| 2000–2001 | 0·082 (0·052, 0·112) | 0·322 (0·272, 0·373) | 4·078 (3·976, 4·179) |
| 2001–2002 | 0·125 (0·089, 0·160) | 0·398 (0·345, 0·451) | 5·367 (5·249, 5·486) |
| 2002–2003 | 0·112 (0·078, 0·147) | 0·374 (0·321, 0·426) | 5·612 (5·501, 5·723) |
| 2003–2004 | 0·225 (0·180, 0·270) | 0·374 (0·321, 0·426) | 5·365 (5·256, 5·473) |
| 2004–2005 | 0·255 (0·208, 0·303) | 0·444 (0·390, 0·498) | 5·056 (4·949, 5·163) |
| 2005–2006 | 0·240 (0·194, 0·286) | 0·422 (0·369, 0·476) | 4·637 (4·520, 4·754) |
| 2006–2007 | 0·231 (0·185, 0·277) | 0·447 (0·393, 0·501) | 4·319 (4·210, 4·428) |
| 2007–2008 | 0·366 (0·314, 0·418) | 0·491 (0·437, 0·545) | 4·667 (4·552, 4·783) |
| 2008–2009 | 0·274 (0·225, 0·322) | 0·523 (0·469, 0·577) | 7·649 (7·428, 7·870) |
| 2009–2010 | 0·179 (0·138, 0·221) | 0·322 (0·272, 0·373) | 9·143 (8·907, 9·379) |
*Estimates are based on observations that are included in the multivariate regression analysis. Does not include observations for the 2010–2011 flu season because of incomplete data.
Table 3 presents odds ratios from the pooled time‐series cross‐section logistic regression analysis predicting influenza activity for state‐months spanning the study period. All models include fixed effects for state, month, and influenza season. The first two models predict whether influenza activity was widespread. From the second column (which removes non‐significant state‐month predictors), the odds of widespread influenza activity in a given state‐month are greater when influenza was widespread in the previous month (OR = 2·66, 95% CI 1·98, 3·59). The odds of widespread influenza are also greater for a given state when adjacent states had elevated influenza activity levels in the previous month (OR = 4·40, 95% CI 3·49, 5·55), suggesting a significant degree of between‐state influenza spread and/or larger regional influences that affect adjacent states’ influenza levels in similar ways. Neither of the climate measures is significantly associated with influenza activity. However, closer inspection reveals that both temperature and precipitation are significantly negatively associated with widespread influenza activity if the fixed effects for month are removed (OR = 0·93, 95% CI 0·92, 0·94; OR = 0·80, 95% CI 0·68, 0·94; respectively).
Table 3.
Odds ratios from pooled time‐series cross‐section logistic regression analyses predicting high monthly influenza activity levels in American States during the regular flu season, November1999–December 2010 (N = 3712 state‐month observations)*
| Predictor | Widespread influenza | Regional/widespread Influenza | ||
|---|---|---|---|---|
| Odds ratio (95% CI) | Odds ratio (95% CI) | Odds ratio (95% CI) | Odds ratio (95% CI) | |
| Influenza level last month | ||||
| Widespread | 2·620 (1·942, 3·533) | 2·663 (1·978, 3·585) | – | – |
| Regional/widespread | – | – | 3·269 (2·472, 4·322) | 3·268 (2·473, 4·320) |
| Time‐varying state‐month predictors | ||||
| Average influenza level in adjacent states last month | 4·390 (3·473, 5·549) | 4·398 (3·487, 5·547) | 4·411 (3·621, 5·374) | 4·404 (3·620, 5·358) |
| State unemployment rate | 1·199 (1·054, 1·364) | 1·211 (1·071, 1·370) | 1·315 (1·176, 1·471) | 1·302 (1·171, 1·447) |
| State average monthly temp. (°F) | 0·987 (0·960, 1·014) | – | 1·003 (0·980, 1·028) | – |
| State average monthly precipitation (inches, logged) | 0·859 (0·726, 1·017) | – | 0·872 (0·755, 1·007) | – |
| Size of labor force (normed) | 1·149 (0·924, 1·429) | – | 1·105 (0·927, 1·318) | – |
| % metro (normed) | 0·951 (0·842, 1·073) | – | 1·005 (0·907, 1·114) | – |
| Average household size (normed) | 0·968 (0·835, 1·121) | – | 1·006 (0·885, 1·143) | – |
| Average age (normed) | 0·905 (0·755, 1·083) | – | 1·042 (0·889, 1·221) | – |
| % married (normed) | 0·914 (0·802, 1·041) | – | 0·888 (0·793, 0·993) | 0·895 (0·803, 0·998) |
| % college educated (normed) | 0·989 (0·860, 1·137) | – | 1·058 (0·936, 1·195) | – |
| % impoverished (normed) | 0·913 (0·787, 1·060) | – | 0·978 (0·861, 1·111) | – |
| Month fixed effects (ref. = February) | ||||
| January | 1·366 (0·956, 1·951) | 1·341 (0·946, 1·901) | 3·252 (2·279, 4·641) | 3·231 (2·271, 4·597) |
| March | 0·292 (0·205, 0·416) | 0·289 (0·204, 0·409) | 0·298 (0·210, 0·424) | 0·305 (0·216, 0·431) |
| April | 0·023 (0·013, 0·041) | 0·021 (0·013, 0·034) | 0·031 (0·020, 0·050) | 0·032 (0·022, 0·047) |
| May | 0·043 (0·017, 0·109) | 0·033 (0·016, 0·070) | 0·035 (0·017, 0·070) | 0·037 (0·022, 0·061) |
| November | 1·334 (0·618, 2·877) | 1·018 (0·627, 1·653) | 0·758 (0·395, 1·458) | 0·808 (0·537, 1·215) |
| December | 1·456 (0·844, 2·513) | 1·320 (0·877, 1·987) | 1·465 (0·919, 2·336) | 1·555 (1·082, 2·234) |
| Season fixed effects (ref. = 1999–2000) | ||||
| 2000–2001 | 0·703 (0·380, 1·301) | 0·773 (0·429, 1·396) | 1·203 (0·731, 1·978) | 1·222 (0·766, 1·949) |
| 2001–2002 | 1·129 (0·620, 2·057) | 1·192 (0·671, 2·118) | 1·255 (0·768, 2·052) | 1·369 (0·857, 2·185) |
| 2002–2003 | 1·013 (0·530, 1·934) | 1·161 (0·640, 2·107) | 1·245 (0·733, 2·115) | 1·357 (0·835, 1·156) |
| 2003–2004 | 0·802 (0·425, 1·513) | 0·874 (0·496, 1·538) | 0·585 (0·319, 1·072) | 0·667 (0·385, 1·156) |
| 2004–2005 | 2·211 (1·206, 4·056) | 2·366 (1·416, 3·952) | 1·038 (0·604, 1·784) | 1·197 (0·751, 1·907) |
| 2005–2006 | 2·723 (1·399, 5·299) | 3·172 (1·908, 5·276) | 1·176 (0·659, 2·100) | 1·493 (0·942, 2·364) |
| 2006–2007 | 2·183 (1·026, 4·644) | 2·606 (1·577, 4·306) | 1·265 (0·661, 2·422) | 1·660 (1·045, 2·636) |
| 2007–2008 | 3·926 (1·755, 8·781) | 4·806 (2·923, 7·903) | 1·099 (0·544, 2·218) | 1·552 (0·968, 2·489) |
| 2008–2009 | 2·264 (0·870, 5·892) | 2·701 (1·416, 5·152) | 0·899 (0·397, 2·034) | 1·334 (0·758, 2·349) |
| 2009–2010 | 0·129 (0·041, 0·404) | 0·132 (0·054, 0·319) | 0·036 (0·013, 0·096) | 0·051 (0·024, 0·110) |
| 2010–2011 | 0·746 (0·200, 2·785) | 0·691 (0·242, 1·970) | 0·284 (0·097, 0·834) | 0·419 (0·182, 0·961) |
| Likelihood ratio χ2 (d.f.) | 1373·69 (75) | 1362·74 (66) | 2050·05 (75) | 2043·99 (67) |
CI, Confidence interval; d.f., degress of freedom.
*All models include fixed effects for state, month, and flu season.
Net of these factors, the odds that influenza is widespread in a given state were higher under conditions of high unemployment (OR = 1·21, 95% CI 1·07, 1·37). The magnitude of the association is shown in Figure 2, which plots predicted probabilities of widespread flu under different labor market conditions. The predicted probability of widespread influenza activity when unadjusted unemployment is at 3·6% (which was the overall average unemployment rate in 1999) is 0·05, compared with a predicted probability of 0·13 when unemployment is at 8·8% (the overall average unemployment rate in 2010). A supplementary analysis shows similar results when using seasonally adjusted unemployment rates instead of the original unadjusted rates (OR = 1·18, 95% CI 1·03, 1·34).
Figure 2.
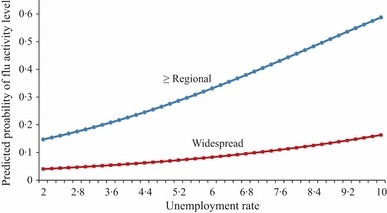
Predicted probabilities of regional and/or widespread influenza activity levels during the regular flu season, given different levels of unemployment. aPredicted probabilities are calculated from log(odds) for the models presented in columns 2 and 4 on Table 3. Predictors are held at their means.
It is worth noting that the effect of unemployment is slightly more pronounced at the ‘regional or widespread’ threshold of influenza activity, as shown in columns 3 and 4 of Table 3. From the final model, a one‐percentage‐point increment in the unemployment rate is associated with a 30·2% increment in the odds of regional or widespread influenza (95% CI 1·17, 1·45). As shown in Figure 2, the predicted probability that a state has at least regional influenza activity when the unadjusted unemployment rate is at 3·6% is 0·21, compared with a predicted probability of 0·51 when unemployment is at 8·8%. Results are similar when using seasonally adjusted unemployment rates (OR = 1·28, 95% CI 1·15, 1·43).
Conclusion
This paper examined the relationship between the state‐level unemployment rate and influenza activity within the 48 contiguous United States during the 1999–2010 flu seasons. The primary finding is that high state‐level unemployment increases the risk of both regional and widespread influenza activity during the subsequent month. These results persist despite the inclusion of a number of time‐varying state‐level characteristics, including proximity to influenza activity in adjacent states, temperature, and precipitation.
It is worth noting that neither temperature nor precipitation is significantly associated with the likelihood of widespread influenza activity within states. These measures are significant when month fixed effects are removed, however, suggesting that the month indicators are jointly correlated with climate. It is unclear to what extent this correlation reflects social factors such as the prevalence of indoor group activities related to holiday celebrations, or unobserved heterogeneity with respect to climate itself, like humidity.
Finally, it is beyond the scope of this paper to specify the mechanisms that account for the link between unemployment and influenza activity. Previous work suggests that this association partly reflects the consequences of unemployment for access to health care, as well as stress and suppression of immune function in both employed and unemployed individuals. 10 , 18 Models of state‐level influenza like the ones presented here cannot capture factors that increase individual‐level risk of contracting influenza. Additional work is needed to determine the role of the macroeconomic climate as an independent predictor alongside individual‐level factors in multilevel models of influenza risk. Knowledge of the particular vulnerability of disadvantaged populations has in the past motivated tailored interventions to increase access to influenza vaccinations in inner‐city areas. 38 , 39 Tests of interventions that target areas with high local unemployment rates or where mass layoff have occurred may provide useful tests of the general hypothesis that unemployment facilitates influenza spread.
References
- 1. Molinari NA, Ortega‐Sanchez IR, Messonnier ML et al. The annual impact of seasonal influenza in the US: measuring disease burden and costs. Vaccine 2007; 25:5086–5096. [DOI] [PubMed] [Google Scholar]
- 2. Brankston G, Gitterman L, Hirji Z et al. Transmission of influenza A in human beings. Lancet Infect Dis 2007; 7:257–265. [DOI] [PubMed] [Google Scholar]
- 3. Bean B, Moore BM, Sterner B et al. Survival of influenza viruses on environmental surfaces. J Infect Dis 1982; 146:47–51. [DOI] [PubMed] [Google Scholar]
- 4. Brownstein JS, Wolfe CJ, Mandl KD. Empirical evidence for the effect of airline travel on inter‐regional influenza spread in the United States. PLoS Med. 2006; 3:e401, doi: 10.1371/journal.pmed.0030401. [DOI] [PMC free article] [PubMed] [Google Scholar]
- 5. Lofgren E, Fefferman N, Naumov YN et al. Influenza seasonality: underlying causes and modeling theories. J Virol 2007; 81: 5429–5436. [DOI] [PMC free article] [PubMed] [Google Scholar]
- 6. Lowen AC, Mubareka S, Steel J et al. Influenza virus transmission is dependent on relative humidity and temperature. PLoS Pathog 2007; 3:e151. [DOI] [PMC free article] [PubMed] [Google Scholar]
- 7. Brenner MH. Mortality and the national economy: a review, and the experience of England and Wales 1936–1976. Lancet 1979; 2:568–573. [PubMed] [Google Scholar]
- 8. Jin RL, Shah CP, Svoboda TV. The impact of unemployment on health: a review of the evidence. Can Med Assoc J 1995; 153: 529–540. [PMC free article] [PubMed] [Google Scholar]
- 9. Laporte A. Do economic cycles have a permanent effect on population health? Revisiting the Brenner hypothesis. Health Econ 2004; 13:767–779. [DOI] [PubMed] [Google Scholar]
- 10. Link BG, Phelan J. Social conditions as fundamental causes of disease. J Health Soc Behav 1995; 35:80–94. [PubMed] [Google Scholar]
- 11. Chen JY, Fox SA, Cantrell CH et al. Health disparities and prevention: racial/ethnic barriers to flu vaccinations. J Community Health 2007; 32:5–20. [DOI] [PubMed] [Google Scholar]
- 12. Kamal KM, Madhavan SS, Amonkar MM. Determinants of adult influenza and pneumonia immunization rates. J Am Pharm Assoc 2003; 43:403–411. [DOI] [PubMed] [Google Scholar]
- 13. Olsen GW, Burris JM, Burlew MM et al. Absenteeism among employees who participated in a workplace influenza immunization program. J Occup Environ Med 1998; 40:311–316. [DOI] [PubMed] [Google Scholar]
- 14. Artazcoz L, Benach J, Borrell C et al. Unemployment and mental health: understanding the interactions among gender, family roles, and social class. Am J Public Health 2004; 94:82–88. [DOI] [PMC free article] [PubMed] [Google Scholar]
- 15. Brand JE, Burgard SA. Effects of job displacement on social participation: findings over the life course of a cohort of joiners. Soc Forces 2008; 87:211–242. [DOI] [PMC free article] [PubMed] [Google Scholar]
- 16. Burgard SA, Brand JE, House JS. Toward a better estimation of the effect of job loss on health. J Health Soc Behav 2007; 48:369–384. [DOI] [PubMed] [Google Scholar]
- 17. Cacioppo JT, Ernst JM, Burleson MH et al. Lonely traits and concomitant physiological processes: the MacArthur social neuroscience studies. Int J Psychophysiol 2000; 35:143–154. [DOI] [PubMed] [Google Scholar]
- 18. Kessler RC, Turner JB, House JS. Intervening processes in the relationship between unemployment and health. Psychol Med 1987; 17:949–961. [DOI] [PubMed] [Google Scholar]
- 19. Linn MW, Sandifer R, Stein S. Effects of unemployment on mental and physical health. Am J Public Health 1985; 75(5):502–506. [DOI] [PMC free article] [PubMed] [Google Scholar]
- 20. Wadsworth MEJ, Montgomery SM, Bartley MJ. The persisting effect of unemployment on health and social well‐being in men early in working life. Soc Sci Med 1999; 48:1491–1499. [DOI] [PubMed] [Google Scholar]
- 21. Burgard SA, Brand JE, House JS. Perceived job insecurity and worker health in the United States. Soc Sci Med 2009; 69(5):777–785. [DOI] [PMC free article] [PubMed] [Google Scholar]
- 22. Ferrie JE, Shipley MJ, Marmot MG et al. An uncertain future: the health effects of threats to employment security in white‐collar men and women. Am J Public Health 1998; 88:1030–1036. [DOI] [PMC free article] [PubMed] [Google Scholar]
- 23. Ferrie JE, Shipley MJ, Stansfeld SA et al. Effects of chronic job insecurity and change in job security on self reported health, minor psychiatric morbidity, physiological measures, and health related behaviours in British civil servants: the Whitehall II Study. J Epidemiol Community Health 2002; 56:450–454. [DOI] [PMC free article] [PubMed] [Google Scholar]
- 24. Dragano N, Verde PE, Siegrist J. Organisational downsizing and work stress: testing synergistic health effects in employed men and women. J Epidemiol Community Health 2005; 59:694–699. [DOI] [PMC free article] [PubMed] [Google Scholar]
- 25. Grunberg L, Moore S, Greenberg E. Differences in psychological and physical health among layoff survivors: the effect of layoff contact. J Occup Health Psychol 2001; 6:15–25. [DOI] [PubMed] [Google Scholar]
- 26. Kivimaki M, Vahtera J, Pentti J et al. Factors underlying the effect of organisational downsizing on health of employees: a longitudinal cohort study. Br Med J 2000; 320:971–975. [DOI] [PMC free article] [PubMed] [Google Scholar]
- 27. Vahtera J, Kivimaki M, Pentti J. Effect of organisational downsizing on health of employees. Lancet 1997; 350:1124–1128. [DOI] [PubMed] [Google Scholar]
- 28. Vahtera J, Kivimäki M, Pentti J et al. Organisational downsizing, sickness absence, and mortality: 10‐town prospective cohort study. Br Med J 2004; 328:555. [DOI] [PMC free article] [PubMed] [Google Scholar]
- 29. Kyriacou DN, Anglin D, Taliaferro E et al. Risk factors for injury to women from domestic violence against women. N Engl J Med 1999; 341:1892–1898. [DOI] [PubMed] [Google Scholar]
- 30. Sleskova M, Salonna F, Geckova A et al. Does parental unemployment affect adolescents’ health? J Adolesc Health 2006; 38: 527–535. [DOI] [PubMed] [Google Scholar]
- 31. Centers for Disease Control and Prevention . Overview of influenza surveillance in the United States. Available at: http://www.cdc.gov/flu/weekly/fluactivity.htm. Accessed 24 April 2010.
- 32. Brady H, Sprague MH, Gey FC. Seasonal employment dynamics and welfare use in agricultural and rural California counties; in Weber BA, Duncan GJ, Whitener LA. (eds): Rural Dimensions of Welfare Reform. Kalamazoo, MI: W.E. Upjohn Institute for Employment Research, 2002; 147–170. [Google Scholar]
- 33. Hansen E, Donohoe M. Health issues of migrant and seasonal farmworkers. J Health Care Poor Underserved 2003; 14:153–164. [DOI] [PubMed] [Google Scholar]
- 34. Gensheimer KF, Fukuda K, Brammer L et al. Preparing for pandemic influenza: the need for enhanced surveillance. Vaccine 2002; 20:S63–S65. [DOI] [PubMed] [Google Scholar]
- 35. Cliff A, Haggett P, Ord J. Spatial Aspects of Influenza Epidemics. London: Page Bros., 1986. [Google Scholar]
- 36. Viboud C, Bjornstad ON, Smith DL, Simonsen L, Miller MA, Grenfell BT. Synchrony, waves, and spatial hierarchies in the spread of influenza. Science 2006; 312:447–451. [DOI] [PubMed] [Google Scholar]
- 37. Schanzer DL, Langley JM, Dummer T et al. A composite epidemic curve for seasonal influenza in Canada with an international comparison. Influenza Other Respi Viruses 2010; 4:295–306. [DOI] [PMC free article] [PubMed] [Google Scholar]
- 38. Vlahov D, Coady MH, Ompad DC et al. Strategies for improving influenza immunization rates among hard‐to‐reach populations. J Urban Health 2007; 84:615–631. [DOI] [PMC free article] [PubMed] [Google Scholar]
- 39. Zimmerman RK, Nowalk MP, Raymund M et al. Tailored interventions to increase influenza vaccination in neighborhood health centers serving the disadvantaged. Am J Public Health 2003; 93:1699–1705. [DOI] [PMC free article] [PubMed] [Google Scholar]