

Abstract
Please cite this paper as: Borders‐Hemphill and Mosholder (2012) U.S. utilization patterns of influenza antiviral medications during the 2009 H1N1 influenza pandemic. Influenza and Other Respiratory Viruses 6(601), e129–e133.
Background The 2009 H1N1 influenza pandemic in the United States occurred from April 2009 to April 2010. The 2009 H1N1 influenza virus was susceptible to neuraminidase inhibitors (oseltamivir and zanamivir).
Objectives To characterize the 2009 H1N1 influenza pandemic in the United States from April 2009 to April 2010 using weekly influenza antiviral prescription utilization data and the CDC’s weekly reports of the number of visits for influenza‐like‐illnesses by the Influenza Sentinel Provider Surveillance Network.
Methods A proprietary outpatient data source used by the FDA, which captures adjudicated U.S. prescription claims for select influenza antiviral drugs, was used to conduct this analysis. Data were extracted weekly and analyzed for surveillance during the pandemic. Results were compiled at the end of the pandemic.
Results Oseltamivir has dominated the U.S. influenza antiviral market share of dispensed prescriptions since approval in October 1999 and was the primary influenza antiviral drug used during the 2009 H1N1 influenza pandemic. However, commercial availability of the suspension formulation of oseltamivir was reduced by high demand during the pandemic. Dispensed prescription trends of other influenza antiviral medications studied followed that those of oseltamivir, even antivirals for which the 2009 H1N1 strains showed resistance.
Conclusion Weekly prescription utilization of all influenza antivirals used to treat influenza during the seasonal influenza outbreak followed the same trend of weekly reports of the number of visits for influenza‐like‐illnesses (ILI) by the Influenza Sentinel Provider Surveillance Network. The ILI epidemic curve resembled dispensed antiviral prescription trends (both overall and stratified by age), providing some corroboration for the surveillance data.
Keywords: Antiviral, H1N1, influenza, surveillance
Background
Human cases of 2009 H1N1 influenza were first identified during spring 2009. The Centers for Disease Control reported the first defined U.S. case in the state of California in April 2009 subsequent to an outbreak in La Gloria, Mexico. Acting U.S. Department of Health and Human Services Secretary Charles E. Johnson declared the 2009 H1N1 influenza outbreak a nationwide public health emergency on April 26, 2009. 1 The U.S. Department of Health and Human Services (DHHS) coordinated efforts with the CDC, National Institutes of Health (NIH), and the Food and Drug Administration (FDA) to establish multiple surveillance systems to track the progress of the new subtype of the influenza A virus (2009 H1N1 influenza) infection. FDA’s Center for Drug Evaluation and Research, Office of Surveillance and Epidemiology (OSE), was designated to monitor reported adverse events associated with the use of antiviral medications for the treatment and prophylaxis of influenza, and to track the national utilization patterns of these medications.
CDC’s final estimates for the 2009 H1N1 pandemic in the United States indicate that from April 2009 to April 10, 2010, there were approximately 61 million cases of 2009 H1N1 influenza (i.e., approximately one‐sixth of the population), with roughly 20 million cases in children and adolescents, 35 million in adults 18–64 years old, and 6 million among individuals 65 years and older. 2 Thus, nearly one‐third of the cases were in the pediatric age group, while approximately 10% of the total cases were in the elderly. Overall, the 2009 H1N1 pandemic was estimated to have caused roughly 12 470 deaths, with 10% of these deaths in children and adolescents.
The 2009 H1N1 influenza virus predominated during the pandemic, accounting for >99% of laboratory‐typed influenza through November of that year in the United States. During the 2009–2010 influenza season, the 2009 H1N1 influenza virus was susceptible to the antiviral class neuraminidase inhibitors (oseltamivir and zanamivir) but resistant to the antiviral class adamantanes (amantadine and rimantadine). 3 OSE’s Division of Epidemiology monitored data on dispensed prescriptions for all four antiviral drugs, with a focus on those recommended for use against 2009 H1N1 influenza, oseltamivir (by strength and form prescribed) and zanamivir (prescribed as an inhaler only), stratified by patient age. This report summarizes outpatient antiviral prescribing in the United States from the week ending March 13, 2009 through week ending April 23, 2010.
Methods
Proprietary drug use databases were used by FDA to conduct this analysis. As prior data had indicated that the majority of the market share for influenza antiviral sales was for oseltamivir and the majority of oseltamivir bottles (>90%) were sold to outpatient retail channels of distribution during the 2008–2009 influenza season, we focused the analysis on outpatient prescription utilization of oseltamivir, zanamivir, rimantadine, and amantadine. 4 Outlets within the retail market include the following pharmacy settings: chain drug stores, independent drug stores, mass merchandisers, and food stores. Outlets within the non‐retail market include clinics, non‐federal hospitals, federal facilitiesm HMOs, long‐term care facilities, home health care, and other miscellaneous settings.
We found that antiviral sales from manufacturer/distributor to retail and non‐retail settings, and dispensed outpatient retail prescription utilization sources, provided a 4–10 week shorter lag time for data compared to inpatient hospital discharge records of antiviral use. Thus, we did not use inpatient hospital sources. Dispensed outpatient retail prescription utilization sources can provide no data on whether patients are taking medications as prescribed, but were considered the best mechanism for antiviral utilization analysis.
Outpatient use and patient demographics were measured from the Wolters Kluwer Viral Tracker, Wolters Kluwer Health, and Wolters Kluwer Pharma Solutions, United States. The Wolters Kluwer Viral Tracker database is a data source that captures adjudicated prescription claims across the United States from commercial plans, Medicare Part D plans, Cash and Medicaid claims for select influenza anti‐viral drugs. It captures approximately 80% of the U.S. drug market, and prescription data are projected to yield national estimates. From this data source, weekly national estimates of the number of prescriptions dispensed for oseltamivir, zanamivir, rimantadine, and amantadine were obtained for the week ending March 13, 2009 through week ending April 23, 2010. Stratified patient age data were obtained for these antivirals for the same time period. Data collection is based on a reporting week that starts on Saturday and ends on Friday of each week with a 10‐day lag time. Data are updated in the database by Tuesday afternoon of the following week. Those data were then downloaded, compiled, and analyzed. Around 35–40% of influenza antiviral prescriptions claims captured by the Wolters Kluwer Viral tracker did not include ages. Known ages were used to trend age stratifications for influenza antivirals and were assumed to be reflective of actual patient trends.
The IMS Health, Inc., (Danbury, CT, USA), IMS, Vector One®: National (VONA) captures retail pharmacy prescriptions from retail chains, mass merchandisers, mail order pharmacies, pharmacy benefit managers, and provider groups. Vector One® obtains data on over 2 billion prescriptions annually, from a sample of approximately 59 000 U.S. pharmacies, representing close to half of U.S. retail prescriptions, allowing nationally projected estimates of prescriptions dispensed. We used Vector One® data for historical comparisons with previous influenza seasons.
As a part of the CDC’s influenza epidemiology and surveillance activity for the 2009 H1N1 influenza pandemic, sentinel providers were recruited for the Influenza Sentinel Provider Surveillance Network and provided reports of the number of visits for influenza‐like‐illnesses (ILI). 5 These surveillance data are made available online. We overlayed the nationally projected outpatient dispensed prescription data using the WK Viral tracker with national estimates of the percentage of all outpatient visits that were for ILI. This provided insight into patterns of antiviral prescribing relative to the progress of the influenza pandemic within the Unites States.
Results
With the exception of three seasons over the past 19 years (seasons 1991–1992, 1995–1996, and 2003–2004), antiviral use during the seasonal influenza outbreak usually begin to increase during the 4th quarter and peaks during the 1st quarter of each year (Figure 1). During the 2008–2009 season (started in the 4th quarter 2008 through and ended in the 2nd quarter 2009), the seasonal peak occurred during the 1st quarter of 2009 as expected. However, antiviral prescriptions continued to be dispensed during the 2nd and 3rd quarters of 2009 at quantities greater than previously observed. The proportion of antiviral prescriptions dispensed during the 2nd and 3rd quarters of the previous 18 seasons ranged from 5% to 42% of 1st quarter dispensed prescriptions; however, the proportion of antiviral prescriptions dispensed during the 2nd and 3rd quarters of 2009 was 81% and 142% of the 1st quarter prescription count.
Figure 1.
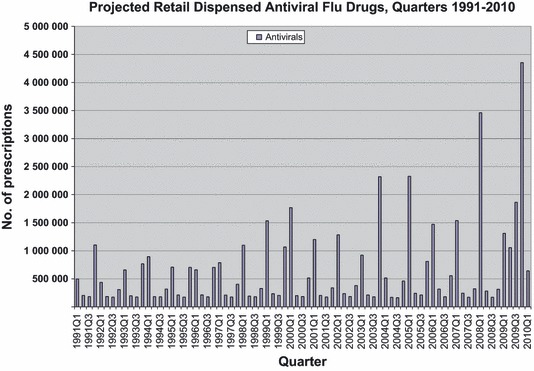
Projected retail dispensed antiviral flu drugs, quarters 1991–2010.
Examining weekly prescription data provides further insight into the unusually high antiviral use noted in the second and third quarters of 2009. After declining from the 2008 to 2009 seasonal peak to a low of 8208 prescriptions during the week ending April 24, 2009, oseltamivir‐dispensed prescriptions increased to an estimated 249 106 prescriptions (a 30‐fold increase) during the week ending in May 1, 2009. Zanamivir experienced a ninefold increase during this same time period (from 1631 prescriptions to an estimated 14 812 prescriptions). By week ending May 15, 2009, the use of antiviral agents decreased from this peak.
Following this initial spike from the H1N1 outbreak, dispensed antiviral prescriptions for the 2009–2010 seasonal influenza season began to increase earlier than expected around the 2nd week of August. The number of oseltamivir‐dispensed prescriptions increased to an estimated 582 387 prescriptions during the week ending in October 23, 2009, then dropped sharply to pre‐seasonal flu levels by the week ending December 4, 2009. Prescription use continued to decline thereafter and leveled‐off during the first quarter of 2010 to negligible levels by April 2010. On a much smaller scale, the number of zanamivir‐dispensed prescriptions peaked to around 10 855 prescriptions during the week ending in October 23, 2009, and followed a similar pattern of decline.
During the study period, oseltamivir accounted for around 87% of the total influenza antiviral market studied. The capsule was the more commonly dispensed formulation (representing 86% of all oseltamivir prescriptions) compared to the suspension formulation. Around 97% of the capsules dispensed were of the 75‐mg strength, with comparatively few prescriptions for the other available 30‐ and 45‐mg strengths. Based on the total of known ages, the 30‐ and 45‐mg oseltamivir capsules (95%) and the suspension (99%) are primarily dispensed to pediatric patients.
During the study period, zanamivir accounted for around 3% of the total influenza antiviral market studied. Based on the total of known ages, on average, for every zanamivir prescription dispensed to pediatric patients aged 0–16 years, approximately two prescriptions were dispensed to adults. Around 96% of prescriptions dispensed to patients aged 0–16 years were to those above the age of 6 years.
Rimantadine accounted for <1% of the total influenza antiviral market during the study period. Based on the total of known ages, on average, for every rimantadine prescription dispensed to a pediatric patients aged 0–16 years, approximately four prescriptions were dispensed to adults. Although the majority of the 2009 H1N1 strains were resistant to rimantadine, the trend in dispensed prescriptions followed that of oseltamivir.
From the week ending March 13, 2009, through week ending April 23, 2010, amantadine accounted for around 10% of the total influenza antiviral market studied. Based on the total of known ages, on average, for every amantadine prescription dispensed to pediatric patients aged 0–16 years, approximately eight prescriptions were dispensed to adults. Although the trend in the amount of dispensed amantadine prescriptions remained fairly steady during the 2009–2010 season, the trended increases in dispensed prescriptions followed that of oseltamivir.
Weekly dispensing of influenza antivirals followed the same trend of weekly reports of the percentage of visits for ILI by the Influenza Sentinel Provider Surveillance Network (Figure 2). Weekly dispensing of oseltamivir specifically to patients aged 65 years or greater followed a similar trend.
Figure 2.
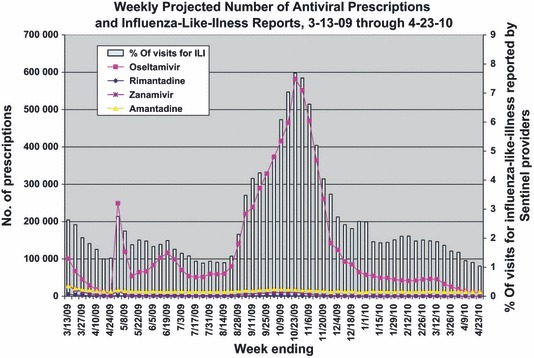
Projected number of antiviral prescriptions and influenza‐like‐illness reports, weekly March 2009‐April 2010.
Influenza antiviral utilization has historically followed the typical pattern of seasonal influenza infection. The influenza season begins annually in October and ends in June of the following year, peaking around February. During the 2008–2009 season (4th quarter 2008–2nd quarter 2009), the 2009 H1N1 influenza pandemic altered this trend. The seasonal peak occurred during the 1st quarter of 2009 but dispensed antiviral prescriptions continued through to the 2nd and 3rd quarters of 2009. The trend was subsequently altered for the 2009–2010 season, as the seasonal peak was shifted to the left, occurring earlier in the season during the 4th quarter of 2009 with decreased utilization during the 1st quarter of 2010.
After declining from the 2008–2009 seasonal peak by week ending April 24, 2009, oseltamivir weekly dispensed prescriptions increased by 30‐fold during the week ending in May 1, 2009 (from 8208 prescriptions to 249 106 prescriptions), and zanamivir weekly dispensed prescriptions increased by ninefold increase from 1631 prescriptions to 14 812 prescriptions. Utilization would have been expected to be low during this time (2nd quarter) based on previous seasons. This increase in weekly dispensed prescriptions nationwide coincides with the declaration of a nationwide H1N1 public health emergency by the DHHS Secretary.
During the 2009–2010 season, there were relatively fewer infections and cases of serious illness and death with the 2009 H1N1 virus in people older than 65, representing around 3% of weekly reports of the number of visits for ILI by the Influenza Sentinel Provider Surveillance Network from the week ending May 1, 2009, through week ending April 23, 2010. 6
The consistent community presence of the H1N1 virus heavily impacted the availability of oseltamivir during the early 2009–2010 seasonal peak. On September 4, 2009, Roche Laboratories (oseltamivir manufacturer) released a notice to providers that because of strong demand, supplies of the oral suspension as well as the 30‐ and 45‐mg capsule formulations were limited in supply and expected shortages. 7 Roche did not expect to have additional suspension supplies until November/December 2009 and suspension shipment resumed in the first week of December 2009. 8 Consequently, dispensed oseltamivir suspension prescriptions for all age groups began to decline during the week ending September 25, 2009, and continued until the week ending December 4, 2009, representing a 91% decrease (from 53 962 to 4654 prescriptions). During this time, pharmacists were instructed by the manufacturer and DHHS to compound suspension from oseltamivir capsules as provided in oseltamivir product labeling Dosage and Administration section.
Discussion and conclusions
To our knowledge, this is the first comparison of weekly antiviral prescription utilization data and traditional influenza surveillance data during an influenza epidemic in the United States. A previous analysis of influenza antiviral prescription data from CDC BioSense during years 2006–2009 showed a pattern resembling our data, although at monthly rather than weekly increments. This analysis found good correlation with surveillance data on emergency department visits for antiviral‐related adverse events. 9 In Japan, an analysis of data from prior to the H1N1 pandemic showed that the weekly volume of prescriptions for neuraminidase inhibitors dispensed in community pharmacies correlated with influenza activity reported by Japan’s National Epidemiological Surveillance of Infectious Diseases. 10
Hernandez et al. 11 described pandemic use of oseltamivir during 4th quarter 2009 in the five most populous countries of Europe. Oseltamivir retail prescriptions ranged from 41 per 100 000 (Spain) to 405 per 100 000 (Germany). In Figure 1, U.S. prescriptions for all anti‐influenza drugs peaked in the 4th quarter of 2009, at roughly 4·3 million, the large majority for oseltamivir. On a per‐capita basis, with a U.S. population of 307 million at the time, 12 this represented approximately 1400 antiviral prescriptions per 100 000 population.
Oseltamivir has dominated the influenza antiviral market share of dispensed prescriptions since approval in October 1999. Historically, use of oseltamivir in the United States markedly increased, and use of adamantanes declined, following CDC guidelines in 2006 cautioning about viral resistance to adamantanes. 13 We found that oseltamivir was the primary influenza antiviral drug used during the 2009 H1N1 influenza pandemic in the United States. The pandemic resulted in prolongation of the 2008–2009 season and the early peak of the 2009–2010 season and negatively impacted the manufacturing of the most commonly dispensed formulation to pediatric patients, oseltamivir suspension. This resulted in the decreased availability of the suspension (although pharmacists could compound a suspension from oseltamivir 75‐mg capsules). Overall amount of dispensed prescriptions for oseltamivir were unabated during time period studied. For every zanamivir prescription dispensed, 30 were dispensed for oseltamivir over the entire study period. For every rimantadine prescription dispensed, 168 were dispensed for oseltamivir during the entire study period. For every amantadine prescription dispensed, nine were dispensed for oseltamivir during the entire study period. Weekly dispensing of the four influenza antivirals followed the same trend of weekly reports of the number of visits for ILI by the Influenza Sentinel Provider Surveillance Network. The fact that the shape of the ILI epidemic curve mirrored the trends in prescriptions dispensed lends credence to the ILI surveillance data.
Limitations of this analysis include the restriction to data on dispensed retail prescriptions; for the reasons already discussed, we focused the analysis on that sector of the market. Another limitation is that age was missing from a large proportion of the prescriptions, which could lower the numbers of prescriptions observed among a particular age group, if that age group had disproportionately greater numbers of prescriptions with missing ages. Also, data on indications were not available. Amantadine has an additional indication of Parkinson’s disease, which could account for prescriptions dispensed outside of the typical influenza season, and we do not know the proportion of the amantadine prescriptions that were for influenza specifically during the influenza season. Also, we cannot account for prescriptions that represented stockpiling, that is, patients filling prescriptions so that they would have drug on hand if they developed influenza symptoms or were exposed. However, by inspection of the trends in prescriptions, it would appear that most of the prescriptions were for acute use and were not dispensed very far in advance, that is, there was little suggestion of advance stockpiling of antiviral prescriptions well ahead of the epidemic curve.
In summary, monitoring dispensed prescriptions for anti‐influenza drugs during the influenza pandemic proved to be a useful adjunct to other influenza surveillance data and provided insights into the potential for shortages in the supply of antiviral drugs as the epidemic developed.
The views expressed in this manuscript represent the opinions of the authors and do not necessarily represent the views of the U.S. Food and Drug Administration.
References
- 1. U.S. Department of Health & Human Services . Available at http://www.hhs.gov/secretary/phe_swh1n1.html (Accessed 20 April 2010).
- 2. Centers for Disease Control and Prevention . Available at http://www.cdc.gov/h1n1flu/estimates_2009_h1n1.htm (Accessed 26 October 2010).
- 3. Centers for Disease Control and Prevention . Available at http://www.cdc.gov/H1N1flu/recommendations.htm (Accessed 19 April 2010).
- 4. IMS Health . IMS National Sales Perspectives™, 2009, Extracted 4‐2010. File: 1004anti.dvr
- 5. Centers for Disease Control and Prevention . Available at http://www.cdc.gov/ncidod/osr/site/sentinel/surv‐sys.htm (Accessed 26 October 2010).
- 6. Centers for Disease Control and Prevention . Available at http://www.cdc.gov/h1n1flu/65andolder.htm (Accessed 18 May 2010).
- 7. Roche Laboratories . Tamiflu supply letter. Available at http://www.gene.com/gene/products/information/tamiflu/pdf/TAMIFLU_Supply_letter_09_04_2009.pdf (Accessed 12 May 2010).
- 8. FDA . Postmarket drug safety information for patients and providers. Available at http://www.fda.gov/Drugs/DrugSafety/PostmarketDrugSafetyInformationforPatientsandProviders/ucm188236.htm (Accessed 14 May 2010).
- 9. Lovegrove MC, Shehab N, Hales CM, Poneleit K, Crane E, Budnitz DS. Emergency department visits for antiviral adverse events during the 2009 H1N1 influenza pandemic. Public Health Rep 2011; 126:312–317. [DOI] [PMC free article] [PubMed] [Google Scholar]
- 10. Urushihara H, Doi Y, Arai M et al. Oseltamivir prescription and regulatory actions vis‐à‐vis abnormal behavior risk in Japan: drug utilization study using a nationwide pharmacy database. PLoS One 2011; 6:e28483. [DOI] [PMC free article] [PubMed] [Google Scholar]
- 11. Hernández JM, López‐Rodas V, Costas E. Antiviral agents: to treat or not to treat? An old dilemma revisited in light of new data from the 2009 influenza A(H1N1) pandemic. J Clin Virol 2010; 49:145–146. [DOI] [PubMed] [Google Scholar]
- 12. U.S. Census Bureau, Population Division . Table 1. Annual estimates of the resident population for the United States, regions, states, and Puerto Rico: April 1, 2000 to July 1, 2009 (NST‐EST2009‐01). Release Date: December 2009. Available at http://www.census.gov/popest/data/historical/2000s/vintage_2009/index.html (Accessed 17 April 2012).
- 13. Hsieh YH, Chen KF, Gaydos CA, Rothman RE, Kelen GD. Antiviral prescriptions to U.S. ambulatory care visits with a diagnosis of influenza before and after high level of adamantane resistance 2005–06 season. PLoS ONE 2010; 5:e8945. [DOI] [PMC free article] [PubMed] [Google Scholar]