

Abstract
Structure‐based drug design utilizes apoprotein or complex structures retrieved from the PDB. >57% of crystallographic PDB entries were obtained with polyethylene glycols (PEGs) as precipitant and/or as cryoprotectant, but <6% of these report presence of individual ethyleneglycol oligomers. We report a case in which ethyleneglycol oligomers' presence in a crystal structure markedly affected the bound ligand's position. Specifically, we compared the positions of methylene blue and decamethonium in acetylcholinesterase complexes obtained using isomorphous crystals precipitated with PEG200 or ammonium sulfate. The ligands' positions within the active‐site gorge in complexes obtained using PEG200 are influenced by presence of ethyleneglycol oligomers in both cases bound to W84 at the gorge's bottom, preventing interaction of the ligand's proximal quaternary group with its indole. Consequently, both ligands are ∼3.0Å further up the gorge than in complexes obtained using crystals precipitated with ammonium sulfate, in which the quaternary groups make direct π‐cation interactions with the indole. These findings have implications for structure‐based drug design, since data for ligand‐protein complexes with polyethylene glycol as precipitant may not reflect the ligand's position in its absence, and could result in selecting incorrect drug discovery leads. Docking methylene blue into the structure obtained with PEG200, but omitting the ethyleneglycols, yields results agreeing poorly with the crystal structure; excellent agreement is obtained if they are included. Many proteins display features in which precipitants might lodge. It will be important to investigate presence of precipitants in published crystal structures, and whether it has resulted in misinterpreting electron density maps, adversely affecting drug design.
Keywords: polyethylene glycol, structure‐based drug discovery, acetylcholinesterase, methylene blue, decamethonium
Short abstract
Abbreviations
- Aβ
amyloid beta
- ACh
acetylcholine
- AChE
acetylcholinesterase
- AS
ammonium sulfate
- CAS
catalytic “anionic” subsite
- DECA
decamethonium
- DSC
differential scanning calorimetry
- MB
methylene blue
- MES
2‐(N‐morpholino)ethanesulfonic acid
- PAS
peripheral anionic site
- PDB
Protein Data Bank
- TcAChE
Torpedo californica acetylcholinesterase
- RMSD
root mean square deviation.
Introduction
Structure‐based drug design utilizes experimental 3D structures of apoproteins, or of appropriate complexes, that are usually retrieved from the PDB. Over 57% of the crystal structures in the PDB were obtained utilizing polyethylene glycols as precipitants. This is because they frequently yield successful “hits” and, at the same time, serve as effective cryoprotectants when X‐ray data collection is performed at cryogenic temperatures. However, in less than 6% of these structures is the presence of individual ethylene glycol oligomers reported. In the following, we describe a case in which the presence of such oligomers in a crystal structure markedly affected the position of the bound ligand, and discuss the implications for structure‐based drug design.
The synaptic enzyme, acetylcholinesterase (AChE), is an important target for drug design. AChE inhibitors are employed in the treatment of myasthenia gravis and other neuromuscular diseases1; the first generation of drugs for the management of Alzheimer's disease are also AChE inhibitors.2 Furthermore, AChE is the principal target of nerve agents and of many insecticides.3, 4 It has, therefore, been the subject of numerous studies that have used computational techniques and docking protocols to discover novel lead compounds that will show promise in various pharmacological/toxicological contexts, including management of Alzheimer's disease, development of countermeasures against organophosphate nerve agents, and design and synthesis of novel pesticides.2, 4, 5, 6, 7, 8
The 3D crystal structure of AChE reveals that the active site of this unusually rapid serine hydrolase resides near the bottom of a deep and narrow cavity, which we named the active‐site gorge, whose walls are lined by 14 highly conserved aromatic residues.9 Figure 1(A) shows a cross‐section through the gorge for Torpedo californica (Tc) AChE, which runs down the axis between two subdomains.10 Highlighted are several of the conserved aromatic residues: Trp279, in the peripheral anionic site (PAS) at the top of the gorge; Tyr121, mid‐way down the gorge, and Trp84, the principal element of the catalytic “anionic” subsite (CAS), near the bottom. Also shown are two members of the catalytic triad, Ser200 and His440. We, and others, have solved and analyzed the 3D structures of many complexes and conjugates of AChE, including Torpedo californica (Tc) AChE,11, 12 mouse,13, 14, 15, 16 human,12, 17, 18, 19 and Drosophila melanogaster AChE.20
Figure 1.
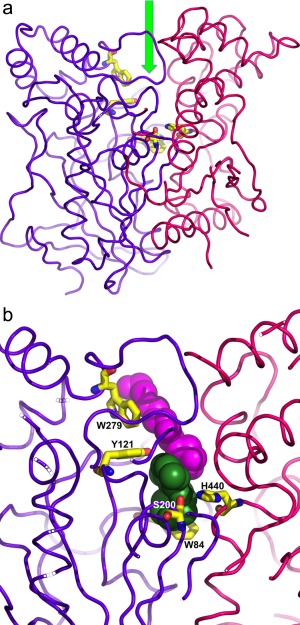
A. Ribbon representation of the crystal structure of TcAChE showing its two subdomains (residues 4–305, purple, and residues 306‐535, red). The entrance to the active‐site gorge, located between the two subdomains, is marked by an arrow. Ser200 and His440, within the catalytic triad, Trp84, in the “anionic” subsite, Tyr121, in the middle of the gorge, and Trp279, in the peripheral anionic site (PAS) at the top of the gorge, are shown as stick models, with carbon atoms colored yellow; B. Close‐up of the active‐site gorge taken from the crystal structure of the galanthamine/TcAChE complex [PDB code 1DX6].29 The protein backbone and the individual residues are colored as in (A). The galanthamine is shown in space‐filling format in green, and above it an ethylene glycol tetramer in magenta.
Structure‐based drug design utilizes docking algorithms to study how a potential lead compound interacts with a target such as an enzyme or a drug receptor,21, 22 making use of 3D crystal or NMR structures deposited in the PDB, which serve as templates. The unique shape and characteristics of AChE's active‐site gorge make it a challenging target for drug design. Some AChE inhibitors interact preferentially with the catalytic site and/or with the CAS, at the bottom of the gorge, others with the PAS, and still others span the two sites. The fact that much of the surface of the gorge is lined by the rings of the 14 conserved aromatic residues, which interact with the substrate, acetylcholine (ACh), via π‐cation interactions,9, 23 and with a variety of inhibitors via π‐cation and/or π‐π stacking interactions,2 makes it an unusual target for application of docking algorithms. The suggestion that the PAS may accelerate aggregation of the Aβ peptide to amyloid fibers24 led to the design and synthesis of bifunctional ligands intended to fulfill a dual role in the management of Alzheimer's disease by both reducing ACh hydrolysis via blocking of the CAS, and retarding amyloid deposition by blocking the PAS.25, 26 An extension of this approach resulted in the design of gorge‐spanning inhibitors in which the moiety interacting at the PAS could also interact with other targets.7, 8 An interesting example of such a multifunctional drug is ladostigil (TV3326), a dual inhibitor of AChE and monoamine oxidase,27 designed as a possible treatment for Alzheimer's disease.
A detailed comparison of the crystal structures of native TcAChE, and of four complexes, identified over 20 waters within the active‐site gorge of the native enzyme, many of which are retained in the 3D structures of the complexes.28 Furthermore, in certain crystal structures of complexes for which the native crystals have been generated using polyethylene glycol as the precipitant, ethylene glycol oligomers can be seen within the gorge. For example, in the galanthamine/TcAChE complex, an ethylene glycol tetramer is seen, stacked above the galanthamine at the top of the gorge [Fig. 1(B)].29 We subsequently showed, using PEG‐SH‐350, which consists mainly of an ethylene glycol heptamer with a terminal thiol group (thioPEG), that a thioPEG/TcAChE complex could be obtained in which a single molecule of the ligand spanned the gorge.30 The thioPEG oligomer makes C−H…π interactions with the indole ring of conserved Trp84, which structurally mimic the π‐cation interaction made by the quaternary group of the substrate, acetylcholine (ACh), with that residue.9, 23
The photosensitizer methylene blue (MB; Fig. 2) is a strong reversible inhibitor of AChE in the absence of illumination.31, 32, 33 Under illumination, TcAChE undergoes irreversible inactivation, primarily due to photo‐oxidation of two conserved tryptophans—Trp84, in the CAS, and Trp279, in the PAS.34 Crystals of a MB/TcAChE complex were obtained by soaking the ligand into native crystals obtained using PEG200 as the precipitant, and the 3D structure of the complex was obtained at 2.4 Å.35 In this complex (PDB Access Code: 2W9I), the MB molecule is stacked against the indole ring of W279, with its proximal dimethylamino moiety pointing down the gorge toward the active site, but clearly not within bonding distance of the indole ring of Trp84.
Figure 2.
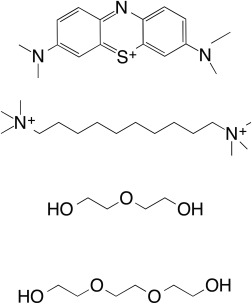
Chemical structures of methylene blue (MB), decamethonium (DECA), diethylene glycol (PEG), and triethylene glycol (PGE).
A theoretical study aimed at identifying ligands binding selectively to the PAS utilized AutoDock 4.2 and AutoDock Vina to screen for such ligands.36 While some ligands docked in poses closely resembling the position of the ligand in the crystal structures of complexes with TcAChE, others displayed poor overlap, notably MB.
In various crystal structures that we have reported of complexes of TcAChE with ligands bearing a charged nitrogen atom, a cation‐π interaction was observed between the nitrogen atom and the indole ring of Trps84 in the CAS.23, 37 The discrepancy between these data and the positioning of the MB in the MB/TcAChE complex led us to consider the possibility that the precipitant employed for crystallization, namely PEG200, was affecting the position of the MB within the gorge. Such an effect could, in principle, invalidate structure‐based drug design that utilized the crystal structure as the docking template, since it might not faithfully replicate the situation in solution.
We considered, therefore, that it would be of interest to generate an MB/TcAChE complex devoid of PEG200 by producing crystals using ammonium sulfate ([NH4]2SO4; AS) as the precipitant. This would permit comparison of the MB/TcAChE crystal structure thus obtained with that obtained in the presence of PEG200. In parallel, we compared the effects of AS and PEG200 on the activity of TcAChE, and on its inhibition by MB, and performed spectroscopic and calorimetric comparisons of the interaction of MB with TcAChE in the presence of the two precipitants. Finally, we used a docking protocol to compare the effects of the two precipitants on docking of MB into the TcAChE protein template.
Results
Structural studies
For our comparative structural analysis we used the crystal structures of the MB/TcAChE and DECA/TcAChE complexes obtained in the presence of PEG200 and of AS. We earlier showed that trigonal crystals of TcAChE obtained using either AS or PEG200 as the precipitant are isomorphous.9, 38 In the current study, the procedure that we developed to obtain trigonal crystals with AS as precipitant required addition of 20 mM decamethonium bromide (DECA; Fig. 2) to the precipitation medium, resulting in crystals of the DECA‐AS/TcAChE complex (see Materials and Methods). To obtain crystals of the MB‐AS/TcAChE complex, the DECA in the trigonal crystals was subsequently displaced by MB.
The DECA molecule in the DECA‐AS/TcAChE structure is aligned along the axis of the active‐site gorge, spanning the CAS and the PAS, as earlier reported.37 The ligand makes nonbonded interactions with six of the conserved aromatic residues that line the gorge surface, namely, Tyr70, Trp84, Tyr121, Trp279, Phe330, and Phe331 [Fig. 3(A)]. In the DECA‐PEG/TcAChE structure an ethylene glycol dimer is seen at the bottom of the active‐site gorge, between the proximal quaternary group of the DECA and the indole ring of Trp84 [Figs. 3(B) and 4(A)]. Superposition of the DECA‐AS/TcAChE structure on that of DECA‐PEG/TcAChE yields an RMSD of 0.27 Å (for 532 Cα atoms); thus, all the gorge side‐chains maintain their native conformation in the complex. Due to the presence of the ethylene glycol dimer at the bottom of the gorge in the DECA‐PEG/TcAChE structure, the DECA molecule is positioned further up the gorge than in the DECA‐AS/TcAChE structure [Figs. 3(B), 4(A), and 5(A)]. It makes non‐bonding interactions with five aromatic side‐chains, with four of which it also interacts in the DECA‐AS/TcAChE structure, namely, Tyr70, Tyr121, Trp279, and Phe330. However, interaction with Phe331 is replaced by interaction with Tyr334, and interaction with Trp84 no longer occurs.
Figure 3.
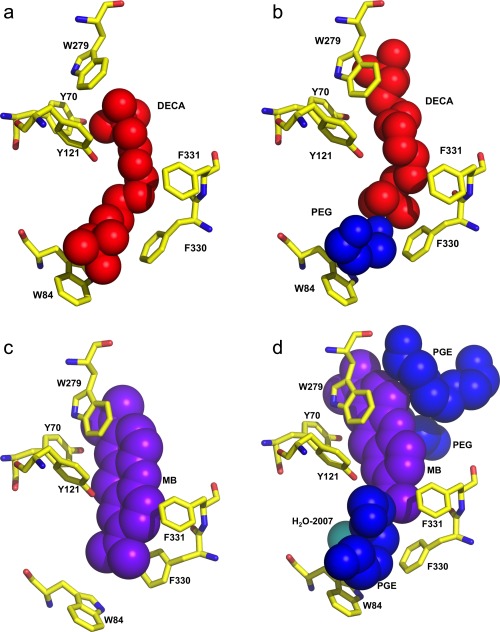
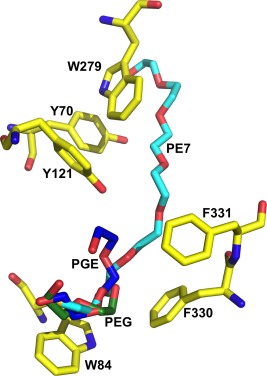
Space‐filling representations of the active‐site gorge regions of the DECA/TcAChE and MB/TcAChE complexes. A. DECA within the gorge of the DECA‐AS/TcAChE complex; B. DECA within the gorge of the DECA‐PEG/TcAChE complex. The DECA molecule is colored red, and the PEG moiety blue; C. MB within the gorge of the MB‐AS/TcAChE complex. The MB molecule is colored purple; D. MB within the gorge of the MB‐PEG/TcAChE complex. The MB molecule is colored purple; the PEG and the two PGEs are colored blue, and a conserved water, H2O‐2007, is in cyan. In all four panels conserved aromatic residues within the active‐site gorge are shown as stick models with carbon atoms in yellow.
Figure 4.
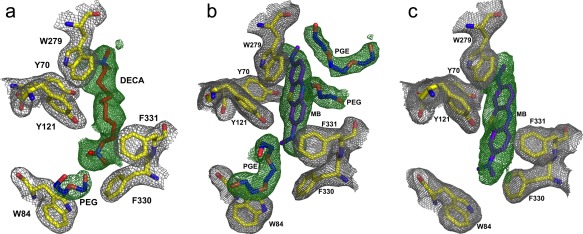
Electron density maps of the active‐site gorge regions of the DECA‐PEG/TcAChE, MB‐PEG/TcAChE and MB‐AS/TcAChE complexes. The grey mesh corresponds to the 2Fo‐Fc electron density map, and the green mesh to the Fo‐Fc map. Amino acids fitted to the 2Fo‐Fc map are shown as stick models, with carbons in yellow; A. DECA‐PEG/TcAChE complex. DECA and ethylene glycol oligomers fitted to the Fo‐Fc map are shown as stick models with carbons in red (DECA) and blue (ethylene glycol oligomers); B. MB‐PEG/TcAChE complex. The MB and the ethylene glycol oligomers fitted to the Fo‐Fc map are shown as purple and blue stick models, respectively; C. Electron density map of the MB‐AS/TcAChE complex, with color coding as in (B).
Figure 5.
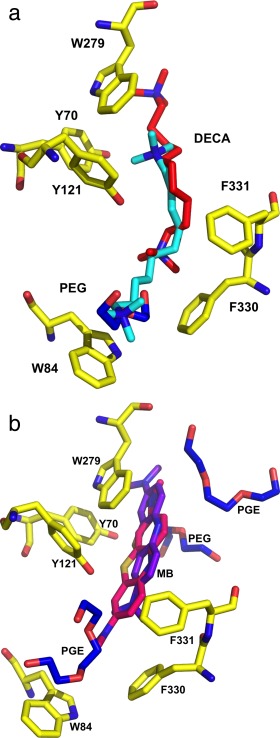
Overlays of the active‐site gorge regions in the crystal structures of the DECA and MB complexes obtained with PEG/TcAChE and AS/TcAChE crystals. A. Overlay of the DECA‐PEG/TcAChE and DECA‐AS/TcAChE structures. The DECA in the DECA‐PEG/TcAChE structure is shown as red sticks, and the ethylene glycol oligomers as blue sticks. The DECA in the DECA‐AS/TcAChE structure is shown as cyan sticks. B. Overlay of the MB‐PEG/TcAChE and MB‐AS/TcAChE structures. The MB in the MB‐PEG/TcAChE structure is shown as purple sticks, and the PEG dimer and the 2 PGE trimers as blue sticks. The MB in the MB‐AS/TcAChE structure is shown as pink sticks. In both overlays the conserved aromatic residues within the active‐site gorge are displayed as stick models with carbon atoms colored yellow.
To assess the effect of PEG200, employed as the precipitant, on the positioning of MB within the gorge, we determined the structure of the MB‐AS/TcAChE complex obtained using crystals grown from AS [Fig. 4(C)], and reevaluated the previously published structure of TcAChE obtained in the presence of PEG200 [PDB code: 2W9I].35 The revised and rerefined MB‐PEG/TcAChE structure has been deposited as PDB code 5E4T. On careful examination of the electron density maps of the 2W9I structure, we detected 9 EDO (ethylene glycol) molecules, 12 PEG dimers (PEG in PDB nomenclature), and 5 PEG trimers (PGE in PDB nomenclature), none of which had previously been assigned. Most of these molecules are on the protein surface (not shown). However, one trimer nests against MB at the top of the active‐site gorge, a dimer is positioned midway down the gorge, and a second trimer is located at the bottom of the gorge, between the proximal dimethylamino moiety of MB and the indole ring of Trp84 [Figs. 3(D) and 4(B)]. Consequently, the MB molecule is positioned further up the gorge than in the MB‐AS/TcAChE complex [Figs. 3(D), 4(B), and 5(B)]. The ethylene glycol trimer at the bottom of the gorge is in the same position as the ethylene glycol dimer seen in the DECA‐PEG/TcAChE structure, and both overlap with the proximal segment of the thioPEG heptamer in its complex with TcAChE,30 as seen in Figure 6.
Figure 6.
Overlay of the PGE molecule adjacent to Trp84 in the MB‐PEG/TcAChE and the PEG molecule in the DECA‐PEG/TcAChE complex on the crystal structure of the complex of TcAChE with the thioPEG heptamer. A stick representation of PEG‐SH‐350 (the thioPEG heptamer) in its complex with TcAChE (PDB entry 1JJB) is shown, with carbon atoms in cyan, and the sulfur as a brown sphere. Several aromatic residues lining the active‐site gorge are also shown in stick format, with carbons in yellow. Overlaid are stick models of the PGE oligomer adjacent to Trp84 in MB‐PEG/TcAChE (carbons in blue) and the PEG in the DECA‐PEG/TcAChE (carbons in green).
Spectroscopic measurements
We earlier showed that binding of MB to TcAChE produces a bathochromic shift in its spectrum from ∼663 nm to ∼683 nm.35 Figure 7(A,B) present analogous experiments carried out in the presence of the two crystallographic precipitants, AS and PEG200, respectively, in which an MB solution was titrated with increasing amounts of TcAChE. The data obtained in the presence of AS [Fig. 7(A)] are very similar to those obtained in the absence of either of the precipitants [Fig. 7(C)]. However, in the presence of PEG200, the bathochromic shift is substantially reduced, from ∼683 to ∼674 nm [Fig. 7(B,C)]. This is apparently a consequence of the fact that in the presence of PEG200 the MB is shifted ∼3.0 Å up the gorge (Table 1), thus interacting differently with the indole ring of Trp279, and not interacting at all with Trp84 [see crystal structures in Figs. 4(A,B) and 5(A)].
Figure 7.
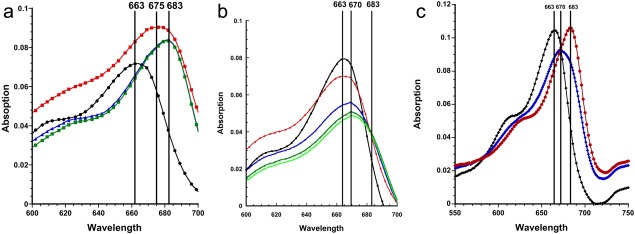
Spectroscopic monitoring of the interaction of MB with TcAChE in the presence of AS or PEG200. Solutions of MB in the presence of either AS or PEG200 were titrated with increasing amounts of TcAChE. A. A solution of 2 μM MB in 30% AS (v/v)/0.1 M NaCl/10 mM sodium phosphate, pH 7.0 ( ) was titrated with TcAChE to final concentrations of 1.2 μM TcAChE (
 ), 7.2 μM TcAChE (
 ) and 13 μM TcAChE (
 ); B. A solution of 2 μM MB in 20% PEG200 (v/v)/0.1 M NaCl/10 mM sodium phosphate, pH 7.0 (
 ) was titrated with TcAChE to final concentrations of 1.2 μM TcAChE (
 ), 7.2 μM TcAChE. (
 ), 13 μM TcAChE (
 ) and 73 μM TcAChE (
 ); C. Spectrum of MB alone in 0.1 M NaCl/10 mM sodium phosphate, pH 7.0 (
 ); MB in the presence of a saturating concentration of TcAChE in 0.1 M NaCl/10 mM sodium phosphate, pH 7.0 (
 ), and MB in in the presence of a saturating concentration of TcAChE in 20% PEG200 (v/v)/0.1 M NaCl/10 mM sodium phosphate, pH 7.0 (
 ).
).
Table 1.
Distance from Proximal Cationic Group to the Indole Ring of W84
| Complex with TcAChE | From atom to atom | Distance (Å) |
|---|---|---|
| MB‐PEG | N18 of MB to CD1 of W84 | 8.0 |
| MB‐AS | N18 of MB to CD1 of W84 | 4.8 |
| DECA‐PEG | N1 of DECA to CE3 of W84 | 8.0 |
| DECA‐AS | N1 of DECA to CE3 of W84 | 4.1 |
Calorimetric measurements
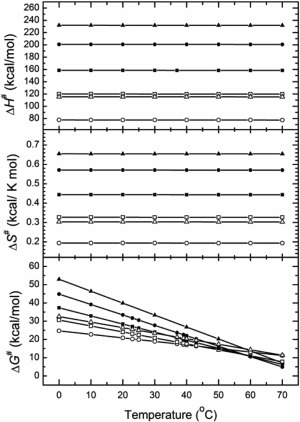
The thermal denaturation of the MB/TcAChE complex, like that of native TcAChE, gives rise to well defined DSC transitions (Fig. 8). As in our earlier studies,35, 39, 40, 41 the values of the temperature of the excess heat capacity maximum (T m), as well as the forms of the calorimetric contours for native TcAChE and for the MB/TcAChE complex, depend on the temperature scan rate (not shown). Moreover, thermal denaturation of TcAChE, under the experimental conditions employed, is always calorimetrically irreversible, since on reheating of the same sample no thermal effect is observed. Such behavior is characteristic of an irreversible, kinetically controlled process.42, 43 Accordingly, analysis of the DSC transitions under these conditions utilized a simple two‐state irreversible model (see Materials and Methods). The results of fitting the experimental data (symbols) to this model (solid lines) are displayed in Figure 8, and presented in Table 2. It is seen that a good approximation was achieved. Furthermore, no dependence of the shape of DSC contours on the protein concentration was observed within the range of 0.3–1.7 mg/mL.
Figure 8.
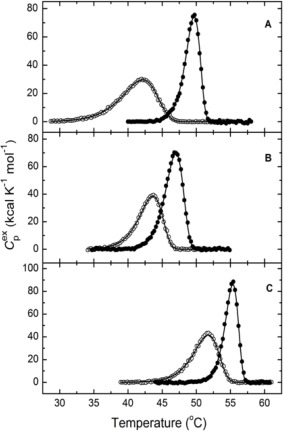
Differential scanning calorimetry (DSC) of native TcAChE and of the MB/TcAChE complex in the presence and absence of PEG200 and AS. A. Temperature dependence of the excess molar heat capacity of TcAChE (○‐○‐○) and of the MB/TcAChE complex (•‐•‐•) in 100 mM NaCl/10 mM HEPES, pH 7.0; B. In the same buffer with the addition of 10% PEG‐200; C. In the same buffer with the addition of 10% AS. The scan rate was 60 K/h. Solid lines represent the best fits for each calorimetric curve, using Eq. (1). The TcAChE concentration was 10 μM, and that of MB in the solution of the complex was 50 μM.
Table 2.
Arrhenius Equation Parameter Estimates for TcAChE and for the MB/TcAChE Complex in the Presence and Absence of PEG200 and Ammonium Sulfate
| TcAChE | MB/TcAChE | TcAChE + PEG200 | MB/TcAChE + PEG200 | TcAChE + AS | MB/TcAChE + AS | |
|---|---|---|---|---|---|---|
| ΔH (kcal mol−1) | 200.8 ± 3.8 | 209.8 ± 4.1 | 172.9 ± 4.8 | 242.7 ± 4.1 | 203.2 ± 4.6 | 219.1 ± 3.6 |
| EA (kcal mol−1) | 78.2 ± 1.4 | 201.3 ± 2.1 | 120.5 ± 1.9 | 159.0 ± 1.6 | 115.9 ± 1.6 | 232.4 ± 1.4 |
| T* (°C) | 44.5 ± 0.2 | 49.7 ± 0.2 | 44.5 ± 0.1 | 47.4 ± 0.2 | 52.8 ± 0.2 | 55.3 ± 0.2 |
| r a | 0.9991 | 0.9991 | 0.9988 | 0.9993 | 0.9988 | 0.9990 |
The correlation coefficient (r) that is used as the criterion for accuracy of fitting was calculated as , where yi and are, respectively, the experimental and calculated values of , is the mean of the experimental values of , and n is the number of points.
Thus, the denaturation of TcAChE and its complexes is a first‐order reaction. We can analyze this process in the thermodynamic form of the rate equation obtained from conventional transition state theory,44 which assumes that a special type of equilibrium exists between reactants and activated complexes (see Materials and Methods). Although this formalism can only be applied rigorously to simple molecules in the gas phase, it has nevertheless been useful in studying macromolecular phase transitions. In the present study, it was used to extract effective values of thermodynamic parameters for the stabilization (destabilization) of the TcAChE molecule by different additives. The values thus obtained from analysis of the calorimetric data are presented in Figure 9.
Figure 9.
Variations in the thermodynamic functions of TcAChE (open symbols) and of the MB/TcAChE complex (closed symbols) in 100 mM NaCl/10 mM HEPES, pH 7.5 (circles), in the same buffer with 10% PEG200 (squares), and in the same buffer containing 10% AS (triangles). The data presented in Table 2 and Figs. 8 and 9 show that whereas addition of AS to a native TcAChE solution increases its thermal stability (Gibbs energy of activation ‐ ΔG#), PEG200 has no effect. However, for the MB/TcAChE complex, which displays overall increased stability relative to native TcAChE,35 while addition of AS increases stability, as for the native enzyme, PEG200 actually decreases stability.
Kinetics
TcAChE was preincubated with diethylene glycol (PEG), at 1‐11% w/v (equivalent to ∼0.1–1.1 M), for 5 min at 25°C, in 50 mM sodium phosphate, pH 8.0. Residual activity was then determined by adding acetylthiocholine, and monitoring activity by the Ellman protocol.45 Using a Lineweaver–Burk plot, a Ki of 0.17 ± 0.03 M (n = 3) was determined. The inhibition pattern is consistent with PEG serving as a competitive inhibitor.
Docking studies
Wildman and coworkers36 used both AutoDock 4.246 and AutoDock Vina47 to dock a number of AChE inhibitors, including MB, into the crystal structures of TcAChE and human AChE. They assessed their results in terms of the degree of overlap of the position of the ligand in the docked structures with its position in the experimentally determined crystal structure using the ROCS program.48 For several docked ligands they reported overlap values of 80% and better using AutoDock Vina, but obtained a much lower value of only ∼56% for MB. Using AutoDock 4.2, lower overlaps for most ligands were reported; specifically, that for MB decreased to 42.5%.
The docking protocol employed by Wildman et al.36 utilized as the docking template the crystal structures of the complexes from which the complexed ligand had been removed. In the case of MB this would be the 2W9I structure, but without the ethylene glycol oligomers whose presence in the active‐site gorge we described above, and without the water molecules. We conjectured that the poor overlap of the docked MB with the MB in the crystal structure might be a consequence of the fact that they were docking the ligand into the “naked” protein template, devoid of the ethylene glycol oligomers that we now know to be present, and of the waters in the gorge. We thought, therefore, that it would be of interest to perform the docking of MB both into the 2W9I protein template, as Wildman et al.36 had done, but also into the same template, but including the ethylene glycol oligomers and/or the gorge waters (PDB code 5E4T). As an additional control, we docked MB into the protein template of the MB/TcAChE complex obtained using AS the precipitant (PDB code 5DLP).
For our docking trials, we used the Glide‐XP docking program. Glide has been demonstrated to be a very accurate docking tool for ligand‐protein binding studies.49, 50, 51, 52 Glide‐XP offers the additional advantage that it incorporates π‐π and π‐cation interactions into its energy force field49; this renders it particularly suitable for docking ligands into the active‐site gorge of AChE, which is coated with the rings of multiple conserved aromatic residues.
The target TcAChE structures used were:
The MB‐PEG/TcAChE complex obtained using crystals formed using PEG200 as the precipitant [PDB‐IDcode: 5E4T], with the three ethylene glycol oligomers retained in the gorge, and MB removed.
The MB‐PEG/TcAChE complex obtained using crystals formed using PEG200 as the precipitant [PDB‐IDcode: 5E4T], with both the MB and all the water molecules removed.
The MB‐PEG/TcAChE complex obtained using crystals formed using PEG200 as the precipitant [PDB‐IDcode: 5E4T], with the MB and the ethylene glycol oligomers in the gorge removed.
The MB/TcAChE complex obtained using crystals formed using PEG200 as the precipitant [PDB‐IDcode: 5E4T], with the MB and the ethylene glycol oligomers in the gorge removed, as well as all the waters.
The MB‐AS/TcAChE complex obtained using crystals formed using AS as the precipitant [PDB‐5DLP], with the MB removed.
Docking of MB into the X‐ray structure obtained using crystals grown from PEG200, namely, MB‐PEG/TcAChE, yields a pose that closely resembles the position of the ligand in the crystal structure [RMSD 0.58 Å; see Table 3 and Fig. 10(A)]. Removal of all the water molecules has little effect [Fig. 10(B)], implying that the ethylene glycol oligomers within the gorge determine, to a great extent, the position of MB in this crystal structure. On removal of the ethylene glycol oligomers [Fig. 10(C)], the docked MB molecule moves down the active‐site gorge about half way toward the position of the MB in the MB‐AS/TcAChE complex. On removal of the ethylene glycol oligomers, together with all the water molecules [Fig. 10(D)], the docked MB molecule moves down the active‐site gorge, to a position very similar to that seen in the MB‐AS/TcAChE complex. Docking of MB into the MB‐AS/TcAChE crystal structure from which the MB and all the waters had been removed produced a pose very similar to the position of the MB in the MB‐AS/TcAChE crystal structure [RMSD 0.98 Å; Fig. 10(E)]. In Figure 10(F), for comparison, the docking of MB shown in Figure 10(D) (i.e., to MB‐PEG/TcAChE from which the MB, the two ethylene glycol trimers, the ethylene glycol dimer in the gorge, and all waters, had been removed) is compared to the experimentally observed MB‐AS/TcAChE structure. It can be seen that it is very close to the experimental structure, with an RMSD of 1.06 Å between the two (Table 3).
Table 3.
Docking of MB to MB/TcAChE Crystal Structures using Glide XP
| RMSD between docked MB and the MB in the two MB/TcAChE crystal structures (Å) | |||
|---|---|---|---|
| Docking target | Docking Score | MB in 5E4T a | MB 5DLP b |
| 5E4T | −7.88 | 0.58 | 2.67 |
| 5E4T minus all waters | −7.81 | 0.57 | 2.64 |
| 5E4T minus all ethylene glycols | −6.89 | 1.79 | 1.32 |
| 5E4T minus all ethylene glycols and all waters | −7.00 | 3.79 | 1.06 |
| 5DLP minus all waters | −7.20 | 3.49 | 0.98 |
Figure 10.
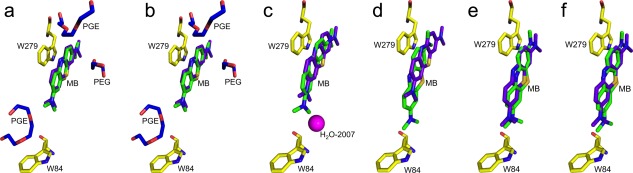
Overlays of docked MB/TcAChE complexes obtained using Glide XP and the corresponding experimental crystal structures. A. Overlay of MB docked into the crystal structure of MB‐PEG/TcAChE [PDB‐ID 5E4T] from which the MB had been removed prior to docking, and the experimental MB‐PEG/TcAChE crystal structure; B. As in (A), but both the MB and all the waters were removed prior to docking; C. As in (A), but both the MB and all three ethylene glycol oligomers were removed prior to docking. H2O‐2007 is represented by a magenta sphere; D. As in (A), but the MB, all the waters, and all three ethylene glycol oligomers were removed prior to docking; E. MB was docked into the crystal structure of MB‐AS/TcAChE [PDB‐ID 5DLP] from which the MB and all the waters had been removed prior to docking. F. The docking of MB shown in D is compared to the experimentally observed MB‐AS/TcAChE structure. The experimental MB in each structure is depicted as sticks with the carbon atoms colored purple, while the docked structures are shown as sticks with the carbon atoms colored green. ethylene glycol oligomers are shown in blue, and two key residues, namely, Trp84 and Trp279, are shown with carbon atoms in yellow, oxygen atoms in red, and nitrogens in blue.
PDB data mining
Of the 101,330 crystal structures in the PDB (as of November 17, 2015), 58,104 (i.e., 57%) reported polyethylene glycols of various compositions (see Materials and Methods) in the crystallization conditions. In only 3006 of these, that is, 5.2%, were coordinates for one or more ethylene glycol oligomers modeled in the entry. We additionally found 293 PDB entries in which ethylene glycol oligomers were modeled, without mention of “PEG” in the crystallization conditions. About half of these (152) had no description of any compounds used for crystallization, nine entries had ambiguous crystallization conditions that could only be understood from the related publication, and six entries had misspellings of “PEG” that caused the data mining to fail (these were reported to the PDB so that they can be corrected). The remaining 126 entries had several compounds described in the crystallization conditions, but no polyethylene glycols or ethylene glycol oligomers of any kind. Notably, in nine of these entries Jeffamine53 was included in the crystallization conditions. It is not unlikely that some of the modeled ethylene glycol oligomers were the result of misidentification of Jeffamine molecules. The omission of ethylene glycol oligomers in the crystallization conditions might have resulted from oversights or from incomplete description of the experimental conditions; but ethylene glycol oligomers might also have been introduced as a cryo‐protectant or as a pollutant (e.g., as a result of dialysis).
Discussion
Structure‐based drug design utilizes docking algorithms to study how a potential lead compound interacts with a target such as an enzyme or a drug receptor.21, 22, 54 Such docking algorithms make use of 3D crystal or NMR protein structures that serve as templates. For over two decades they have been widely employed tools in drug design. When structure‐based drug design uses as reference points one or more complexes of compounds of interest with the target protein, it has the potential to generate more authoritative data.55
Docking programs have become increasingly sophisticated, taking into account, for example, flexibility of both the target protein and the ligand.56 Attention has also been paid to binding sites for water57 and organic solvents.58 But, in general, such studies are focused on the identification of such binding sites, and on the energetics of desolvation associated with the displacement of the solvent that occurs on binding of a ligand. Our studies on a large repertoire of complexes and conjugates of TcAChE have led us to realize that often, although binding of a ligand within the active‐site gorge certainly displaces some water molecules, other water molecules remain tightly associated with the walls of the gorge, and may actually bridge between the protein and the ligand.11, 20, 28, 59, 60 Thus, in a sense, they may be regarded as an element of the protein template to which the ligand binds. In recent years, most of the TcAChE complexes whose structures we solved were obtained by soaking the ligand into crystals obtained using various polyethylene glycols as precipitants.29, 61, 62, 63 As already mentioned in the Introduction, polyethylene glycols are amongst the mostly widely used precipitants for obtaining protein crystals, and in many datasets deposited in the PDB, ethylene glycol oligomers bound at specific loci can be assigned. We thus realized that ethylene glycol oligomers might penetrate the active‐site gorge of AChE. Indeed, in one case, that of the galanthamine/TcAChE complex, we identified an ethylene glycol tetramer nesting above the bound ligand, near the top of the gorge.29 Subsequently, we solved the crystal structure of the complex with TcAChE of an ethylene glycol oligomer (primarily heptameric) bearing a terminal thiol group, and showed that it interacts specifically with the indole of Trp84, in the CAS, via C…H–π interactions that structurally mimic the cation‐π interactions made by the choline moiety of Ach.30 In the present study, the ethylene glycol oligomers identified at the bottom of the gorge in the MB‐PEG/TcAChE and DECA‐PEG/TcAChE complexes overlap well with the proximal segment of the thioPEG heptamer (Fig. 6). It is, thus, plausible that they interact with Trp84 via C…H–π interactions similar to those made by the thiol‐containing heptamer.
Under Results we reported an inhibition constant of 0.17 M for diethylene glycol (PEG in PDB nomenclature). A similar value might be expected for PEG200, which is, on the average, a tetramer. Under Materials and Methods it can be seen that 20 mM MB and 2.5 mM DECA were soaked into the TcAChE crystals precipitated from 46%(v/v) PEG200 to obtain the corresponding MB‐PEG/TcAChE and DECA‐PEG/TcAChE complexes. We have reported Ki values toward TcAChE of 0.3 μM for DECA64 and 40 nM for MB.35 If simple competition were to occur, the concentrations of the two ligands employed should have sufficed to displace the ethylene glycol oligomers from the bottom of the gorge. It is possible, however, that a cooperative interaction occurs between the bound ligands, the ethylene glycol oligomer, and the protein.
One puzzling aspect of our earlier study on the MB/TcAChE complex35 was the observation that neither a ligand specific for the CAS alone, nor one specific for the PAS alone, could completely displace MB from the active‐site gorge. We conjectured that when edrophonium, specific for the CAS, displaces MB, the MB, rather than exiting the gorge, remains stacked against Trp279, adopting an altered alignment from which it can only be completely displaced by a PAS‐specific ligand, such as propidium. The crystallographic data in the present study indeed show that MB, initially bound to Trp84, can realign further up the gorge in the presence of PEG200, rather than being expelled. That a similar change occurs also in solution is indicated by the spectroscopic data (Fig. 7). Titration of MB with TcAChE in the presence of AS produces a bathochromic shift similar to that observed in its absence. But titration in the presence of PEG200 produces a substantially smaller shift. This can be ascribed to a different mode of interaction of the MB moiety with Trp279. Thus, in the MB‐AS/TcAChE crystal structure, the distal dimethylamino group makes a π‐cation interaction with the six‐membered ring of the indole moiety of Trp279, whereas in the MB‐PEG/TcAChE structure there is greater overlap; as a consequence, it makes a π‐cation interaction with the five‐membered ring of the indole group, and there is a π‐π interaction between the distal six‐membered ring of the MB and the six‐membered ring of the indole.
Our calorimetric studies showed that, whereas PEG200 does not affect the thermal stability of TcAChE, AS increases it substantially (Table 2 and Figs. 8 and 9), as might be predicted.65 However, whereas AS also increases the thermal stability of the MB/TcAChE complex, PEG200 actually decreases it. The decrease in stability produced by PEG200 may, at least in part, be ascribed to breaking of the π‐cation bond between MB and Trp84.
It is of interest that in all the datasets that we have collected using crystals obtained with AS as the precipitant, we have never observed sulfate ions in the active‐site gorge. Moreover, we have never seen any evidence for the presence of metal cations within the gorge, even though they are frequently components of the precipitant solution. This is in keeping with our conjecture that the active‐site gorge is designed to facilitate penetration of quaternary ligands down a potential gradient toward the active site,66 while excluding tightly solvated metal cations.67
As already mentioned, AutoDock 4.2 and AutoDock Vina were employed in a study concerned with discovery of drug‐like leads for AChE.36 Poor overlap of the docked structure and the crystal structure was seen for MB docked to TcAChE using AutoDock Vina (55.9%), and even poorer overlap was obtained using Autodock 4.2 (42.5%). We, too, obtained poor scores for docking MB into TcAChE, whether with AutoDock 4.2 or with AutoDock Vina.
As described above, when we carefully reexamined the electron density maps for the MB‐PEG/TcAChE complex, obtained using PEG200 as the precipitant, we observed three regions of electron density within the active‐site gorge that could be fitted well as ethylene glycol oligomers. When we determined the structure of the MB‐AS/TcAChE complex obtained using AS as the precipitant, we found that the MB was positioned further down the gorge, much closer to Trp84. We also solved the structures of complexes of TcAChE with DECA using crystals precipitated with PEG200 (DECA‐PEG/TcAChE) or with AS (DECA‐AS/TcAChE); here, too, we found that in the absence of ethylene glycol oligomers the ligand was positioned further down the gorge.
The active‐site gorge of TcAChE (and of other AChEs) is lined with 14 conserved aromatic amino acids, most of which are crucially involved in the interactions with ACh itself and with inhibitors. Glide‐XP incorporates π‐π and π‐cation interactions in its energy force field.49 We therefore utilized it to redock MB both into the crystal structures of MB‐PEG/TcAChE and of MB‐AS/TcAChE. In both cases, docking generated poses closely resembling the position of the ligand in the crystal structure, with RMSD values of 0.58 Å and 0.98 Å, respectively (Table 3). If all the waters were removed from the MB‐PEG/TcAChE structure, the pose of the docked ligand was virtually identical to that obtained with the waters present [compare Fig 10(A,B); see also Table 3]. If, however, the ethylene glycol oligomers were omitted from the MB‐PEG/TcAChE structure, but the waters were retained, the pose of the docked MB was about midway between those seen in the MB‐PEG/TcAChE and in the MB‐AS/TcAChE [Fig 10(C), Table 3]. When all the waters and the ethylene glycol oligomers were omitted from the MB‐PEG/TcAChE, the pose of the docked MB was very close to that seen both for the experimental the MB‐AS/TcAChE crystal structure and for MB docked into of MB‐AS/TcAChE [Fig. 10(D–F), Table 3]. We were initially puzzled by why removal of just the waters hardly affected docking, whereas their presence when the ethylene glycol oligomers were removed had a significant affect. It turned out that one water, that is, H2O‐2007 in MB‐PEG/TcAChE, blocks the movement of the MB to the bottom of the gorge, even when the ethylene glycol trimer at the bottom of the gorge is absent. This water makes H‐bonds with two residues, Asp‐72 and Ser‐81. We earlier examined the waters present in the active‐site gorge in five crystal structures of TcAChE28; this water is conserved in all five structures, corresponding to H2O‐696 in the 2ACE apo TcAChE structure and H2O‐675 in the 1EA5, which is the highest resolution structure of apo TcAChE.68 In the MB‐AS/TcAChE structure, H2O‐603 is located at virtually the identical site to the homologous water in the other structures. Docking with Glide into the structure the MB‐AS/TcAChE structure from which MB had been removed but all the waters had been retained, or just H2O‐603, produced poses in which the MB went down to the bottom of the gorge, juxtaposed to Trp‐84, but aligned with the six‐member ring of the indole rather than the five‐member ring, thus avoiding H2O‐603 (not shown). We conjecture that this movement was permissible since there are significantly fewer waters observed in the MB‐AS/TcAChE structure than in the MB‐PEG/TcAChE structure. It should be noted that both in the DECA‐PEG/TcAChE [5E2I] and the DECA‐AS/TcAChE [5E4J] structures the same conserved water is seen, as H2O‐2026 and H2O‐2016, respectively.
Table 1 shows that whereas MB makes its closest contact with CD1 of Trp84 in the MB‐AS/TcAChE structure, DECA makes its closest contact with CE3 in the DECA‐AS/TcAChE structure. Figure 11 clarifies this observation. Whereas MB, which is a rigid molecule, is tethered at its upper extremity by a π‐cation interaction with the six‐membered ring of the indole of Trp279, which allows it to reach down only as far as the five‐membered ring of the indole of Trp84, DECA, which is both longer and more flexible, aligns along the surface of the indole of Trp84, and its quaternary group makes a π‐cation interaction with the more distal five‐membered ring of the indole moiety.
Figure 11.
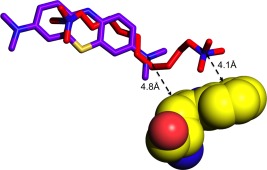
Interactions of MB and DECA with the indole moiety of Trp84 in their complexes with TcAChE in crystals obtained using AS as the precipitant. The indole of Trp84 is displayed in space‐filling mode, with carbon atoms colored yellow. MB and DECA are depicted as stick models, with their carbon atoms in cyan and magenta, respectively. Whereas the proximal quaternary group of MB in MB‐AS/TcAChE interacts with the five‐membered ring of the indole, in the DECA‐AS/TcAChE structure, the DECA extends further, such that its proximal quaternary group interacts with the indole's six‐membered ring.
Our findings clearly show that it is crucial, when seeking possible lead compounds using docking to an experimental crystal structure, to know the crystallization conditions employed. Furthermore, the conditions required to crystallize a protein may not be the same as those employed in the biological assay. These may affect the reliability of the rationalization and prediction of structural‐activity relationship from protein–ligand complexes. The influence of the crystallization conditions is usually not considered in rational drug design, but our observations clearly highlight its importance. In the case of the MB‐PEG/TcAChE complex, the three ethylene glycol oligomers present in the active‐site gorge, which were not initially assigned,35 indeed induce a substantial change in the position of the MB molecule relative to its position in the MB‐PEG/TcAChE complex, and the same is true for the corresponding pair of DECA/TcAChE complexes. The spectroscopic studies provide direct evidence that in solution the location of the MB within the gorge is affected by PEG200, but not by AS.
As mentioned in the Introduction, polyethylene glycols are widely employed as precipitants for protein crystallization, and over 3000 crystal structures have been deposited in the PDB in which one or more ethylene glycol oligomers have been identified. Many proteins display shallow and exposed ligand‐binding sites. Although AChE displays unique characteristics in terms of its long and narrow active‐site gorge, with its predominantly aromatic coating, many other proteins display structural elements in which precipitants, such as ethylene glycol oligomers, might lodge, as we have shown to be the case for AChE. Thus, molecular tunnels or channels are seen in such diverse enzymes as tryptophan synthase69 and catalase.70 Both the inner and outer vestibules of ion and voltage‐gated channels,71, 72 as well as the crevices around the pores of potassium and sodium channels,71, 73 might also be occupied by ethylene glycol oligomers, or by other precipitants, in place of, or alongside, channel blockers, or functional activators and inhibitors.
It is plausible that in other cases, too, the failure to take into account the presence of ethylene glycol oligomers in a binding site within a crystal structure will result in assignment of incorrect poses in docking studies; this, in turn, may result in selection of incorrect lead compounds for drug discovery.
Thus, provision of a more complete and accurate description of the crystallization conditions, and careful assignment of solvent molecules, whether waters, ethylene glycol oligomers or other species, is crucial for users of the PDB. We, therefore, encourage both the PDB and the depositors of structures to ensure that these descriptions are indeed as complete and accurate as possible.
Materials and Methods
Materials
TcAChE was the dimeric (G2) glycosylphosphatidylinositol‐anchored form from T californica electric organ tissue, purified by affinity chromatography subsequent to solubilization with phosphatidylinositol‐specific phospholipase C,40 as described earlier.74 Concentrations of stock solutions were determined by titration with paraoxon (O,O‐diethyl‐O‐[4‐nitrophenyl]phosphate.75 MB was obtained from Merck KGaA (Darmstadt, Germany), and recrystallized from ethyl acetate. ATC, 5,5′‐dithiobis‐(2‐nitrobenzoic acid) (DTNB), decamethonium bromide (DECA), sodium azide, diethyleneglycol, 2‐(N‐morpholino)ethanesulfonic acid (MES), paraoxon, ammonium sulfate (AS), and bovine serum albumin were purchased from Sigma (St. Louis, MO). PEG200 was purchased from Hampton Research (Aliso Viejo, CA).
Data mining of the PDB
A local copy of the PDB (retrieved on November 17, 2015) was scanned for entries that mentioned “PEG” or “polyethylene glycol” in the crystallization conditions (REMARK 280). PDB entries that had ethylene glycol oligomers modeled explicitly were retrieved by scanning the FORMUL records for mention of ethylene glycol oligomers of different sizes. In order of increasing size these were PEG, PGE, PG4, 1PE, P6G, P33, PE8, 2PE, XPE, 12P, 33O, and P3E. The returned list was supplemented by PDB entries in which polyethylene glycol was represented by two or more 1,2‐ethanediol molecules (EDO in PDB nomenclature) that were covalently linked. These entries were retrieved by scanning the LINK records in the PDB. The PDB entries that had modeled ethylene glycol oligomers without any mention of “PEG” in the crystallization conditions were further investigated by manually checking the REMARK 280 records. This provided a sanity check for the automated data mining. We purposely excluded individual EDO molecules from our data scanning procedure, because they can represent breakdown products of PEG oligomers or partially disordered PEG oligomers, as well as 1,2‐ethanediol added, as such, as a crystallization agent. We opted, therefore, for slightly underestimating the frequency of modeling PEG oligomers explicitly rather than (potentially severely) overestimating it.
Crystallization and production of complexes
Trigonal crystals of the MB/TcAChE complex (denoted as MB‐PEG/TcAChE crystals) were obtained utilizing native crystals that formed using PEG200 as the precipitant. The native crystals were generated as described previously, using 46% PEG200 (v/v) in 100 mM NaCl/100 mM MES, pH 6.5. Crystals of the complex were then obtained by soaking crystals in 2 μL of 20 mM MB in the mother liquor for 20 h at 4°C.35
Trigonal crystals of the DECA/TcAChE complex that utilized AS as the precipitant (denoted as DECA‐AS/TcAChE crystals) were obtained as follows: As for crystallization of native TcAChE using PEG200 as the precipitant, the enzyme was eluted from the affinity column using 50 mM tetramethylammonium bromide (TMA) in 100 mM NaCl/10 mM Tris, pH 8.0, and dialyzed against 100 mM NaCl/1 mM MES, pH 6.5. It was then concentrated to 23 mg/mL in an Amicon Ultra‐4 Centrifugal Filter Unit equipped with an Ultracel‐30 membrane, diluted 1:1 with 20 mM DECA in the MES buffer, and stored at 4°C. Crystallization was by the hanging drop vapor diffusion method, at 4°C, utilizing as the precipitant 60‐69% AS/360 mM Na,K phosphate/100 mM Na phosphate, pH 6.1‐7.1.
Trigonal crystals of the MB/TcAChE complex that utilized AS as the precipitant (denoted as MB‐AS/TcAChE crystals) were obtained as follows: DECA‐AS/TcAChE crystals, obtained as described above, were first washed with mother liquor to get rid of excess DECA, and then soaked in 2 μL of 2.5 mM MB in mother liquor for 20 h at 4°C.
Trigonal crystals of the DECA/TcAChE complex that utilized PEG200 as the precipitant (denoted as DECA‐PEG/TcAChE crystals) were obtained as follows: Crystals of the native enzyme obtained using PEG200 as the precipitant were soaked in 2 μL of 2.5 mM DECA in mother liquor for 20 h at 4°C.
X‐ray data collection
Information concerning data collection for four datasets is displayed in Table 4:
Table 4.
X‐ray Data Collection Statistics
| MB‐PEG/TcAChE | MB‐AS/TcAChE | DECA‐PEG/TcAChE | DECA‐AS/TcAChE | |
|---|---|---|---|---|
| PDB Code | 5E4T a | 5DLP | 5E2I | 5E4J |
| Crystallization conditions |
60% AS 0.36M Na/K phosphate 0.1M phosphate, pH 7.1 |
30% PEG 200 0.1M MES, pH 5.6 |
60% AS 0.36M Na/K phosphate 0.1M phosphate, pH 6.5 |
|
| Data collection | ||||
| Beam line | home sourceb | PXII SLS | ID14‐4 ESRF | ID23‐1 ESRF |
| Space group | P3121 | P3121 | P3121 | P3121 |
| Cell dimensions:a, b, c (Å) | 111.1, 111.4, 137.1 | 111.1, 111.1, 137.2 | 112.6, 112.6, 136.9 | 111.2, 111.2, 137.0 |
| Resolution (Å) | 30‐2.43 | 45.4‐2.70 | 45.9‐2.65 | 50.0‐2.54 |
| Upper resolution shell (Å) | 2.52‐2.43 | 2.85‐2.70 | 2.79‐2.65 | 2.68‐2.54 |
| Measured reflections | 848,294 | 172,120 | 307,800 | 224,993 |
| Unique reflections | 35,368 | 27,016 | 29,664 | 32,976 |
| Completeness (%)c | 99.9 (97.2) | 98.9 (98.9) | 99.9 (100.0) | 99.8 (100.0) |
| Average I/σ(I) | 34.8 (5.6) | 6.4 (6.8) | 4.5 (1.3) | 3.5 (1.2) |
| Rsym (I) (%) | 5.6 (39.4) | 10.4 (64.3) | 11.1 (40.0) | 14.6 (56.2) |
Data collected previously35.
Rigaku RU‐H3R.
Values in parentheses refer to the data of the corresponding upper resolution shell.
* For crystals of the MB‐PEG/TcAChE complex obtained using PEG200 as the precipitant (5E4T), data were collected earlier, “in‐house,” at 120 K, using as the X‐ray source a RIGAKU RU‐H3R running at 50 kV/100 mA with Osmic blue confocal optics,35 that is, the same data as for 2W9I.
* For crystals of the MB‐AS/TcAChE complex obtained using AS as the precipitant (5DLP), data were collected on beamline PXII of the Swiss Light Source (SLS), at Villigen, Switzerland.
* For crystals of the DECA‐PEG/TcAChE complex obtained using PEG200 as the precipitant (5E2I), data were collected on beamline ID14‐4 of the European Synchrotron Radiation Facility (ESRF), at Grenoble, France.
* For crystals of the DECA‐AS/TcAChE complex obtained using AS as the precipitant (5E4J), data were collected on beamline ID23‐1 at the ESRF.
Data processing
The diffraction images for the new datasets were indexed and integrated using MOSFLM76; the integrated reflections were scaled using the SCALA program.77 The data used for the 5E4T dataset were those processed earlier to obtain the 2W9I dataset.35 Structure factor amplitudes were calculated using TRUNCATE from the CCP4 program suite. Details of data processing and refinement are displayed in Table 5.
Table 5.
Refinement Statistics
| MB‐PEG/TcAChE | MB‐AS/TcAChE | DECA‐PEG/TcAChE | DECA‐AS/TcAChE | |
|---|---|---|---|---|
| PDB Code | 5E4T | 5DLP | 5E2I | 5E4J |
| No. of reflections (I/σ(I) >0 | 35,110 | 25,658 | 28,130 | 31,097 |
| Number of reflections in test set | 1909 | 1356 | 1496 | 1656 |
| R‐working (%)/R‐free | 17.3/20.6 | 19.2/22.4 | 19.6/22.6 | 19.1/22.9 |
| Number of protein atoms | 4709 | 4388 | 4351 | 4362 |
| Number of ligands | MB | MB | DECA | DECA |
| 9 EDOa | 15 SO4 | 2 PEG | 10 SO4 | |
| 12 PEGb | 4 NAG | 2 NAG | 4 NAG | |
| 5 PGEc | 2 MAN | 2 MAN | ||
| 5 NAGd | 1 BMA | 1 BMA | ||
| 3 MANe | 1 FUC | |||
| 2 BMAf | ||||
| 1 FUCg | ||||
| Number of water molecules | 167 | 15 | 48 | 15 |
| Overall average B factor (Å2) | 34.9 | 35.0 | 28.9 | 33.5 |
| Root mean square deviations: | ||||
| bond lengths (Å) | 0.005 | 0.007 | 0.006 | 0.007 |
| bond angles (o) | 1.09 | 1.20 | 1.29 | 1.39 |
| Ramachandran Plot | ||||
| Most favored (%) | 96.4 | 96.0 | 95.6 | 95.3 |
| Additionally allowed (%) | 3.6 | 3.5 | 4.1 | 4.1 |
| Disallowed (%) | 0.0 | 0.2 | 0.2 | 0.2 |
EDO ‐ 1,2‐ethanediol.
PEG ‐ diethylene glycol.
PGE ‐ triethylene glycol.
NAG ‐ N‐acetyl‐d‐glucosamine.
MAN ‐ α‐d‐mannose.
BMA ‐ β‐d‐mannose.
FUC ‐ α‐l‐fucose.
Structure determination and refinement
The structures were solved by molecular replacement with PHASER,78 using as a starting model the previously solved trigonal crystal form of the MB/TcAChE complex (PDB code 2W9I), excluding water molecules, carbohydrates and MB. All steps of refinement were performed with the CCP4/REFMAC program.79
Initial 2Fo‐Fc and Fo‐Fc electron density maps were calculated, and the initial Fo‐Fc maps were used, with the aid of the program COOT,80 to fit MB, DECA, PEG, AS, and water molecules into positive density. PEG200 is a heterogeneous oligomer whose average molecular weight is 200. Since the molecular weight of a PEG tetramer, HO[CH2CH2O]4H, is 194, the average length of the species in this heterogeneous mixture thus approximates a tetramer. In the MB‐PEG/TcAChE structure the ethylene glycol oligomers were modeled as monomers (EDO), dimers (PEG) and trimers (PGE), and in the DECA‐PEG/TcAChE structure as dimers (PEG). For the new MB‐PEG/TcAChE structure (5E4T) the original model was re‐refined and rebuilt with PDB_REDO.81 This was followed by several rounds of manual rebuilding in COOT80 guided by validation results from WHAT_CHECK82 and MolProbity,83 and refinement in REFMAC79 using the refinement parameters obtained from PDB_REDO.
Refinement steps were accepted only when they produced a decrease in the R‐free value. The various final TcAChE models were evaluated with PROCHECK.84 Details of the refinement statistics for the crystal structures of the various complexes are shown in Table 5. The coordinates of the MB‐PEG/TcAChE, MB‐AS/TcAChE, DECA‐PEG/TcAChE, and DECA‐AS/TcAChE complexes were deposited in the Protein Data Bank under PDB codes: 5E4T, 5DLP, 5E2I, and 5E4J, respectively.
Kinetic studies
Enzymatic activity of TcAChE, and inhibition constants of precipitants and ligands, were determined colorimetrically by the Ellman procedure, using acetylthiocholine as the substrate.45
Spectroscopy
Spectroscopic measurements utilized a Uvikon 940 spectrophotometer (Kontron AG, Munich, Germany), and were performed in 0.1 M NaCl/10 mM sodium phosphate, pH 7.0, at room temperature.
Calorimetry
The calorimetric experiments were performed on a MicroCal MC‐2D differential scanning microcalorimeter (MicroCal Inc., Northampton, MA) with cell volumes of 1.22 mL, interfaced with an IBM‐compatible personal computer, as described previously.35 Before measurement, sample and reference solutions were degassed in an evacuated chamber for 5 min at room temperature, and carefully loaded into the cells to avoid bubble formation. Exhaustive cleaning of the cells was undertaken before each experiment. An overpressure of 2 atm of dry nitrogen was maintained over the sample solutions throughout the scans to prevent any degassing during heating. A background scan collected with a buffer in both cells was subtracted from each scan. Reversibility of the thermal transition was checked by performing the scan a second time, immediately after the sample had cooled subsequent to the first scan. The experimental calorimetric traces were corrected for the effect of instrument response time.85 The excess heat capacity functions were plotted after normalization (M = 65,000 g/mol of monomer) and chemical baseline subtraction, using the Windows‐based software package (Origin) supplied by MicroCal. As in our earlier studies on TcAChE,35, 40, 41, 86 only one model was considered in analyzing the data. This is an irreversible, kinetically controlled two‐state model in which only the native state and the final (irreversibly denatured) state are significantly populated, and conversion from the native to the denatured state is determined by a strongly temperature‐dependent, first‐order rate constant (k); this rate constant is given by the Arrhenius equation:
| (1) |
where R is the gas constant, E A is the activation energy of the denaturation process, and T* is the temperature at which k = 1 min− 1. For this case, the excess heat capacity, , is given by the following equation43:
| (2) |
where ν = dT/dt (K/min) is the scan rate, and ΔH is the enthalpy difference between the denatured and native states.
Thus, the thermal denaturation of TcAChE can be described by a first‐order reaction. It can also be analyzed by use of the rate equation derived on the basis of conventional transition state theory.44 According to this theory, the rate constant is given by:
| (3) |
where k B is the Boltzmann constant, h is the Planck constant, and ΔS #, ΔH #, and ΔG# are, respectively, the entropy, enthalpy, and standard molar Gibbs free energy of activation.
Docking protocols
The molecular docking program, Glide (Grid‐based Ligand Docking with Energetics, Schrödinger, LLC, New York, NY, version Maestro 10.4.018, release 2015‐4),49 −51 was used for docking ligands into the active‐site gorge of TcAChE.
For preparation of the protein structures examined, the default values for all the parameters were taken using the Protein Preparation Wizard in Schrödinger's Maestro suite. The procedure included: (i) addition of hydrogen atoms; (ii) assignment of atomic charges; (iii) assignment of bond orders and ionization states.
Ligand preparation of MB utilized the default values of the LigPrep module in Schrödinger's Maestro suite to attach the appropriate partial charges to each atom. However, so as to maintain its planarity, every atom type had to be carefully checked. In particular, the two N(CH3)2 groups had to be specifically defined as aromatic so that they would remain in the plane of the aromatic rings to which they were attached during the docking protocol.
The XP (extra precision) docking option of Glide was employed. The docking ligand was confined to a 20‐Å cube centered on the center of mass of MB, but the ligand was removed prior to docking. The “rigid ligand” option was used throughout the docking procedure so as to maintain the planarity of the ligand.
Acknowledgments
We are grateful to the Israel Structural Proteomics Centre for access to its protein crystallization facilities, and to the staffs of the European Synchrotron Radiation Facility (ESRF) and the Swiss Light Source (SLS) for providing efficient help during data collection. V.S. acknowledges travel support from the Kimmelman Center for the Study of Biomolecular Structure and Assembly. We thank Drs. David Goodsell and Arthur Olson for discussions of docking protocols, and Dr. Alexander Berchansky for critically reading this manuscript and for preparation of the interactive 3D Complement page in Proteopedia, http://proteopedia.org/w/Journal:Protein_Science:2.
Orly Dym and Wanling Song contributed equally to this work.
This article is dedicated to the memory of Dr. Clifford Felder (1953–2013).
References
- 1. Taylor P, Anticholinesterase agents In: Brunton LL, Chabner BA, Knollmann BC, Eds. (2011) The pharmacological basis of therapeutics, 9th Ed, Vol.15 New York: McGraw‐Hill, pp 239–254. [Google Scholar]
- 2. Greenblatt HM, Dvir H, Silman I, Sussman JL (2003) Acetylcholinesterase: a multifaceted target for structure‐based drug design of anticholinesterase agents for the treatment of Alzheimer's disease. J Mol Neurosci 20:369–384. [DOI] [PubMed] [Google Scholar]
- 3. Millard CB, Broomfield CA (1995) Anticholinesterases: medical applications of neurochemical principles. J Neurochem 64:1909–1918. [DOI] [PubMed] [Google Scholar]
- 4. Casida JE, Durkin KA (2013) Anticholinesterase insecticide retrospective. Chem Biol Interact 203:221–225. [DOI] [PMC free article] [PubMed] [Google Scholar]
- 5. Li WM, Kan KK, Carlier PR, Pang YP, Han YF (2007) East meets West in the search for Alzheimer's therapeutics ‐ novel dimeric inhibitors from tacrine and huperzine A. Curr Alzheimer Res 4:386–396. [DOI] [PubMed] [Google Scholar]
- 6. Bermudez‐Lugo JA, Rosales‐Hernandez MC, Deeb O, Trujillo‐Ferrara J, Correa‐Basurto J (2011) In silico methods to assist drug developers in acetylcholinesterase inhibitor design. Curr Med Chem 18:1122–1136. [DOI] [PubMed] [Google Scholar]
- 7. Rampa A, Belluti F, Gobbi S, Bisi A (2011) Hybrid‐based multi‐target ligands for the treatment of Alzheimer's disease. Curr Top Med Chem 11:2716–2730. [DOI] [PubMed] [Google Scholar]
- 8. Rosini M, Simoni E, Minarini A, Melchiorre C (2014) Multi‐target design strategies in the context of Alzheimer's disease: acetylcholinesterase inhibition and NMDA receptor antagonism as the driving forces. Neurochem Res 39:1914–1923. [DOI] [PubMed] [Google Scholar]
- 9. Sussman JL, Harel M, Frolow F, Oefner C, Goldman A, Toker L, Silman I (1991) Atomic structure of acetylcholinesterase from Torpedo californica: a prototypic acetylcholine‐binding protein. Science 253:872–879. [DOI] [PubMed] [Google Scholar]
- 10. Morel N, Bon S, Greenblatt H, Wodak S, Sussman JL, Massoulié J, Silman I (1999) Effect of mutations in the peripheral anionic site on the stability of acetylcholinesterase. Mol Pharmacol 55:982–992. [DOI] [PubMed] [Google Scholar]
- 11. Greenblatt HM, Silman I, Sussman JL (2000) Structural studies on vertebrate and invertebrate acetylcholinesterases and their complexes with functional ligands. Drug Dev Res 50:573–583. [Google Scholar]
- 12. Dvir H, Silman I, Harel M, Rosenberry TL, Sussman JL (2010) Acetylcholinesterase: from 3D structure to function. Chem Biol Interact 187:10–22. [DOI] [PMC free article] [PubMed] [Google Scholar]
- 13. Bourne Y, Taylor P, Marchot P (1995) Acetylcholinesterase inhibition by fasciculin: crystal structure of the complex. Cell 83:503–512. [DOI] [PubMed] [Google Scholar]
- 14. Bourne Y, Taylor P, Radic Z, Marchot P (2003) Structural insights into ligand interactions at the acetylcholinesterase peripheral anionic site. Embo J 22:1–12. [DOI] [PMC free article] [PubMed] [Google Scholar]
- 15. Bourne Y, Radic Z, Taylor P, Marchot P (2010) Conformational remodeling of femtomolar inhibitor‐acetylcholinesterase complexes in the crystalline State. J Am Chem Soc 132:18292–19300. [DOI] [PMC free article] [PubMed] [Google Scholar]
- 16. Ekstrom F, Akfur C, Tunemalm AK, Lundberg S (2006) Structural changes of phenylalanine 338 and histidine 447 revealed by the crystal structures of tabun‐inhibited murine acetylcholinesterase. Biochemistry 45:74–81. [DOI] [PubMed] [Google Scholar]
- 17. Kryger G, Harel M, Giles K, Toker L, Velan B, Lazar A, Kronman C, Barak D, Ariel N, Shafferman A, and others (2000) Structures of recombinant native and E202Q mutant human acetylcholinesterase complexed with the snake‐venom toxin fasciculin‐II. Acta Crystallogr D Biol Crystallogr 56:1385–1394. [DOI] [PubMed] [Google Scholar]
- 18. Cheung J, Gary EN, Shiomi K, Rosenberry TL (2013) Structures of human acetylcholinesterase bound to dihydrotanshinone I and territrem B show peripheral site flexibility. ACS Med Chem Lett 4:1091–1096. [DOI] [PMC free article] [PubMed] [Google Scholar]
- 19. Kliachyna M, Santoni G, Nussbaum V, Renou J, Sanson B, Colletier JP, Arboleas M, Loiodice M, Weik M, Jean L, PY Renard, F Nachon, R Baati (2014) Design, synthesis and biological evaluation of novel tetrahydroacridine pyridine‐ aldoxime and ‐amidoxime hybrids as efficient uncharged reactivators of nerve agent‐inhibited human acetylcholinesterase. Eur J Med Chem 78:455–467. [DOI] [PubMed] [Google Scholar]
- 20. Harel M, Kryger G, Rosenberry TL, Mallender WD, Lewis T, Fletcher RJ, Guss JM, Silman I, Sussman JL (2000) Three‐dimensional structures of Drosophila melanogaster acetylcholinesterase and of its complexes with two potent inhibitors. Protein Sci 9:1063–1072. [DOI] [PMC free article] [PubMed] [Google Scholar]
- 21. Goodsell DS, Morris GM, Olson AJ (1996) Automated docking of flexible ligands: applications of AutoDock. J Mol Recognit 9:1–5. [DOI] [PubMed] [Google Scholar]
- 22. Cole JC, Murray CW, Nissink JW, Taylor RD, Taylor R (2005) Comparing protein‐ligand docking programs is difficult. Proteins 60:325–332. [DOI] [PubMed] [Google Scholar]
- 23. Colletier JP, Fournier D, Greenblatt HM, Stojan J, Sussman JL, Zaccai G, Silman I, Weik M (2006) Structural insights into substrate traffic and inhibition in acetylcholinesterase. Embo J 25:2746–2756. [DOI] [PMC free article] [PubMed] [Google Scholar]
- 24. Inestrosa NC, Alvarez A, Perez CA, Moreno RD, Vicente M, Linker C, Casanueva OI, Soto C, Garrido J (1996) Acetylcholinesterase accelerates assembly of amyloid‐beta‐peptides into Alzheimer's fibrils: possible role of the peripheral site of the enzyme. Neuron 16:881–891. [DOI] [PubMed] [Google Scholar]
- 25. Haviv H, Wong DM, Silman I, Sussman JL (2007) Bivalent ligands derived from Huperzine A as acetylcholinesterase inhibitors. Curr Top Med Chem 7:375–387. [DOI] [PubMed] [Google Scholar]
- 26. Pang Y‐P, Quiram P, Jelacic T, Hong F, Brimijoin S (1996) Highly potent, selective, and low cost bis‐tetrahydroaminacrine inhibitors of acetylcholinesterase. J Biol Chem 271:23646–23649. [DOI] [PubMed] [Google Scholar]
- 27. Weinstock M, Poltyrev T, Bejar C, Youdim MB (2002) Effect of TV3326, a novel monoamine‐oxidase cholinesterase inhibitor, in rat models of anxiety and depression. Psychopharmacology 160:318–324. [DOI] [PubMed] [Google Scholar]
- 28. Koellner G, Kryger G, Millard CB, Silman I, Sussman JL, Steiner T (2000) Active‐site gorge and buried water molecules in crystal structures of acetylcholinesterase from Torpedo californica . J Mol Biol 296:713–735. [DOI] [PubMed] [Google Scholar]
- 29. Greenblatt HM, Kryger G, Lewis T, Silman I, Sussman JL (1999) Structure of acetylcholinesterase complexed with (‐)‐galanthamine at 2.3Å resolution. FEBS Lett 463:321–326. [DOI] [PubMed] [Google Scholar]
- 30. Koellner G, Steiner T, Millard CB, Silman I, Sussman JL (2002) A neutral molecule in a cation‐binding site: specific binding of a PEG‐SH to acetylcholinesterase from Torpedo californica . J Mol Biol 320:721–725. [DOI] [PubMed] [Google Scholar]
- 31. Augustinsson K‐B (1950) Methylene blue as an inhibitor of acetylcholin‐esterase. Acta Chem Scand 4:536–542. [Google Scholar]
- 32. Küçükkilinç T, Ozer I (2007) Multi‐site inhibition of human plasma cholinesterase by cationic phenoxazine and phenothiazine dyes. Arch Biochem Biophys 461:294–298. [DOI] [PubMed] [Google Scholar]
- 33. Weiner L, Roth E, Silman I (2011) Targeted oxidation of Torpedo californica acetylcholinesterase by singlet oxygen. Photochem Photobiol 87:308–316. [DOI] [PubMed] [Google Scholar]
- 34. Triquigneaux MM, Ehrenshaft M, Roth E, Silman I, Ashani Y, Mason RP, Weiner L, Deterding LJ (2012) Targeted oxidation of Torpedo californica acetylcholinesterase by singlet oxygen: identification of N‐formylkynurenine tryptophan derivatives within the active‐site gorge of its complex with the photosensitizer methylene blue. Biochem J 448:83–91. [DOI] [PMC free article] [PubMed] [Google Scholar]
- 35. Paz A, Roth E, Ashani Y, Xu Y, Shnyrov VL, Sussman JL, Silman I, Weiner L (2012) Structural and functional characterization of the interaction of the photosensitizing probe methylene blue with Torpedo californica acetylcholinesterase. Protein Sci 21:1138–1152. [DOI] [PMC free article] [PubMed] [Google Scholar]
- 36. Wildman SA, Zheng X, Sept D, Auletta JT, Rosenberry TL, Marshall GR (2011) Drug‐like leads for steric discrimination between substrate and inhibitors of human acetylcholinesterase. Chem Biol Drug Des 78:495–504. [DOI] [PubMed] [Google Scholar]
- 37. Harel M, Schalk I, Ehret‐Sabatier L, Bouet F, Goeldner M, Hirth C, Axelsen P, Silman I, Sussman JL (1993) Quaternary ligand binding to aromatic residues in the active‐site gorge of acetylcholinesterase. Proc Natl Acad Sci USA 90:9031–9035. [DOI] [PMC free article] [PubMed] [Google Scholar]
- 38. Bar‐On P, Millard CB, Harel M, Dvir H, Enz A, Sussman JL, Silman I (2002) Kinetic and structural studies on the interaction of cholinesterases with the anti‐Alzheimer drug rivastigmine. Biochemistry 41:3555–3564. [DOI] [PubMed] [Google Scholar]
- 39. Kreimer DI, Shnyrov VL, Villar E, Silman I, Weiner L (1995) Irreversible thermal denaturation of Torpedo californica acetylcholinesterase. Protein Sci 4:2349–2357. [DOI] [PMC free article] [PubMed] [Google Scholar]
- 40. Weiner L, Shnyrov VL, Konstantinovskii L, Roth E, Ashani Y, Silman I (2009) Stabilization of Torpedo californica acetylcholinesterase by reversible inhibitors. Biochemistry 48:563–574. [DOI] [PubMed] [Google Scholar]
- 41. Millard CB, Shnyrov VL, Newstead S, Shin I, Roth E, Silman I, Weiner L (2003) Stabilization of a metastable state of Torpedo californica acetylcholinesterase by chemical chaperones. Protein Sci 12:2337–2347. [DOI] [PMC free article] [PubMed] [Google Scholar]
- 42. Sanchez‐Ruiz JM (1992) Theoretical analysis of Lumry‐Eyring models in differential scanning calorimetry. Biophys J 61:921–935. [DOI] [PMC free article] [PubMed] [Google Scholar]
- 43. Kurganov BI, Lyubarev AE, Sanchez‐Ruiz JM, Shnyrov VL (1997) Analysis of differential scanning calorimetry data for proteins. Criteria of validity of one‐step mechanism of irreversible protein denaturation. Biophys Chem 69:125–135. [DOI] [PubMed] [Google Scholar]
- 44. Lumry R, Eyring H (1954) Conformation changes of proteins. J Phys Chem 58:110–120. [Google Scholar]
- 45. Ellman GL, Courtney KD, Andres V, Featherstone RM (1961) A new and rapid colorimetric determination of acetylcholinesterase activity. Biochem Pharmacol 7:88–95. [DOI] [PubMed] [Google Scholar]
- 46. Morris GM, Goodsell DS, Halliday RS, Huey R, Hart WE, Belew RK, Olson AJ (1998) Automated docking using a Lamarckian genetic algorithms and empirical binding free energy function. J Comput Chem 19:1639–1662. [Google Scholar]
- 47. Trott O, Olson AJ (2010) AutoDock Vina: improving the speed and accuracy of docking with a new scoring function, efficient optimization, and multithreading. J Comput Chem 31:455–461. [DOI] [PMC free article] [PubMed] [Google Scholar]
- 48. Hawkins PC, Skillman AG, Nicholls A (2007) Comparison of shape‐matching and docking as virtual screening tools. J Med Chem 50:74–82. [DOI] [PubMed] [Google Scholar]
- 49. Friesner RA, Banks JL, Murphy RB, Halgren TA, Klicic JJ, Mainz DT, Repasky MP, Knoll EH, Shelley M, Perry JK, DE Shaw, P Francis, PS Shenkin, (2004) Glide: A new approach for rapid, accurate docking and scoring. 1. Method and assessment of docking accuracy. J Med Chem 47:1739–1749. [DOI] [PubMed] [Google Scholar]
- 50. Friesner RA, Murphy RB, Repasky MP, Frye LL, Greenwood JR, Halgren TA, Sanschagrin PC, Mainz DT (2006) Extra precision glide: docking and scoring incorporating a model of hydrophobic enclosure for protein‐ligand complexes. J Med Chem 49:6177–6196. [DOI] [PubMed] [Google Scholar]
- 51. Halgren TA, Murphy RB, Friesner RA, Beard HS, Frye LL, Pollard WT, Banks JL (2004) Glide: A new approach for rapid, accurate docking and scoring. 2. enrichment factors in database screening. J Med Chem 47:1750–1759. [DOI] [PubMed] [Google Scholar]
- 52. Repasky MP, Murphy RB, Banks JL, Greenwood JR, Tubert‐Brohman I, Bhat S, Friesner RA (2012) Docking performance of the glide program as evaluated on the Astex and DUD datasets: a complete set of glide SP results and selected results for a new scoring function integrating WaterMap and glide. J Comput Aided Mol Des 26:787–799. [DOI] [PubMed] [Google Scholar]
- 53. Kuznetsov YG, Day J, Newman R, McPherson A (2000) Chimeric human‐simian anti‐CD4 antibodies form crystalline high symmetry particles. J Struct Biol 131:108–115. [DOI] [PubMed] [Google Scholar]
- 54. Jones G, Willett P, Glen RC, Leach AR, Taylor R (1997) Development and validation of a genetic algorithm for flexible docking. J Mol Biol 267:727–748. [DOI] [PubMed] [Google Scholar]
- 55. Raves ML, Harel M, Pang Y‐P, Silman I, Kozikowski AP, Sussman JL (1997) 3D structure of acetylcholinesterase complexed with the nootropic alkaloid, (‐)‐huperzine A. Nat Struct Biol 4:57–63. [DOI] [PubMed] [Google Scholar]
- 56. Fischer M, Coleman RG, Fraser JS, Shoichet BK (2014) Incorporation of protein flexibility and conformational energy penalties in docking screens to improve ligand discovery. Nat Chem 6:575–583. [DOI] [PMC free article] [PubMed] [Google Scholar]
- 57. Michel J, Tirado‐Rives J, Jorgensen WL (2009) Energetics of displacing water molecules from protein binding sites: consequences for ligand optimization. J Am Chem Soc 131:15403–15411. [DOI] [PMC free article] [PubMed] [Google Scholar]
- 58. Mattos C, Ringe D (2001) Proteins in organic solvents. Curr Opin Struct Biol 11:761–704. [DOI] [PubMed] [Google Scholar]
- 59. Kryger G, Silman I, Sussman JL (1999) Structure of acetylcholinesterase complexed with E2020 (Aricept®): implications for the design of new anti‐Alzheimer drugs. Structure 7:297–307. [DOI] [PubMed] [Google Scholar]
- 60. Harel M, Hyatt JL, Brumshtein B, Morton CL, Yoon KJ, Wadkins RM, Silman I, Sussman JL, Potter PM (2005) The crystal structure of the complex of the anticancer prodrug 7‐ethyl‐10‐[4‐(1‐piperidino)−1‐piperidino]‐carbonyloxycamptothecin (CPT‐11) with Torpedo californica acetylcholinesterase provides a molecular explanation for its cholinergic action. Mol Pharmacol 67:1874–1881. [DOI] [PubMed] [Google Scholar]
- 61. Millard CB, Kryger G, Ordentlich A, Greenblatt HM, Harel M, Raves ML, Segall Y, Barak D, Shafferman A, Silman I, JL Sussman (1999) Crystal structures of aged phosphonylated acetylcholinesterase: nerve agent reaction products at the atomic level. Biochemistry 38:7032–7039. [DOI] [PubMed] [Google Scholar]
- 62. Harel M, Hyatt JL, Brumshtein B, Morton CL, Wadkins RM, Silman I, Sussman JL, Potter PM (2005) The 3D structure of the anticancer prodrug CPT‐11 with Torpedo californica acetylcholinesterase rationalizes its inhibitory action on AChE and its hydrolysis by butyrylcholinesterase and carboxylesterase. Chem Biol Interact 157158:153–157. [DOI] [PubMed] [Google Scholar]
- 63. Harel M, Sonoda LK, Silman I, Sussman JL, Rosenberry TL (2008) Crystal structure of thioflavin T bound to the peripheral site of Torpedo californica acetylcholinesterase reveals how thioflavin T acts as a sensitive fluorescent reporter of ligand binding to the acylation site. J Am Chem Soc 130:7856–7861. [DOI] [PMC free article] [PubMed] [Google Scholar]
- 64. Eichler J, Anselment A, Sussman JL, Massoulie J, Silman I (1994) Differential effects of “peripheral” site ligands on Torpedo and chicken acetylcholinesterase. Mol Pharmacol 45:335–340. [PubMed] [Google Scholar]
- 65. Kramer RM, Shende VR, Motl N, Pace CN, Scholtz JM (2012) Toward a molecular understanding of protein solubility: increased negative surface charge correlates with increased solubility. Biophys J 102:1907–1915. [DOI] [PMC free article] [PubMed] [Google Scholar]
- 66. Felder CE, Botti SA, Lifson S, Silman I, Sussman JL (1997) External and internal electrostatic potentials of cholinesterase models. J Mol Graph Model 15:318–327. 335–337. [DOI] [PubMed] [Google Scholar]
- 67. Silman I, Sussman JL (2008) Acetylcholinesterase: how is structure related to function? Chem Biol Interact 175:3–10. [DOI] [PubMed] [Google Scholar]
- 68. Dvir H, Jiang HL, Wong DM, Harel M, Chetrit M, He XC, Tang XC, Silman I, Bai DL, Sussman JL (2002) X‐ray structures of Torpedo californica acetylcholinesterase complexed with (+)‐Huperzine A and (‐)‐Huperzine B: structural evidence for an active site rearrangement. Biochemistry 41:10810–10818. [DOI] [PubMed] [Google Scholar]
- 69. Huang X, Holden HM, Raushel FM (2001) Channeling of substrates and intermediates in enzyme‐catalyzed reactions. Annu Rev Biochem 70:149–180. [DOI] [PubMed] [Google Scholar]
- 70. Dominguez L, Sosa‐Peinado A, Hansberg W (2010) Catalase evolved to concentrate H2O2 at its active site. Arch Biochem Biophys 500:82–91. [DOI] [PubMed] [Google Scholar]
- 71. Choe S (2002) Potassium channel structures. Nat Rev Neurosci 3:115–121. [DOI] [PubMed] [Google Scholar]
- 72. Yu Y, Shi L, Karlin A (2003) Structural effects of quinacrine binding in the open channel of the acetylcholine receptor. Proc Natl Acad Sci USA 100:3907–3912. [DOI] [PMC free article] [PubMed] [Google Scholar]
- 73. Nguyen TP, Horn R (2002) Movement and crevices around a sodium channel S3 segment. J Gen Physiol 120:419–436. [DOI] [PMC free article] [PubMed] [Google Scholar]
- 74. Sussman JL, Harel M, Frolow F, Varon L, Toker L, Futerman AH, Silman I (1988) Purification and crystallization of a dimeric form of acetylcholinesterase from Torpedo californica subsequent to solubilization with phosphatidylinositol‐specific phospholipase C. J Mol Biol 203:821–823. [DOI] [PubMed] [Google Scholar]
- 75. Ralston JS, Rush RS, Doctor BP, Wolfe AD (1985) Acetylcholinesterase from fetal bovine serum: purification and characterization of soluble G4 Enzyme. J Biol Chem 260:4312–4318. [PubMed] [Google Scholar]
- 76. Leslie A, Powell H, Processing diffraction data with MOSFL In: Read RJ, Sussman J, Eds. (2007) Evolving methods for macromolecular crystallography, Vol.245 Dordrecht: Springer Netherlands, pp 41–51. [Google Scholar]
- 77. Evans P (2006) Scaling and assessment of data quality. Acta Crystallogr D Biol Crystallogr 62:72–82. [DOI] [PubMed] [Google Scholar]
- 78. McCoy AJ (2007) Solving structures of protein complexes by molecular replacement with Phaser. Acta Crystallogr. D Biol Crystallogr 63:32–41. [DOI] [PMC free article] [PubMed] [Google Scholar]
- 79. Murshudov G, Vagin A, Dodson E (1997) Refinement of macromolecular structures by the maximum‐likelihood method. Acta Crystallogr D Biol Crystallogr 53:240–255. [DOI] [PubMed] [Google Scholar]
- 80. Emsley P, Cowtan K (2004) Coot: model‐building tools for molecular graphics. Acta Crystallogr D Biol Crystallogr 60:2126–2132. [DOI] [PubMed] [Google Scholar]
- 81. Joosten RP, Joosten K, Cohen SX, Vriend G, Perrakis A (2011) Automatic rebuilding and optimization of crystallographic structures in the Protein Data Bank. Bioinformatics 27:3392–3398. [DOI] [PMC free article] [PubMed] [Google Scholar]
- 82. Hooft RWW, Vriend G, Sander C, Abola EE (1996) Errors in protein structures. Nature 381:272. [DOI] [PubMed] [Google Scholar]
- 83. Chen VB, Arendall WB, III , Headd JJ, Keedy DA, Immormino RM, Kapral GJ, Murray LW, Richardson JS, Richardson DC (2010) MolProbity: all‐atom structure validation for macromolecular crystallography. Acta Crystallogr D Biol Crystallogr 66:12–21. [DOI] [PMC free article] [PubMed] [Google Scholar]
- 84. Laskowski RA, MacArthur MW, Moss D, Thornton JM (1993) PROCHECK: a program to check the stereochemical quality of protein structures. J Appl Cryst 26:283–291. [Google Scholar]
- 85. Lopez Mayorga O, Freire E (1987) Dynamic analysis of differential scanning calorimetry data. Biophys Chem 27:87–96. [DOI] [PubMed] [Google Scholar]
- 86. Kreimer DI, Shin I, Shnyrov VL, Villar E, Silman I, Weiner L (1996) Two partially unfolded states of Torpedo californica acetylcholinesterase. Protein Sci 5:1852–1864. [DOI] [PMC free article] [PubMed] [Google Scholar]