

Abstract
Molecular dynamics (MD) simulations have become a central tool for investigating various biophysical questions with atomistic detail. While many different proxies are used to qualify MD force fields, most are based on largely structural parameters such as the root mean square deviation from experimental coordinates or nuclear magnetic resonance (NMR) chemical shifts and residual dipolar couplings. NMR derived Lipari–Szabo squared generalized order parameter (O 2) values of amide N—H bond vectors of the polypeptide chain were also often employed for refinement and validation. However, with a few exceptions, side chain methyl symmetry axis order parameters have not been incorporated into experimental reference sets. Using a test set of five diverse proteins, the performance of several force fields implemented in the NAMDD simulation package was examined. It was found that simulations employing explicit water implemented using the TIP3 model generally performed significantly better than those using implicit water in reproducing experimental methyl symmetry axis O 2 values. Overall the CHARMM27 force field performs nominally better than two implementations of the Amber force field. It appeared that recent quantum mechanics modifications to side chain torsional angles of leucine and isoleucine in the Amber force field have significantly hindered proper motional modeling for these residues. There remained significant room for improvement as even the best correlations of experimental and simulated methyl group Lipari–Szabo generalized order parameters fall below an R 2 of 0.8.
Keywords: protein motion, side chain motion, molecular dynamics, NMR relaxation, force field, accuracy
Introduction
All‐atom molecular dynamics (MD) simulations of biomolecules have undergone an explosion in popularity due to advances in computing power, computational efficiency, and the increasing accuracy of the force fields used.1, 2, 3 CHARMM4 and Amber5, 6 are two of the most widely used families of force fields for protein simulations. MD simulations using them have provided insights into a wide range of phenomena.1, 2, 3, 7 The utility of these types of applications rely significantly on the faithful reproduction of the dynamics. It is therefore essential to assess the accuracy of the force fields used in these applications, not just by structure‐based metrics such as root mean square deviation from static structural parameters determined by methods such as crystallography and nuclear magnetic resonance, but also by reproducing various attendant dynamical properties.5, 8, 9
Nuclear magnetic resonance (NMR) spectroscopy can provide a variety of dynamical measures with which to validate MD simulations on various timescales. On the short ps–ns timescale the Lipari–Szabo squared generalized order parameter (O 2)10 provides a direct site‐specific measure of motion. Historically, the experimentally obtained amide N—H bond vector O 2 parameter has been extensively used as a reference after the optimization of force fields. Such studies are numerous, and are therefore not the focus of the current investigation.5, 11, 12, 13 Curiously, the corresponding measure of the methyl group symmetry axis of methyl‐bearing amino acid side chains, which is measurable using NMR relaxation methods,14 has received relatively little attention in this regard. Protein side chain motions, as probed by the order parameter for the methyl symmetry axis, , display considerable heterogeneity, in both site‐to‐site variation within a given protein and as differences in average values between different proteins.15, 16 Historically, protein methyl values have been poorly replicated by MD, with R 2 values commonly less than 0.3.17 More recently, with improvements in force fields, simulation software, and greater computing power, much improved agreement is now apparently possible.15, 16, 18, 19, 20 An overall correlation values between simulation and experiment of R 2 approximately 0.7 currently represents the state of the art in this area. These results were achieved with a single force field, using a standard simulation protocol within the NAMD MD simulation package. Simulations of varying lengths from 100 ns to 1 μs gave comparable accuracy,15 indicating that simulations are not limited primarily by sampling or computational power. As NMR‐derived values report on motions approaching the tumbling time of the protein being observed (4—9 ns for the proteins in the current study), this is not a surprising result. It is, therefore, of interest to establish (i) how much error arises from the force field itself, and (ii) which of the commonly used variations in the CHARMM/Amber force fields best represent experimental values.
To facilitate this comparison, we used a subset of the proteins examined previously.15, 21 Cytochrome c2 from the previous test set was omitted because of concern that the heme cofactor parameters might not be as accurately known as the amino acid parameters, or not transferable. We also omitted one of the two calmodulin complexes so that each protein was represented once (Table 1). We examined the standard CHARMM and Amber protein force fields, each with implicit22 or explicit23 water models. In order to compare the recent updates to the Amber force field, we used both Amber94 as well as Amber12, which was chosen due to its incorporation of modifications from averaged NMR data2 as well as from quantum mechanical calculations for isoleucine, leucine, aspartic acid, and asparagine residues (as indicated by the suffix ILDN).6 It should be noted that Amber14 has recently replaced Amber12, although the force fields are very similar as Amber ff12 incorporates many of the changes present for ff14.13 These changes were, again, designed to optimize error functions against averaged NMR data as well as quantum mechanics simulations.13 values for all protein methyl groups were then calculated as described previously using the so‐called long‐time limit approximation15 and directly compared with those observed in solution NMR experiments.
Table 1.
Summary of Reference Proteins Used for Molecular Dynamics Simulations.
| Protein | Residues | PDB ID | Length (ns) | Explicit atoms | Temperature (°C) |
|---|---|---|---|---|---|
| ALBP | 131 | 1LIB | 30 | 13934 | 20 |
| α3D | 73 | 2A3D | 30 | 9714 | 30 |
| CaM‐smMLCKp | 167 | 1CDL | 30 | 18776 | 35 |
| HEWL | 129 | 1LZA | 30 | 14359 | 35 |
| Ubiquitin | 76 | 1UBQ | 30 | 10747 | 25 |
Protein abbreviations: ALBP, adipocyte lipid binding protein; CaM‐smMLCKp, calcium‐saturated calmodulin (CaM) complexed with a peptide from smooth muscle myosin light‐chain kinase calmodulin‐binding domain (smMLCKp); HEWL, hen egg white lysozyme. PDB ID corresponds to the starting structure used for each simulation. All proteins were simulated for 30 ns under five different force field conditions, described in the Methods section. The number of explicit atoms corresponds to the total number of atoms in the system for explicit water solvent simulations.
The correlations (reported as R 2 values) between each set of MD‐calculated values and their experimental counterparts are shown for each set of simulation parameters in Figure 1(A). As is readily apparent, the use of an implicit solvent model generally fails to adequately replicate motions present in proteins. While the CHARMM27 potential with implicit water can reproduce values for ubiquitin and α3D fairly well (R 2 = 0.58, 0.47, respectively), simulations of the other proteins gave R 2 values less than 0.35. The average R 2 value for all 5 proteins in CHARMM27 and Amber94 implicit water simulations, discounting ubiquitin, falls to 0.25 and 0.22, respectively. This is likely due to a lack of protein stability during simulation (Supporting Information Table 1), despite the fact that no other factors were changed aside from the water model. The explicit water simulations, on the other hand, are much better at consistently reproducing experimental values, with an average R 2 of 0.45 for CHARMM27 and 0.46 for Amber94. These conclusions are also borne out by the mean error for each protein in each force field [Fig. 1(B)].
Figure 1.
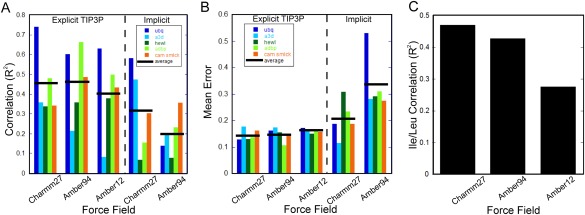
Correspondence between experimental O2 axis parameters and those derived from molecular dynamics simulations using various force fields. (A) Average correlation coefficients (R 2) for the five test proteins for the three force fields used in the simulations with explicit water and for the two used with implicit water. The mean for the five proteins in each case is shown as a horizontal black bar. (B) Mean deviations between experimental O2 axis values and those derived from molecular dynamics simulations using the various force fields and explicit water. (C) Ability of each of the explicit water simulations to reproduce experimental O 2 axis values for leucine and isoleucine methyl groups. The average R 2 values across each of the five test proteins are shown.
It is apparent that the experimental data for ubiquitin are better reproduced across different force fields than for other proteins. It has recently been suggested that reproduction of experimental values for ubiquitin is improved with increased simulation time.20 However, it takes more than 10‐fold longer—simulations of 100 ns or more—to increase from R 2 = 0.66 to R 2 = 0.85.15, 20 Increasing simulations to the μs timescale produces almost no further improvement in terms of either correlation or overall RMSD for both CHARMM27 and Amber ff99SB‐ILDN, although the precision of these values are better determined at longer timescales, as might be predicted due to increased averaging.20 However, for the other proteins in Table 1, increasing simulation length to 100 ns–1 us timescales does not result in as much improvement as measured by R 2. The cost/benefit ratio as a function of simulation time increases greatly beyond 100 ns. Apparently ubiquitin is somewhat of a special case, in terms of the ease with which different force fields reproduce experiment, and the moderate improvement for longer sampling. The individual correlation plots for ubiquitin simulations are shown in Supporting Information Figure S1. This highlights the importance of testing on a diverse set of proteins when comparing force fields or establishing sufficient simulation protocols.
Both CHARMM27 and Amber94/12 force fields used with an explicit water model are significantly better than their implicit water counterparts. Both CHARMM27 and Amber94 display similar average correlations, with Amber12 following closely behind. When 10 ns of simulation is analyzed, CHARMM27 displays an average R 2 value (∼0.47), while Amber94/12 do not reach this value until 30 ns. This seems consistent with recent findings that the CHARMM27 force field is capable of reaching higher correlations with experimental data at shorter simulation time compared with the Amber force field.20 This result applies across the five proteins considered here. α3D is another interesting case in that it represents the only protein of de novo design studied with this level of detail. Its motions are apparently properly modeled by the CHARMM27 force fields (both explicit and implicit water models), while Amber94/12 force fields perform poorly. When α3D is not included, Amber force fields actually display a better correlation with experimental data. While α3D is an NMR structure, versatility to starting coordinates is an important factor when evaluating force field accuracy; CHARMM27 appears capable of properly handling solution structures, while Amber ff12 does not.
The side chain torsional parameters for the residues leucine, isoleucine, aspartic acid, and asparagine were recently updated in the Amber12 force field.24 Two of these residues contain methyl groups, allowing us to test how well these modifications perform in accurately modeling the motions observed in solution NMR in comparison to previous force fields. The correlations to experimental O 2 values for isoleucine and leucine residues across all proteins are shown in Figure 1(C) for CHARMM27, Amber94, and Amber12 force fields with explicit water. Both CHARMM27 and Amber94 have R 2 values close to 0.45, while the modifications to the ILDN torsional angles in Amber12 (as well as other potential changes) have apparently decreased correlations with experiment for these residues to 0.28. Though these modifications are moderately better at replicating average NMR measurements derived from average structural properties such as scalar (J) couplings and residual dipolar couplings, this does not translate to more accurate representations of protein dynamics.
In summary, both CHARMM27 and Amber force fields achieve comparable accuracy though the former reaches its limiting accuracy at shorter simulation times. In order for simulations to properly model values, several conditions must be met. First, each force field must be able to maintain a stable structure. Second, the parameters must be correct to model both the magnitude of the size chain flucturations, and their time scale. When the first condition is not met, complete failure ensues (Supporting Information Fig. S1, ubiquitin with Amber94 in an implicit water model). Given a stable structure (Supporting Information Fig. S1, all other ubiquitin trajectories), differences in accuracy are presumably determined by subtle differences to side chain potentials. This result highlights the utility of direct optimization of force field parameters to NMR derived order parameters for side chains (as well as the backbone); in order to properly model protein motions, protein structural stability is a prerequisite. When the first half (15 ns) of the simulations are compared with the final results as a measure of the system convergence (Supporting Information Table 1), a minimum value of converge is necessary for the best correlations, but beyond an R 2 of approximately 0.75, convergence appears uncoupled from the final correlation; the most “converged” simulation is not the best at reproducing experiment, and several of the lowest accuracy simulations are more highly converged at 15 ns.
The timescale of internal protein motions that determine the values are on the order of the protein tumbling time or less (< ∼10 ns for the test proteins used here).10 One concludes that if simulations of much longer timeframe are required to match experimental data, then the dynamics are not being modeled realistically. Simulations of relatively short length should be able to properly model the motions observed by NMR, provided the total length is several fold longer than the observed side chain relaxation timescale, 10−11 to 10−8 s. Clearly, the relatively low correlation with experiment for non‐ubiquitin proteins indicates that much improvement is necessary for both force fields in order to accurately model protein dynamics more generally.
Methods
Simulations with explicit water used the TIP3P23 potential and a minimum distance of 8 Å of water box padding for all proteins. All other aspects of the simulations were performed as previously described,15 using a uniform simulation length of 30 ns. The only variable being the force field (either CHARMM27,4 Amber94,25 or Amber12 with ILDN modifications explicitly incorporated.24). Implicit water model simulations were carried out with either the CHARMM27 and the Amber94 force fields. The generalized Born solvent model of Bashford & Case22 within the NAMD2 simulation package26 was employed. Each simulation used an ion concentration of 0.3 and an alphaCutoff of 14. One fs timesteps were used with 1–4 scaling set to 1.0, a switchdist of 15.0, cutoff of 16.0, and pairlistdist of 17.5. All other parameters were kept constant across all simulations. All simulations were performed at the temperatures used for the NMR relaxation experiments.
Thirty ns simulations for each of five proteins (ubiquitin, α3D, ADBP, HEWL, and CaM‐smMLCKp [using protein chain B, the non‐crystallographic symmetry replica which contains the least missing atoms27]) under five different simulation conditions (CHARMM27 TIP3P, CHARMM27 Born Model, Amber94 TIP3P, Amber94 Born Model, and Amber12 TIP3P) were performed for a total of 750 ns of simulation time. Briefly, simulation snapshots were aligned following a rigid‐body Cα alignment protocol, and values were then calculated as previously described15 using the following equation28:
| (1) |
where x, y, and z are the Cartesian unit vector components of the methyl symmetry axis after the above rigid‐body alignment procedure. MD derived O 2 values were then compared with their available experimental counterparts.29, 30, 31, 32, 33 In this regard, it is useful to note that in our hands for force field and solvent treatments where the correlation with experiment is reasonable (R 2 ≥ 0.625), the truncated average approximation20 for calculating order parameters from trajectories produces somewhat poorer results than the long time approximation used here. When the agreement is worse, the truncated average approximation improves the correlation, but the agreement with experiment remains poor.
Supporting information
Supporting Information
References
- 1. Karplus M (2014) Development of multiscale models for complex chemical systems: from H+H‐2 to biomolecules. Angew Chem Intl Ed 53:9992–10005. [DOI] [PubMed] [Google Scholar]
- 2. Levitt M (2014) Birth and future of multiscale modeling for macromolecular systems. Angew Chem Intl Ed 53:10006–10018. [DOI] [PubMed] [Google Scholar]
- 3. Warshel A (2014) Multiscale modeling of biological functions: from enzymes to molecular machines. Angew Chem Intl Ed 53:10020–10031. [DOI] [PMC free article] [PubMed] [Google Scholar]
- 4. Brooks BR, Brooks CL, 3rd , Mackerell AD, Jr. , Nilsson L, Petrella RJ, Roux B, Won Y, Archontis G, Bartels C, Boresch S, Caflisch A, Caves L, Cui Q, Dinner AR, Feig M, Fischer S, Gao J, Hodoscek M, Im W, Kuczera K, Lazaridis T, Ma J, Ovchinnikov V, Paci E, Pastor RW, Post CB, Pu JZ, Schaefer M, Tidor B, Venable RM, Woodcock HL, Wu X, Yang W, York DM, Karplus M (2009) CHARMM: the biomolecular simulation program. J Comput Chem 30:154551. [DOI] [PMC free article] [PubMed] [Google Scholar]
- 5. Li D‐W, Brüschweiler R (2011) Iterative optimization of molecular mechanics force fields from NMR data of full‐length proteins. J Chem Theor Comp 7:1773–1782. [DOI] [PubMed] [Google Scholar]
- 6. Lindorff‐Larsen K, Piana S, Palmo K, Maragakis P, Klepeis JL, Dror RO, Shaw DE (2010) Improved side‐chain torsion potentials for the Amber ff99SB protein force field. Proteins 78:1950–1958. [DOI] [PMC free article] [PubMed] [Google Scholar]
- 7. Lindorff‐Larsen K, Piana S, Dror RO, Shaw DE (2011) How fast‐folding proteins fold. Science 334:517–520. [DOI] [PubMed] [Google Scholar]
- 8. Beauchamp KA, Lin YS, Das R, Pande VS (2012) Are protein force fields getting better? A systematic benchmark on 524 diverse NMR measurements. J Chem Theory Comput 8:1409–1414. [DOI] [PMC free article] [PubMed] [Google Scholar]
- 9. Piana S, Lindorff‐Larsen K, Shaw DE (2011) How robust are protein folding simulations with respect to force field parameterization? Biophys J 100:L47–L49. [DOI] [PMC free article] [PubMed] [Google Scholar]
- 10. Lipari G, Szabo A (1982) Model‐free approach to the interpretation of nuclear magnetic resonance relaxation in macromolecules. 1. Theory and range of validity. J Am Chem Soc 104:4546–4559. [Google Scholar]
- 11. Hornak V, Abel R, Okur A, Strockbine B, Roitberg A, Simmerling C (2006) Comparison of multiple Amber force fields and development of improved protein backbone parameters. Proteins 65:712–725. [DOI] [PMC free article] [PubMed] [Google Scholar]
- 12. Price DJ, Brooks CL 3rd (2002) Modern protein force fields behave comparably in molecular dynamics simulations. J Comput Chem 23:1045–1057. [DOI] [PubMed] [Google Scholar]
- 13. Maier JA, Martinez C, Kasavajhala K, Wickstrom L, Hauser KE, Simmerling C (2015) ff14SB: improving the accuracy of protein side chain and backbone parameters from ff99SB. J Chem Theory Comput 11:3696–3713. [DOI] [PMC free article] [PubMed] [Google Scholar]
- 14. Igumenova TI, Frederick KK, Wand AJ (2006) Characterization of the fast dynamics of protein amino acid side chains using NMR relaxation in solution. Chem Rev 106:1672–1699. [DOI] [PMC free article] [PubMed] [Google Scholar]
- 15. Kasinath V, Sharp KA, Wand AJ (2013) Microscopic insights into the NMR relaxation‐based protein conformational entropy meter. J Am Chem Soc 135:15092–15100. [DOI] [PMC free article] [PubMed] [Google Scholar]
- 16. Sharp KA, Kasinath V, Wand AJ (2014) Banding of NMR‐derived methyl order parameters: implications for protein dynamics. Proteins 82:2106–2117. [DOI] [PMC free article] [PubMed] [Google Scholar]
- 17. Krishnan M, Smith JC (2012) Reconstruction of protein side‐chain conformational free energy surfaces from NMR‐derived methyl axis order parameters. J Phys Chem B 116:4124–4133. [DOI] [PubMed] [Google Scholar]
- 18. Rajeshwar RT, Smith JC, Krishnan M (2014) Hidden regularity and universal classification of fast side chain motions in proteins. J Am Chem Soc 136:8590–8605. [DOI] [PubMed] [Google Scholar]
- 19. Long D, Li DW, Walter KF, Griesinger C, Bruschweiler R (2011) Toward a predictive understanding of slow methyl group dynamics in proteins. Biophys J 101:910–915. [DOI] [PMC free article] [PubMed] [Google Scholar]
- 20. Bowman GR (2015) Accurately modeling nanosecond protein dynamics requires at least microseconds of simulation. J Comput Chem 24:1999–2012. [DOI] [PubMed] [Google Scholar]
- 21. Sharp KA, O'Brien E, Kasinath V, Wand AJ (2015) On the relationship between NMR‐derived amide order parameters and protein backbone entropy changes. Proteins 83:922–930. [DOI] [PMC free article] [PubMed] [Google Scholar]
- 22. Bashford D, Case DA (2000) Generalized born models of macromolecular solvation effects. Annu Rev Phys Chem 51:129–152. [DOI] [PubMed] [Google Scholar]
- 23. Jorgensen WL, Chandrasekhar J, Madura JD, Impey RW, Klein ML (1983) Comparison of simple potential functions for simulating liquid water. J Chem Phys 79:926–935. [Google Scholar]
- 24. Case DA, Darden TE, Cheatham I, Simmerling CL, Wang J, Duke RE, Luo R, Walker RC, Zhang W, Merz KM, Roberts B, Hayik S, Roitberg A, Seabra G, Swails J, Götz AW, Kolossváry I, Wong KF, Paesani F, Vanicek J, Wolf RM, Liu J, Wu X, Bronzell SR, Steinbrecher T, Gohlke H, Cai Q, Ye X, Wand J, Hsieh MJ, Cui G, Roe DR, Mathews DH, Seetin MG, Salomon‐Ferrer R, Sagui C, Babin V, Luchko T, Gusarov S, Kovalenko A, Kollman PA (2012) AMBER 12. San Francisco: University of California. [Google Scholar]
- 25. Cornell WD, Cieplak P, Gould IR, Merz KM, Ferguson DM, Spellmeyer DC, Fox T, Caldwell JW, Kollman P (1995) A second generation force field for the simulation of proteins, nucleic acids, and organic molecules. J Am Chem Soc 117:5179–5197. [Google Scholar]
- 26. Phillips JC, Braun R, Wang W, Gumbart J, Tajkhorshid E, Villa E, Chipot C, Skeel RD, Kale L, Schulten K (2005) Scalable molecular dynamics with NAMD. J Comput Chem 26:1781–1802. [DOI] [PMC free article] [PubMed] [Google Scholar]
- 27. Prabhu NV, Lee AL, Wand AJ, Sharp KA (2003) Dynamics and entropy of a calmodulin‐peptide complex studied by NMR and molecular dynamics. Biochemistry 42:562–570. [DOI] [PubMed] [Google Scholar]
- 28. Chatfield DC, Szabo A, Brooks BR (1998) Molecular dynamics of staphylococcal nuclease: comparison of simulation with N‐15 and C‐13 NMR relaxation data. J Am Chem Soc 120:5301–5311. [Google Scholar]
- 29. Constantine KL, Friedrichs MS, Wittekind M, Jamil H, Chu CH, Parker RA, Goldfarb V, Mueller L, Farmer BT 2nd (1998) Backbone and side chain dynamics of uncomplexed human adipocyte and muscle fatty acid‐binding proteins. Biochemistry 37:7965–7980. [DOI] [PubMed] [Google Scholar]
- 30. Lee AL, Flynn PF, Wand AJ (1999) Comparison of H‐2 and C‐13 NMR relaxation techniques for the study of protein methyl group dynamics in solution. J Am Chem Soc 121:2891–2902. [Google Scholar]
- 31. Walsh STR, Lee AL, DeGrado WF, Wand AJ (2001) Dynamics of a de novo designed three‐helix bundle protein studied by N‐15, C‐13, and H‐2 NMR relaxation methods. Biochemistry 40:9560–9569. [DOI] [PubMed] [Google Scholar]
- 32. Frederick KK, Marlow MS, Valentine KG, Wand AJ (2007) Conformational entropy in molecular recognition by proteins. Nature 448:325–329. [DOI] [PMC free article] [PubMed] [Google Scholar]
- 33. Moorman VR, Valentine KG, Wand AJ (2012) The dynamical response of hen egg white lysozyme to the binding of a carbohydrate ligand. Protein Sci 21:1066–1073. [DOI] [PMC free article] [PubMed] [Google Scholar]
Associated Data
This section collects any data citations, data availability statements, or supplementary materials included in this article.
Supplementary Materials
Supporting Information