

Summary
Background
Accurate prediction of future patient census in hospital units is essential for patient safety, health outcomes, and resource planning. Forecasting census in the Neonatal Intensive Care Unit (NICU) is particularly challenging due to limited ability to control the census and clinical trajectories. The fixed average census approach, using average census from previous year, is a forecasting alternative used in clinical practice, but has limitations due to census variations.
Objective
Our objectives are to: (i) analyze the daily NICU census at a single health care facility and develop census forecasting models, (ii) explore models with and without patient data characteristics obtained at the time of admission, and (iii) evaluate accuracy of the models compared with the fixed average census approach.
Methods
We used five years of retrospective daily NICU census data for model development (January 2008 – December 2012, N=1827 observations) and one year of data for validation (January – December 2013, N=365 observations). Best-fitting models of ARIMA and linear regression were applied to various 7-day prediction periods and compared using error statistics.
Results
The census showed a slightly increasing linear trend. Best fitting models included a non-seasonal model, ARIMA(1,0,0), seasonal ARIMA models, ARIMA(1,0,0)x(1,1,2)7 and ARIMA(2,1,4)x(1,1,2)14, as well as a seasonal linear regression model. Proposed forecasting models resulted on average in 36.49% improvement in forecasting accuracy compared with the fixed average census approach.
Conclusions
Time series models provide higher prediction accuracy under different census conditions compared with the fixed average census approach. Presented methodology is easily applicable in clinical practice, can be generalized to other care settings, support short- and long-term census forecasting, and inform staff resource planning.
Keywords: Forecasting, Neonatal Intensive Care Units, time series analysis
1. Background
Accurately measuring number of patients, i.e., census, and its attributes at past, present, and future points in time is of great interest for health care systems to offer adequate and safe patient care supported by appropriate resource planning. Hospital unit-level census is impacted by patient flow and clinical trajectories which can change dynamically over time. Understanding census variability and seasonality has implications for administrative and clinical decisions in hospital settings, e.g., nurse-to-patient ratios and bed management decisions. Inaccurate census prediction may result in suboptimal allocation of limited personnel and resources, e.g., poor nurse staffing levels. Suboptimal nurse staffing levels have been associated with decrease in quality of care and patient safety due to over- or understaffing (e.g., infections) [1–3], and decrease in patient and staff satisfaction [1–5]. Increasing numbers of patients to nurses has been shown to increase the risk of emotional exhaustion and job dissatisfaction [6]. Low nurse-to-patient ratios have been associated with increased adverse patient outcomes, such as increased 30-day mortality and failure to rescue [7].
The design of a special intensive care unit for newborns, a Neonatal Intensive Care Unit (NICU), dates back to 1960 [8]. The concept of specialized perinatal care based on level of acuity was proposed in 1976 [9]. NICU stays require high levels of nursing resources and specialized nursing skill sets [1]. Given the unpredictability of the patients’ arrivals and clinical trajectories, compared to most hospital units, the NICU presents a challenging environment for forecasting the future census which may impact staffing levels and quality of care. Several studies suggest that suboptimal nurse staffing levels in the NICU are associated with increased adverse patient outcomes. Hamilton et al. (2006) studied 54 NICUs, found that 57% of shifts were understaffed, and understaffing was associated with higher mortality rates [10]. Further, many NICU patients have central venous lines [11]. Nurse understaffing may result in delayed or inaccurate aseptic technique, and therefore increase the risk for infection [1]. Accurately forecasting future census using past and current observations can help minimize discrepancies between expected and actual demand for health care resources.
There is extensive research that supports the application of time series analysis to improve forecasting in health care, particularly focusing on disease outbreaks, patient arrivals, and resource planning. Autoregressive Integrated Moving Average (ARIMA) models have been widely used in forecasting disease outbreaks, e.g., the flu and anthrax, by predicting disease patterns and corresponding Emergency Department (ED) utilization [12–13]. Guo et al. (2013) developed ARIMA models to forecast patient volume to design a flexible nursing schedule that accounts for skill level and shift preferences [14]. ARIMA models have been used to predict ED patient volume across short- and long-term time horizons [15–20]. Marcilio et al. (2013) compared forecasting accuracy of generalized linear models to time series models in forecasting ED visits and found that generalized linear models provided higher accuracy than ARIMA models [21]. While time series methods have been applied in health care, gaps in the literature remain and further research is needed to forecast patient census independent of disease outbreaks while considering a personalized framework, e.g., accurately forecasting future census values classified by patient characteristics to better inform resource planning. Sun et al. (2009) developed forecasting models that accounted for patient acuity to predict ED volume [22]. However, majority of the models presented in Sun’s study have limited accuracy measured by Mean Absolute Percent Error (MAPE). Temple et al. described a method to predict individual NICU patient’s discharge dates based on daily progress notes [23]. Additionally, Levin et al. modeled patient length of stay using daily provider orders [24]. These methods provide valuable tools for resource planning once a patient has been admitted to the unit. However, they are not designed to forecast the trajectory of the unit’s overall census, only the length of stay for individual patients. Koestler et al. developed a NICU census forecasting model by predicting arrival counts using a Poisson Autoregressive model and using birth weight and gestational age to predict length of stay and expected departure counts [25]. Although their study considers seasonality and patient-specific information, it does not assess model accuracy during different prediction periods (e.g., lower or higher census periods) which is important for the clinical interpretation and implementation of the models.
In this paper, we study the problem of accurate daily patient census prediction considering the dependency and seasonality aspects of census using forecasting methods. Specifically, we develop time series and linear regression models to provide 7-day forecasts for the future NICU census at the study hospital – Christiana Care Health System – while addressing the gaps in the literature regarding: (i) comparison of forecasting models to the current clinical practice methods; (ii) use of multiple error statistics to evaluate models instead of solely using MAPE; and (iii) assessing forecasting accuracy of the proposed models during different observed census prediction periods.
2. Objectives
Our goal is to predict the future census at a large tertiary care referral Level III NICU using past and current census while considering dynamic changes in census over time. Currently, the average census from previous calendar year is used for resource planning purposes at the facility where the study was conducted, referred as the “fixed average census approach”. We explore forecasting models with and without aggregate patient characteristics and assess the accuracy of the proposed forecasting models during consistently lower, average, and higher census periods compared with the fixed average census approach. In the remainder of this paper, “consistently” refers to the census condition that is observed 7 days in a row during a given week. “Average census period” refers to a period with daily census values that are consistently within ±4 patients of the average daily census from the previous year. The census range for average census period as ±4 patients was determined using half the standard deviation of daily census over the study period which was 8.05, and can easily be modified to capture different ranges. The average daily census for the previous year (2012) was 50 patients. “Lower census period” is defined as a period with daily census values that are consistently below 46 (50–4). “Higher census period” is defined as a period with daily census values that are consistently above 54 (50+4).
3. Methods
3.1 Study Settings
The NICU is a large Mid-Atlantic region tertiary care NICU with approximately 1100 neonatal admissions per year and a maximum capacity of 72 beds. In this study, census is defined as the number of neonatal patients in the NICU after accounting for all admissions and discharges that occurred during a given day. Our dataset includes patient-level data (e.g., gender, birth weight, gestational age, clinical conditions such as sepsis, necrotizing enterocolitis, seizures, apnea, chronic lung disease, bronchopulmonary dysplasia, pneumothorax, intraventricular hemorrhage, cystic periventricular leukomalacia, patent ductus arteriosus, and hydrocephalus, and respiratory support such as ventilation-related information) and hospitalization-related data (e.g., date of admission, date of discharge, daily census etc.) collected retrospectively at the Christiana Care Health System NICU. Five years of data between January 2008 and December 2012 were used for model development (N=1827 daily census observations), and one year of data between January and December 2013 were used for model validation (N=365 daily census observations).
3.2 Data Analysis
Time series analysis is a method for analyzing longitudinal data observed at different points in time [26]. The methodological framework used in this study is presented as follows:
Plot observed census data over time as a time series
Transform census data in case of a non-stationary (e.g., linear trend over time) and/or non-stationary variance as a function of time
Fit several models to census data and estimate model parameters using dependency measured, e.g., Autocorrelation Function (ACF) and Partial Autocorrelation Function (PACF)
Identify best models using fit criteria, e.g., Akaike’s Information Criterion (AIC), Bias Corrected AIC (AICc), and Bayesian Information Criterion (BIC)
Apply diagnostic tools to determine how well the models fit census data, e.g., Plot of standardized residuals and their normal Q-Q plot, and
Forecast n days during specified periods using an independent dataset. Evaluate the accuracy of the forecasts provided by the models by using error statistics, e.g., Mean Absolute Percentage
Error (MAPE) and Root Mean Square Error (RMSE) As the first step, we plot the NICU census during the study period and inspect the graph for any obvious patterns (► Figure 1).
Fig. 1.

Daily NICU census (January 2008 – December 2012, N=1827 daily census observations)
In ► Figure 1, the horizontal axis shows the days from January 1, 2008 to December 31, 2012, and the vertical axis shows the daily census. The NICU census exhibits increasing and decreasing patterns and multiple peaks. A stationary time series exhibits statistical properties that are all constant over time [26]. Linear trend and changing variance over time (heteroscedasticity), may indicate non-stationary behavior and impact the performance of model fitting and forecasting [26]. As for the instability of variance, visual inspection of ► Figure 1 did not indicate any obvious heteroscedasticity. In addition, the Breusch-Pagan test showed that there was not enough evidence to reject the null hypothesis that the census time series has constant variance at the 0.05 significance level. However, ► Figure 1 showed a slight linear trend, which is a characteristic a non-stationary series. Therefore, a data transformation may be necessary before model fitting. First differencing is a method used to stabilize the time series data by eliminating the linear trend [26]. The first difference of a time series is the collection of changes from one time point to the next. After first differencing, the NICU census time series showed no linear trend. The Kwiatkowski-Phillips-Schmidt-Shin (KPSS) test showed that there was not enough evidence to reject the null hypothesis that the differenced census time series is trend stationary at the 0.05 significance level. Next, we investigated if the first differenced census showed any heteroscedasticity by comparing the Autocorrelation Function (ACF) of first differenced census time series with the first differenced and log transformed time series. The results suggested that the first differenced NICU census time series is a stationary process and no further data transformation was applied.
Further, we examined the weekly, daily and monthly census patterns using a larger dataset collected retrospectively at the same NICU between January 1989 and February 2015. Over the 27-year period, mean census was 44.36; and the standard deviation was 7.24. (Over the five-year period used for model development, mean census was 48.74; and the standard deviation was 8.05). Between January 1989 and February 2015, the average daily census was lower during weekends compared to weekdays, and lower during winter months compared to summer months.
In addition, we considered aggregate patient characteristics within the forecasting framework. Patient-level variables available at admission were averaged for the set of patients in the NICU each day. The variables included in the analysis and their definitions are presented in ► Table 1.
Table 1.
Definition of patient level variables used in forecasting models
| Variable | Variable Type | Definition |
|---|---|---|
| Mother’s Age | Non-Negative Integer | The age of the patient’s mother in years on the data of birth |
| Mother’s Gravidity | Non-Negative Integer | Mother’s total number of pregnancies including admitted patient |
| Antibiotic Use | Binary | Any identified antibiotic use by patient’s mother, prenatal or during labor |
| Steroid Use | Binary | Any identified steroid use by patient’s mother, prenatal or during labor |
| MgSO4 Use | Binary | Any identified Magnesium Sulfate use by patient’s mother, prenatal or during labor |
| Multiple Gestation | Binary | Admitted patient was one of multiple gestations |
| Premature Delivery | Binary | Admitted patient was delivered with a gestational age of less than 37 weeks |
| Delivery Method | Binary | Patient was delivered by vaginal birth or caesarean section |
| Gestational Age | Non-Negative Integer | The gestational age of the patient in weeks |
| Birthweight Admission Weight Apgar at 1 Minute Apgar at 5 Minutes Premature Rupture of Membranes Outborn |
Non-Negative Integer Non-Negative Integer Non-Negative Integer Non-Negative Integer Binary Binary |
The weight of the patient in grams at time of birth The weight of the patient in grams at time of initial admission to NICU Patients Apgar score at 1 minute after birth Patients Apgar score at 5 minutes after birth Rupture of amniotic sac at least 1 hour prior to start mother’s labor Patient born in Christiana Care Health System hospital |
Additional patient-level variables associated with treatment provided by the NICU were discarded due to the absence of treatment dates. Variables that were categoric for the individual (e.g., race, use of antibiotics by mother, etc.) represent the proportion of patients that fit that category when the data is aggregated by day. Numerical patient-level variables for the individual were averaged for the patient population for each day.
3.3 Model Development
We developed ARIMA and linear regression models using R 3.2.0 to forecast the future NICU census. ARIMA(p, d, q)(P, D, Q)s models include autoregressive and moving average components p and q, seasonal autoregressive and moving average components P and Q, ordinary difference component d, seasonal difference component D, and order of seasonal lags s. Autoregression refers to prediction of the current value of a time series as a function of the past values of the series. Seasonality refers to any pattern in the data that repeats itself with a known periodicity. The extent to which it might be possible to use an ARIMA model to forecast a time series from its own past values can be assessed by evaluating the Autocorrelation Function (ACF) and Partial Autocorrelation Function (PACF) [26].
NICU census exhibits a persistent, slowly decaying autocorrelation structure, with statistically significant autocorrelation still present at lags up to 40. In addition, the PACF cuts off after a lag of 1, indicating possible non-stationary behavior. This also suggests an ARIMA(1,0,0) model may be appropriate. The ACF and PACF of the first-differenced census are similar to one another with significant negative peaks at lags of 4 and 12 suggesting a possible seasonal component at lags of 4. Additionally, over the study period the median length of stay is 7 days and the mean length of stay is 14.67 days. Considering these aspects, we fit seasonal models with 4-day, 7-day, and 14-day lags and assessed forecast accuracy.
Further, using linear regression models, we considered multiple variables as linear predictors of census including census lags from day 1 through day 14, day of the week, month, quarter, holidays, and mean census for the same month from the previous year, as well as 7 through 14 day lags for admissions, discharges, and selected aggregated patient-level variables, as presented in ► Table 1. Variable selection was performed based on analysis of the correlation matrix for numeric variables, boxplots of the census for categorical variables, and by eliminating insignificant variables from successive regressions and conducting a stepwise regression. The final regression model included the predictor variables for day of the week, month, average mother’s gravidity at lags 10,11 and 12, average gender proportions at lags 9 and 10, average 5-minute Apgar score at lags 13 and 14, proportion of patients with mother’s on antibiotics at lags 11 and 13, discharges at lag 10, and census at lag 1 (Adjusted R-Squared: 0.8919).
Comparing the considered time series and regression models, the best-fitting models were identified by using AIC, AICc and BIC. The best-fitting models were ARIMA(1,0,0), ARIMA(1,0,0)x(1,1,2)7, ARIMA(2,1,4)x(1,1,2)14, and the final linear regression model as discussed. After fitting the models, diagnostic tools were used to evaluate the goodness of fit including the plot of standardized residuals of the fitted model, ACF of residuals, and the Normal Q-Q plot of standardized residuals. The ACF of residuals are displayed for each model in ► Figure 2.
Fig. 2.

Autocorrelation function of residuals for forecasting models ARIMA(1,0,0), ARIMA(1,0,0)x(1,1,2)7, ARIMA(2,1,4)x(1,1,2)14, and linear regression
We observe similar behavior in all models, noting that most of the apparent autocorrelation has been accounted for. Significant peaks in the ACF of residuals appeared at lag 17 for all models, as well as at lag 5 for ARIMA(1,0,0) and ARIMA(1,0,0)x(1,1,2)7. However, adjusting models for these slight remaining autocorrelations did not improve diagnostic or fit values. Visual inspection of the Q-Q plots for each model confirmed that residuals appear to follow a normal distribution (► Figure 3).
Fig. 3.

Quantile-quantile plot of residuals for forecasting models ARIMA(1,0,0), ARIMA(1,0,0)x(1,1,2)7, ARIMA(2,1,4)x(1,1,2)14, and linear regression
In conclusion, the selected forecasting models provided a good fit for the observed daily census data.
4. Results
4.1 Specific Census Level Validation
We applied the best performing ARIMA with and without seasonality, and linear regression models to forecast the census during three distinct time periods in the validation dataset. The three periods were characterized by census values that were consistently above, below, or near the average census from the previous year. Analyzing the forecasting results during these periods provided insight into how the models perform when the census persists in various conditions that affect the utilization of resources compared with the fixed average census approach. May 3 – 9, 2013 was selected as the validation set for the average census period. There were 5 such periods during 2013. January 7 – 13, 2013 was selected as the validation set for the consistently low census. There were 6 such periods during 2013. November 14 – 20, 2013 was selected as the validation set for the consistently high census periods. There were 18 such periods during 2013. To measure forecasting accuracy, we used the Mean Absolute Percentage Error (MAPE) and Root Mean Square Error (RMSE) where
and
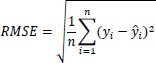 |
with n representing the total number of forecasted future census values,yi representing the observed census at time i, ŷi representing the forecasted census value for time i. In the literature, MAPE < 10% is considered highly accurate forecasting [27]. The fixed average census approach used the value of 50, which was the average daily census from previous year (2012).
For the consistently higher census period, the best performing model was ARIMA(2,1,4)(1,1,2)14 when MAPE or RMSE was used (► Table 2, Column 2).
Table 2.
Mean Absolute Percentage Error (MAPE) [Root Mean Square Error (RMSE)] values of the best-fitting forecasting models and the fixed average census approach for different census periods during January – December 2013. MAPE values are measured as percentages. RMSE values are measured in number of patients.
| Model | January 14 – 20, 2013 (High Census) | April 1 – 7, 2013 (Low Census) | May 3 – 9, 2013 (Average Census) | Average MAPE [RMSE] of All Predictions |
|---|---|---|---|---|
| Fixed average census approach | 0.192 [12.294] | 0.180 [7.681] | 0.038 [2.035] | 0.119 [6.272] |
| ARIMA(1,0,0) | 0.056 [4.016] | 0.080 [3.636] | 0.059 [3.662] | 0.074 [3.775] |
| ARIMA(1,0,0)x(1,1,2)7 | 0.042 [3.420] | 0.098 [4.288] | 0.062 [3.618] | 0.073 [3.686] |
| ARIMA(2,1,4)x(1,1,2)14 | 0.039 [3.211] | 0.078 [3.462] | 0.067 [3.912] | 0.081 [4.090] |
| Linear Regression | 0.075 [5.149] | 0.059 [2.755] | 0.063 [3.331] | 0.071 [3.622] |
For the consistently lower census period, the ARIMA(2,1,4)(1,1,2)14 model performed best followed by linear regression when MAPE or RMSE was used (► Table 2, Column 3). For the average census period, the best performing model was ARIMA(1,0,0) when evaluating the forecast using MAPE (► Table 2, Column 4) and linear regression when using RMSE (► Table 2, Column 4). During periods of consistently average census values, we expected the fixed average census approach to perform well, possibly even superior to our forecasting models, as it is the case for the selected validation set in this instance. However, the fixed average census approach was outperformed by all models in both consistently high and consistently low census periods. In conclusion, the best-performing 7-day census forecasting models showed higher accuracy compared to the fixed average census approach during consistently higher and lower census periods, and comparable results to the fixed average census approach during average census periods.
4.2 Forecasting Period Validation
In addition to validating our models during consistent census periods, we also computed the average MAPE and RMSE of all possible 7-day prediction periods between January and December 2013. Average MAPE and RMSE of all possible predictions during the one-year validation time period in 2013 provide an additional metric to measure the accuracy of the forecasting models. For each day in the validation period, we forecasted the census for each of the next 7 days. The MAPE and RMSE were calculated for each 7-day forecast and averaged to obtain a single value corresponding to the average MAPE or RMSE of all possible predictions. These errors statistics, along with the density of their values, provided insight on which model performs most accurately over the entire year. Column 5 of ► Table 2 presents the error rates of the forecasting models during the entire evaluation period of January – December 2013. Forecasted census values compared well with the actual observed daily census data, with an average MAPE of 7.47% compared to an average MAPE of 11.76% when using the fixed average census approach between January and December 2013 (► Table 2, Column 5). ► Figure 4 presents the density plot of forecast accuracy, measured by MAPE, for each model.
Fig. 4.

Density of Mean Actual Percentage Error values for forecasting models and fixed average over all possible predictions during validation period (January 2013 – December 2013, N=359)
The density function presents the relative frequency of a particular MAPE value for any given prediction. As shown in Figure 4, MAPE values for the forecasting models are right-skewed, with values at the tail increasing the average MAPE value. The fixed average approach produces MAPE values that are closer to a uniform distribution, meaning that high MAPE values occur nearly as frequent as lower MAPE values. In other words, the density plot of the proposed forecasting models provides additional insight beyond the average MAPE values for comparing the accuracy of the models with the fixed average census approach.
4.3 Clinical Practice Implications
In clinical practice, the discrepancy between expected and actual census caused by forecasting model underestimation can lead to suboptimal nurse-to-patient ratios and impact the effort to offer adequate and safe patient care. We studied underestimation of observed daily NICU census comparing the best-fitting ARIMA model during a consistently higher census period, ARIMA(2,1,4)x(1,1,2)14, to the fixed average census approach. This approach can be easily extended to other time periods, e.g., consistently lower census period, or other error directions, e.g., overestimation. The reason for choosing a consistently higher census period is that higher census represents higher demand for resources and are therefore challenging from a health care resource management perspective. ► Figure 5 shows the forecasted and observed census during November 14 – 20, 2013, as well as the fixed average census approach.
Fig. 5.

Predicted vs. observed daily NICU census data during a consistently higher census period (November 14 – 20, 2013). Solid line represents the observed daily census during the selected 7-day time period. Dashed line represents the forecasted daily census values provided by the ARIMA(2,1,4)x(1,1,2)14 model. Dotted line represents the fixed average census approach.
The ARIMA(2,1,4)x(1,1,2)14 model underestimated actual observed daily census by 14 patients over the 7-day period, or an average of 2.47 patients per day (► Figure 5). The fixed average census approach underestimated the observed daily census by 84 patients over the 7-day period, an average of 12 patients per day during the same period. This result suggests that the proposed forecasting model reduced underestimation on average by 83% during the considered consistently higher census period compared to the fixed average census approach.
5. Discussion
Accurate census forecasting has implications on quality of care, resource planning, and employee satisfaction in health care systems. Using a fixed value based on previous year’s average daily census lacks to consider the dynamic nature of census over time. Census variability is especially critical in the NICU due to the high level of uncertainty regarding patient arrivals and clinical paths. In this study, we presented forecasting models with higher prediction accuracy during consistently lower, average and higher census periods compared with the current approach of using the average daily census from previous year.
The contribution of our study is threefold. First, we quantified the impact of using time series and linear regression models on accuracy for forecasting the daily NICU census under various census conditions compared to the fixed average census approach. The best-fitting models included a non-seasonal ARIMA model, ARIMA(1,0,0), seasonal ARIMA models ARIMA(1,0,0)x(1,1,2)7 and ARIMA(2,1,4)x(1,1,2)14, as well as a linear regression model. The best-fitting models were applied to an independent one year NICU census dataset and provided 7-day forecasts. We acknowledge that forecasting the daily census beyond a week may be required in clinical practice, especially in terms of nurse scheduling. However, 7-day forecasts can inform clinicians in order to better formulate short-term resource planning. Due to the unique training received by neonatal nurses, the NICU in this study does not utilize excess labor from other hospital units. Simply put, the NICU’s possible labor force is less flexible than most other units. Accurate short-term forecasts allow nurse managers to plan ahead within the supply of neonatal nurses, reducing the reliance on day-of call-ins or call-outs. Our modeling approach can be easily applied to provide long-term forecasts; however, we acknowledge the increase in prediction error as the forecasting horizon expands. Additionally, independent variables in the regression model exhibit significantly less correlation to census values at larger lags. Seven-day forecasts strike the balance of including independent variables with large enough correlations and a long enough time horizon that allows clinicians to utilize the forecast for resource planning. Best-fitting models represented on average a 36.49% improvement in overall forecasting accuracy during various census periods, including significant improvements during consistently lower and higher census periods as compared with the fixed average census approach. In addition, the proposed forecasting models were simple in terms of requiring only a few census observations from within the most recent month of data. The simplicity of the forecasting models is advantageous for implementation into clinical practice.
Second, our study provides insight into seasonal patterns of the NICU census using a large dataset (including 27 years of daily census observations). We found that the mean and standard deviation of daily NICU census differs by week day and month. Over the 27-year period, mean census was lower during winter months compared to summer and fall. This can be explained by the seasonality of births [28]. The daily census variation was slightly greater during weekends compared to weekdays. We speculate that the increased census during the week may have resulted from multiple planned deliveries of infants with known problems requiring NICU admission and proportionally less unplanned admissions during Monday to Friday. On the weekends, a higher proportion of NICU admissions are from unscheduled deliveries, resulting in unscheduled demand, which may result in unpredictability and increase in census variation. These observations provide a better understanding of the seasonal aspects of the NICU census.
Third, our study provides a method for forecasting future census using past and current observations obtained from the best-fitting time series models. The best-preforming forecasting models provided higher accuracy during consistently lower and higher census periods compared with the fixed average census approach.
One of the benefits of ARIMA models is their ability to include local trends in the time series data to examine under- and overestimation. We were particularly interested in underestimation during a consistently higher census period due to the resource management implications of understaffing in clinical practice. Likewise, in the study facility periods of consistently high census levels occur with much greater frequency than periods of consistently low or average periods. During the forecasting period (2013), there were 18 such weeks, compared to only 5 weeks of consistently lower census values and 6 weeks of consistently average census values. During the selected higher census period in 2013, the best-performing ARIMA model, ARIMA(2,1,4)x(1,1,2)14 underestimated observed census on average by 2.47 patients per day, with a range of –1 (overestimation) to 5 patients per day. The fixed average census approach during the same period underestimated the census on average by 12 patients per day with a range of 9 to 16 patients per day. In clinical practice, the discrepancy between expected and actual census can have significant implications on bed management and resource planning. For example, having 12 patients that were underestimated by the fixed average census approach would result in an understaffing level between 4 nurses (assuming all 12 patients’ condition require a 1-to-3 nurse-to-patient ratio) and 12 nurses (assuming all 12 patients’ condition require a 1-to-1 nurse-to-patient ratio). Compared to the current practice of using the fixed average census approach, the proposed forecasting framework can provide daily census predications with higher accuracy and help to reduce the patient risks associated with underestimation of census.
The utility of the forecasting methods put forth has been evaluated by one of our NICU physicians and collaborators. According to his feedback, “nurse staff ratios are linked to health outcomes. Historically it is difficult to predict nurse staff levels in a referral critical care unit in which patient census is variable and unable to be uncontrolled by design. Nurse understaffing is associated with poor health outcomes and employee dissatisfaction. Nurse overstaffing is associated with employee dissatisfaction and inefficiency in health provision costs. Nurse employment is the highest fixed cost of care in an era of increased for health systems to control costs while improving patient outcomes. Aligning staffing ratios with patient care needs/census will likely lead to improved patient care outcomes, improved employee satisfaction and improved economics in the provision of high-cost neonatal care.”
Future research could expand our work in several ways. A limitation of the current study is that health systems may operate differently, and the results drawn from our study based on data from one hospital and one unit may not be generalizable. Additionally, we recognize that dynamic patient-specific characteristics provide a useful means to predict the probability of discharges, and thus provide a possible improvement to the accuracy of census forecasts. However, the increasing complexity of the models and data requirements limits the advantages of considering dynamic patient-specific characteristics. Similarly, another limitation is that our methods do not account for the acuity-level of patients. Acuity, as it is defined at the NICU in this study, pertains to the resource intensiveness of a patient. In future studies, dividing the census into separate acuity levels and analyzing the census patterns of the each group could improve forecast accuracy and provide additional information to clinicians for resource planning. Further, we recognize that forecasting methods may need to provide predictions for longer time periods. Our method can provide short- and long-term forecasts as needed; however, we recognize the limitation that the error term increases as the prediction period increases. Another limitation is the potential underestimation of the census by using the proposed forecasting models. One possible solution could incorporate a correction term that can be added to the predicted future values with the goal of minimizing the underestimation by the model. From a clinical perspective, adding the correction term may emphasize the health systems’ preference of overstaffing compared to understaffing to ensure appropriate quality of care.
6. Conclusions
Understanding the dynamics of patient census and accurately predicting future census are essential to the dynamics of staff and resource planning. Time series analysis can identify changes in daily census over time, inform resource planning, and potentially impact patient care. This study highlights opportunities to better capture the dynamic NICU census patterns over time. Our findings showed that a simple time series model that accounts for recent census levels and seasonality provides higher accuracy of daily census prediction compared with the current approach of using a yearly average value from previous year, and provides opportunities to reduce underestimation of patient census.
Acknowledgements
The authors would like to acknowledge the data acquisition and clinical support provided by the Value Institute and the Division of Neonatology at Christiana Care Health System, Newark, DE.
Footnotes
Clinical Relevance Statement
Accurate patient census prediction can facilitate better resource management and has the potential to enhance patient safety and staff satisfaction. Forecasting methods can accurately capture the dynamics of the unit-level daily census during different census periods. The proposed framework can be applied to other health care settings, extended to different forecasting intervals, and personalized by incorporating additional patient characteristics to classify unit-level census into different acuity-based categories.
Conflict of Interests
The authors declare that they have no conflicts of interest in the research.
Human Subjects Protections
The authors declare that this research does not involve human subjects.
Authorship
RL, DP, and EVJ provided medical advice from the NICU and perinatal health care perspectives. MC and SH are responsible for statistical analysis and model development. All authors collaboratively wrote the manuscript. All authors read and approved the final manuscript.
References
- 1.Rogowski JA, Staiger D, Patrick T, Horbar J, Kenny M, Lake ET. Nurse Staffing and NICU Infection Rates. JAMA Pediatr 2013; 167(5):444–450. [DOI] [PMC free article] [PubMed] [Google Scholar]
- 2.Cho SH, Ketefian S, Barkauskas VH, Smith DG. The Effects of Nurse Staffing on Adverse Events, Morbidity, Mortality and Medical Costs. Nurs Res 2003; 52(2):71–79. [DOI] [PubMed] [Google Scholar]
- 3.Penoyer DA. Nurse staffing and patient outcomes in critical care: A concise review. Crit Care Med 2010; 38(7):1521–1528. [DOI] [PubMed] [Google Scholar]
- 4.Cescutti-Butler L, Galvin K. Parents’ perceptions of staff competency in a neonatal intensive care unit. J Clin Nurs 2003; 12: 752–761. [DOI] [PubMed] [Google Scholar]
- 5.Braithwaite M. Nurse Burnout and Stress in the NICU. Adv in Neonatal Care 2008; 8(6):343–347. [DOI] [PubMed] [Google Scholar]
- 6.Scheward L, Hunt J, Hagen S, Macleod M, Ball J. The relationship between UK hospital nurse staffing and emotional exhaustion and job dissatisfaction. J Nurs Manag 2005; 13: 51–60. [DOI] [PubMed] [Google Scholar]
- 7.Aiken LH, Clarke SP, Sloane DM, Sochalski J, Silber JH. Hospital Nurse Staffing and Patient Mortality, Nurse Burnout, and Job Dissatisfaction. JAMA 2002; 288(16):1987–1993. [DOI] [PubMed] [Google Scholar]
- 8.Neonatal Intensive Care, A History of Excellence, NIH Publication No. 92–2786 1992. Available from: http://www.neonatology.org/classics/nic.nih1985.pdf (accessed September 28, 2015).
- 9.American Academy of Pediatrics. Levels of Neonatal Care. Pediatrics 2004; 114(5). Available from: http://dx.doi.org/10.1542/peds.2004–1697. [DOI] [PubMed] [Google Scholar]
- 10.Hamilton KE, Redshaw ME, Tarnow-Mordi W. Nurse staffing in relation to risk-adjusted mortality in neonatal care. Arch Dis Child Fetal Neonatal Ed 2007; 92: F99-F103. [DOI] [PMC free article] [PubMed] [Google Scholar]
- 11.Kilbride HW, Powers R, Wirtschafter DD, Sheehan MB, Charsha DS, LaCorte M, Finer N, Goldmann DA. Evaluation and development of potentially better practices to prevent neonatal nosocomial bacteremia. Pediatrics 2003; 111: e504-e518. [PubMed] [Google Scholar]
- 12.Reis BY, Mandl KD. Time Series Modeling for syndromic surveillance. BMC Med Inform Decis Mak 2003; 3(2). Available from: http://doi.org/10.1186/1472–6947–3–2. [DOI] [PMC free article] [PubMed] [Google Scholar]
- 13.Brillman JC, Burr T, Forslund D, Joyce E, Picard R, Umland E. Modeling emergency department visit patterns for infectious disease complaints: Results and application to disease surveillance. BMC Med Inform Decis Mak 2005; 5(1): 4. [DOI] [PMC free article] [PubMed] [Google Scholar]
- 14.Guo H, Tang J, Qu G. Historical Data Driven Nurse Flexible Scheduling Problem. 2013 25th Chinese Control and Decision Conference (CCDC). 25–27 May 2013, Guiyang City Guiyang, China. [Google Scholar]
- 15.Jones SS, Thomas A, Evans RS, Welch SJ, Haug PJ, Snow GL. Forecasting Daily Patient Volumes in the Emergency Department. Acad Emerg Med 2008; 15(2):159–170. [DOI] [PubMed] [Google Scholar]
- 16.Kam H, Sung J, Par R. Prediction of Daily Patient Numbers for a Regional Emergency Medical Center Using Time Series Analysis. Healthc Inform Res 2010; 16(3):158–165. [DOI] [PMC free article] [PubMed] [Google Scholar]
- 17.Schweigler LM, Desmond JS, McCarthy ML, Bukowski KJ, Ionides EL, Younger JG. Forecasting Models of Emergency Department Crowding. Acad Emerg Med 2009; 16: 1–8. [DOI] [PubMed] [Google Scholar]
- 18.Champion R, Kinsman LD, Lee GA, Masman KA, May EA, Mills TM, Taylor MD, Thomas PR, Williams RJ. Forecasting emergency department presentations. Aust Health Rev 2007; 31(1):83–90. [DOI] [PubMed] [Google Scholar]
- 19.Tandberg D, Qualls C. Time Series Forecasts of Emergency Department Patient Volume, Length of Stay and Acuity. Ann Emerg Med 1994: 23(2): 299–305. [DOI] [PubMed] [Google Scholar]
- 20.Yu Y, Lin H, Cheng B. The application of Prediction Modeling of the Optimal Emergency Nurse Scheduling. Advances in Information Sciences and Service Sciences 2013; 5(12):38–45. [Google Scholar]
- 21.Marcilio I, Hajat S, Gouveia N. Forecasting Daily Emergent Department Visits using Calendar Variables and Ambient Temperature Readings. Acad Emerg Med 2013; 20(8):179–177. [DOI] [PubMed] [Google Scholar]
- 22.Sun Y, Heng BH, Seow YT, Seow E. Forecasting daily attendances at an emergency department to aid resource planning. BMC Emerg Med 2009; 9(1). Available from: http://doi.org/10.1186/1471–227X-9–1. [DOI] [PMC free article] [PubMed] [Google Scholar]
- 23.Temple MW, Lehmann CU, Fabbri D. Predicting Discharge Dates From the NICU Using Progress Note Data. Pediatrics 2015: 136(2): e395-e405. [DOI] [PMC free article] [PubMed] [Google Scholar]
- 24.Levin SR, Harley ET, Fackler JC, Lehmann CU, Custer JW, France D, Zeger SL. Real-time forecasting of pediatric intensive care unit length of stay using computerized provider orders. Crit Care Med 2012; 40(11):3058–3064. [DOI] [PubMed] [Google Scholar]
- 25.Koestler DC, Ombao H, Bender J. Ensemble-based methods for forecasting census in hospital units. BMC Med Res Methodol 2013; 13: 67. [DOI] [PMC free article] [PubMed] [Google Scholar]
- 26.Shumway R, Stoffer D. Time Series Analysis and Its Applications: With R Examples. 3rd ed New York: Springer Texts in Statistics; 2011. [Google Scholar]
- 27.Lewis CD. Industrial and business forecasting methods: A practical guide to exponential smoothing and curve fitting. London: Butterworth Scientific; 1982. [Google Scholar]
- 28.Ellison PT, Valeggia CR, Sherry DS. Human birth seasonality. Brockman DK, van Schaik CP, editors. Seasonality in Primates: Studies of Living and Extinct Human and Non-Human Primates. Cambridge University Press; 2005. p. 379–399. [Google Scholar]