Summary
Background
A workflow is defined as a predefined set of work steps and partial ordering of these steps in any environment to achieve the expected outcome. Few studies have investigated the workflow of providers in a dental office. It is important to understand the interaction of dental providers with the existing technologies at point of care to assess breakdown in the workflow which could contribute to better technology designs.
Objective
The study objective was to assess electronic dental record (EDR) workflows using time and motion methodology in order to identify breakdowns and opportunities for process improvement.
Methods
A time and motion methodology was used to study the human-computer interaction and workflow of dental providers with an EDR in four dental centers at a large healthcare organization. A data collection tool was developed to capture the workflow of dental providers and staff while they interacted with an EDR during initial, planned, and emergency patient visits, and at the front desk. Qualitative and quantitative analysis was conducted on the observational data.
Results
Breakdowns in workflow were identified while posting charges, viewing radiographs, e-prescribing, and interacting with patient scheduler. EDR interaction time was significantly different between dentists and dental assistants (6:20 min vs. 10:57 min, p = 0.013) and between dentists and dental hygienists (6:20 min vs. 9:36 min, p = 0.003).
Conclusions
On average, a dentist spent far less time than dental assistants and dental hygienists in data recording within the EDR.
Keywords: Time and motion studies, dental clinics, workflow, dental records, health information systems, process assessment (health care)
1. Introduction
In 1984, 11% of dental practices in the United States used computers in their offices [1]. The use of technology, particularly computers, has been on the rise among dental practices worldwide. Around 2009, more than 85% of dental practices in the United States [2] and almost 100% of the dental practices in England and Wales [3] used computers in their practices. The transition from paper to digital technologies can radically change the daily workflow (“a predefined set of work steps and partial ordering of these steps” [4].) practices of clinicians and supporting staff in both positive and negative ways [4, 5]. Digital technologies such as an electronic health record (EHR) can provide benefits to patient outcomes, aid in diagnosis, reduce errors, improve patient safety, and support better patient outcomes [6]. EHRs can provide a seamless flow of information between providers by furnishing accurate and complete information and the ability to quickly provide and coordinate care. They also give providers a way to share information with other patients and caregivers [6, 7]. However, the incorporation of technologies like electronic dental records (EDR) in dental practice does create some challenges to the dental providers and staff by introducing breakdowns in their workflow [2]. Some of the undesirable effects are particularly seen in user satisfaction, efficiency, quality of care, and patient safety [4, 5]. Specifically in dentistry, a telephone interview of general dentists in the United States revealed that deficits in practice management functionality and usability, as well as inability to customize charts were flagged by dentists as negative features [1].
The steps that make up a workflow create a process model that is invaluable to management in communicating processes and tasks to employees. Process models can also be used to troubleshoot disruptions, bottlenecks, or other potential barriers to accomplishing the work in the most expeditious manner. Continuous self-reporting [8], subject evaluations, personal activity logs, review of departmental records, application logs, video-usability analysis, work-sampling, and time and motion [9–15] methodologies can all be used to quantify workflow. Time and motion methodology is commonly used to quantify workflow in order to find the potential impacts associated with Health Information Technology (HIT) implementation [16]. This methodology has been used previously to examine how HIT can both positively and negatively impact workflow [12, 14, 15]. Studies have consistently found that HIT use marginally impacts clinicians’ workflow and efficiency [9, 11, 12, 14, 17]. This methodology has also been used to study pre- and post-implementation of computerized provider order entry (CPOE) in emergency departments [9, 18]. The empirical model developed by J.Y Irwin, et al. [2] is probably the only one which provides comprehensive information regarding clinical workflow in the dental offices. However, to our knowledge, there has been no study conducted that uses time and motion methodology to explore and quantify the workflow as a result of dental providers using EDRs within their practices.
2. Objective
The study objective was to assess EDR workflows using time and motion methodology to identify breakdowns and opportunities for process improvement. Specifically, this study aimed to observe dentists, dental assistants, dental hygienists, and appointment coordinators working with the EDR in order to identify practice patterns with respect to information retrieval and documentation and quantify the workflow, as well as identify the breakdowns in workflow.
3. Materials and Methods
3.1 Setting and subjects
Marshfield Clinic Health System (MCHS), one of the largest physician-owned private group medical practices in the United States with over 50 medical centers and 10 Family Health Center dental clinics located in central, northern, and western Wisconsin, developed and implemented an integrated medical-dental electronic health record (iEHR) environment [19]. This provided an excellent opportunity to fullfill the objective of the study to assess EDR workflows using time and motion methodology in order to identify breakdowns and identify opportunities for process improvement. This was a natural test-bed for the study team to explore the human-computer interaction within the iEHR.
We undertook an observational study to examine the workflow of four different roles in the dental centers: dentists, dental hygienists, dental assistants, and appointment coordinators, while they were interacting with the EDR. In the context of this study, ‘providers’ includes the first three roles but excludes appointment coordinators. ► Table 1 illustrates the list of defined activities that were observed during the patient encounters. Observations were recorded at four different MCHS dental centers by two observers who were trained in conducting time and motion studies. The study team set out to observe four different types of patient encounters in each of the dental centers which included: 1) initial visit, defined as a scheduled appointment where the patient new to the MCHS dental center was seen for the first time and receives a plan for future treatment, 2) planned visits, defined as subsequent scheduled appointments where the patient would be receiving planned treatment, 3) emergency visits, unscheduled visit due to a dental emergency, such as pain due to infection or abscess, injury to the teeth or mouth, and 4) interactions with the appointment coordinators at the front desk, inclusive of appointment checking-in and scheduling, completing necessary patient paperwork, and telephonic business.
Table 1.
Activities List of activities that could be observed during a patient encounter
| Data Related | Patient Related | Talking | Walking | Miscellaneous |
|---|---|---|---|---|
| Reviewing Data | Examination | To Patient | Inside | Operatory Setup/ Cleanup |
| Recording Data | Performing Treatment | To Dentist | Out of Work Room | Waiting |
| Retrieving Data | Education/ Instruction | To Dental Staff | Rooming Patient | Other |
| Dictating Data | Check-In | To Patient’s Family | Releasing Patient | |
| Check-Out | To Medical Provider on Phone | |||
| Consultation | ||||
| Referral | ||||
| Attending Another Patient |
3.2 Data Collection Tool
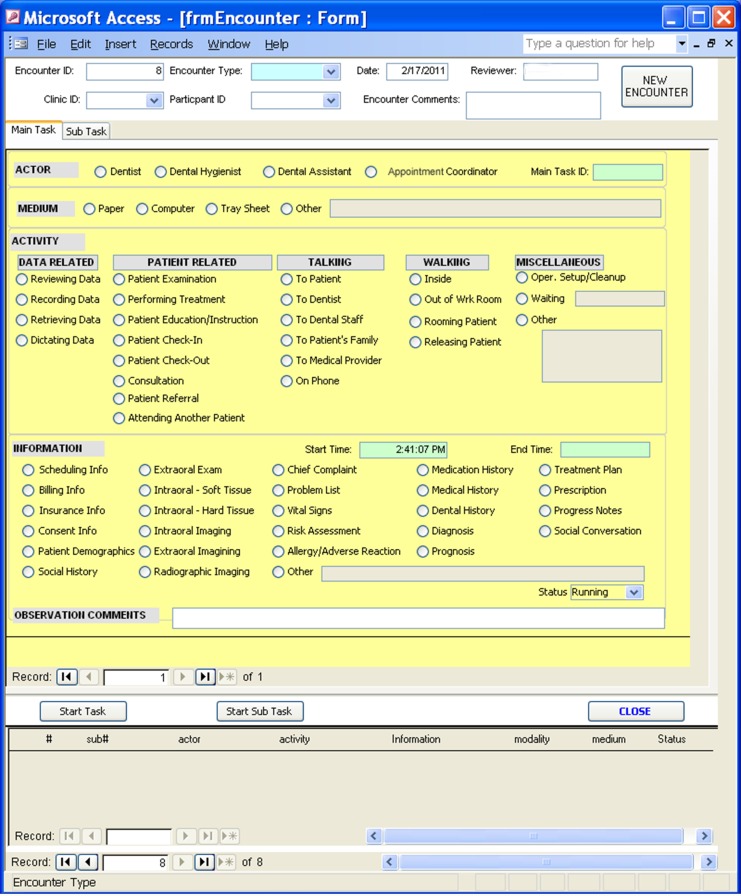
The study team modified a Time and Motion Study Ambulatory Practice (TMS-AP) Tool v1.0 which has been used mainly in a primary care setting for comparing pre and post EHR implementation, which was freely available through the U.S. Department of Health and Human Services Agency for Healthcare Research and Quality website [20]. This modified version of the TMS-AP tool was used to collect the observational data in our study. Since the original tool was designed to assess the impact of ambulatory care interventions on workflow, the study team made specific changes to optimally align the data collection tool to the dental practice domain. A pre-defined list of activities and information categories usually involved in dental workflow was incorporated into the tool, informed by a literature review. The tool allowed the observers to record details about workflow including: encounter type, role, interactive medium (paper, computer, tray sheet, other), specific type of activity, and information categories (scheduling, billing, insurance, consent information, patient demographics, extraoral exam, intraoral-soft tissue, intraoral-hard tissue, intraoral, extraoral, and radiographic imaging, chief complaint, problem list, vital signs, risk assessment, allergy/ adverse reaction, medication, medical, social, and dental histories, diagnosis, prognosis, treatment plan, prescriptions, progress notes, social conversation, and other). of that activity. The role choices included: dentist, dental hygienist, dental assistant, and appointment coordinator. The activity choices were aligned with the following categories: 1) data related, 2) patient related, 3) talk, 4) walk, and 5) miscellaneous, as seen in ► Table 1. Each activity was further divided into several sub activities. The information categories section included 26 choices as listed in ► Table 1 to provide an expanded contextual framework for the activity being performed. The modified tool used in this study is illustrated in ► Figure 1 and represents a Microsoft Access 2000 (Microsoft Corporation, Seattle, WA) database that was installed on a tablet PC.
Fig. 1.
Data collection tool used for coding the observational data
3.3 Data Collection
As part of the data collection process, the observers collected both quantitative and qualitative data. For the purpose of collecting the quantitative data, a codebook was developed that defined the types of encounters, roles, and activities within the data collection tool before conducting the observational sessions. Cohen’s Kappa coefficient was used to determine the inter-rater reliability for three jointly observed pilot patient encounters. Following consensus building, a total of 120 patient encounters were observed by two observers in four dental centers over a period of 35 days where 120 encounters represented a convenience sample that was projected based on number of observations that were feasible for observers in a defined time frame from one healthcare organization. This was determined as a good amount of observations based on the only other dental workflow study conducted by Irwin et. al. which only included 23 comprehensive examination and treatment planning sessions [2]. Study observations commenced only after verbal consent of both the provider and patient receiving treatment was obtained. For the purpose of collecting the qualitative data, the observers took notes of comments articulated by the providers during or at the end of the observation sessions.
3.4 Data Analysis
Three specific analyses were performed on the quantitative data: classic time and motion plot analysis, statistical analysis, and heat map analysis. Classic time and motion plot analysis was completed with data of activities and information categories observed and documented for each dental encounter. To simplify the case, we did not consider the subtask variable in this analysis so we could have a larger view of the general distribution of different activities and the collective informational categories. Statistical analysis compared the frequencies of different activities associated with the different types of encounters, by clinical providers using descriptive statistics. T-test and analysis of variance (ANOVA) were conducted to compare the amount of time spent by dental providers interacting with the EDR during the patient encounter based on clinical role. Heat map analysis compared the correlation among all the activities performed, informational categories recorded for each of the roles and type of encounter.
Qualitative data was assessed for breakdowns in workflow by conducting a content analysis of dental providers’ articulated comments [21]. The study team used the inductive approach of content analysis method to identify and make valid inferences of the workflow breakdowns from the dental providers’ articulated comments during the observation sessions.
The study protocol was submitted to the Institutional Review Board (IRB) and approved under 45 CFR 46, 21 CFR 50 and 21 CFR 56 (Marshfield Clinic Research Foundation IRB number ACH10110).
4. Results
4.1 Descriptive Statistics
Cohen’s Kappa coefficient for the three jointly-observed pilot patient encounters was 0.829 representing excellent [22] initial agreement between the two observers. A total of 120 patient encounters were observed by the two observers as part of the main study. The Cohen’s Kappa coefficient for the three jointly-observed patient encounters as part of the main observational data collection was 0.633, representing fair to good [22] agreement between the two observers during the data collection phase of the study. The observed encounters included 12 initial visits, 85 planned visits, 16 emergencies, and seven front desk patient interactions with the appointment coordinator. Approximately 88 hours were spent by observers conducting observational encounters in the dental centers. Dental center site 1 had a square footage of 8,840 square feet and 17 dental operatories, site 2 had a square footage of 17,725 square feet and 29 dental operatories, site 3 had a square footage of 9,739 square feet and 14 dental operatories, and site 4 had a square footage of 10,856 square feet and 19 dental operatories.
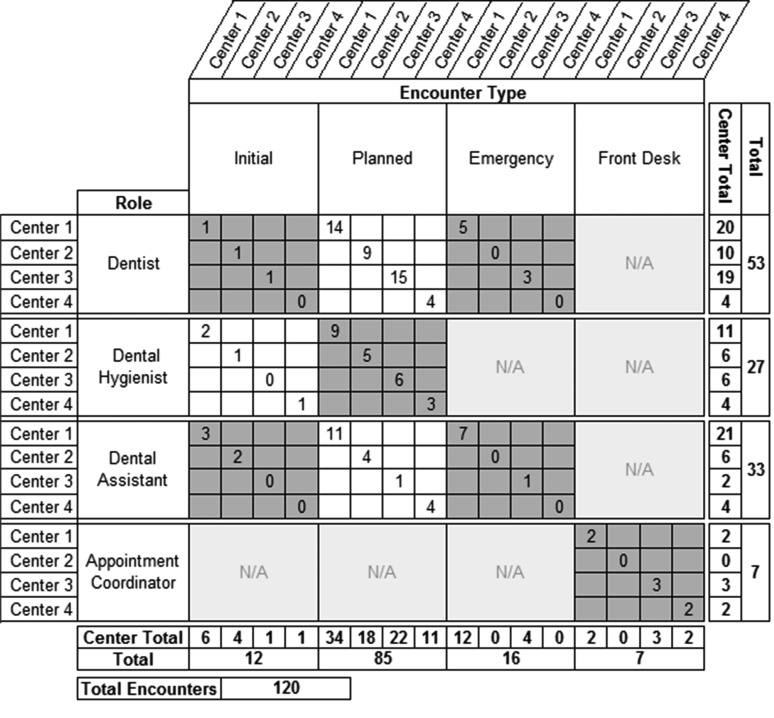
As seen in ► Figure 2, the 120 observational encounters included: 53 dentists-patient encounters, 27 dental hygienist-patient encounters, 33 dental assistants-patient encounters, and 7 appointment coordinators. The time spent interacting with the EDR was significantly different between dentists and dental assistants (6:20 minutes (min) vs. 10:57 min, p = 0.013), between dentists and dental hygienists (6:20 min vs. 9:36 min, p = 0.003). However there was no significant difference between dental assistants and dental hygienists (10:57 min vs. 9:36 min, p = 0.49). Furthermore, dentists spent 6:20 min per visit to interact with the EDR, which included 2:41 min in data recording and 3:80 min in data retrieving/reviewing; while dental assistants spent 10:57 min per visit to interact with EDR, including 6:39 min in data recording and 4:15 min in data retrieving/reviewing. Lastly dental hygienists spent 9:36 min per visit to interact with EDR, including 6:45 min in data recording and 2:22 min in data retrieving/reviewing. ► Table 2 illustrations the mean and standard deviation (SD) for the different activities per visit of the dental providers. ANOVA was performed on time spent interacting with the EDR, adjusting for different dental provider (exclude front desk) and different encounter types. P-values for dental provider and encounter type were 0.0093 and 0.00487, respectively.
Fig. 2.
Summary of Observation Data. Observation data broken down into dental centers, roles, and type of patient encounter
Table 2.
Mean and Standard Deviation per Activities and Providers Mean and Standard Deviation for all activities
| Dental Professionals | Mean | SD |
|---|---|---|
| Data Related Activities | ||
| Dentist | 6:20 min | 5:24 min |
| Dental Assistant | 10:57 min | 10:40 min |
| Dental Hygienist | 9:36 min | 4:40 min |
| All combined | 8:20 min | 7:15 min |
| Patient Related, Talking, Walking, and Miscellaneous | ||
| Dentist | 33:20 min | 19:16 min |
| Dental Assistant | 47:55 min | 25:27 min |
| Dental Hygienist | 37:50 min | 12:38 min |
| All combined | 38:40 min | 20:49 min |
| Average of All the Visits for all Activities | ||
| All combined | 46:59 min | 24:19 min |
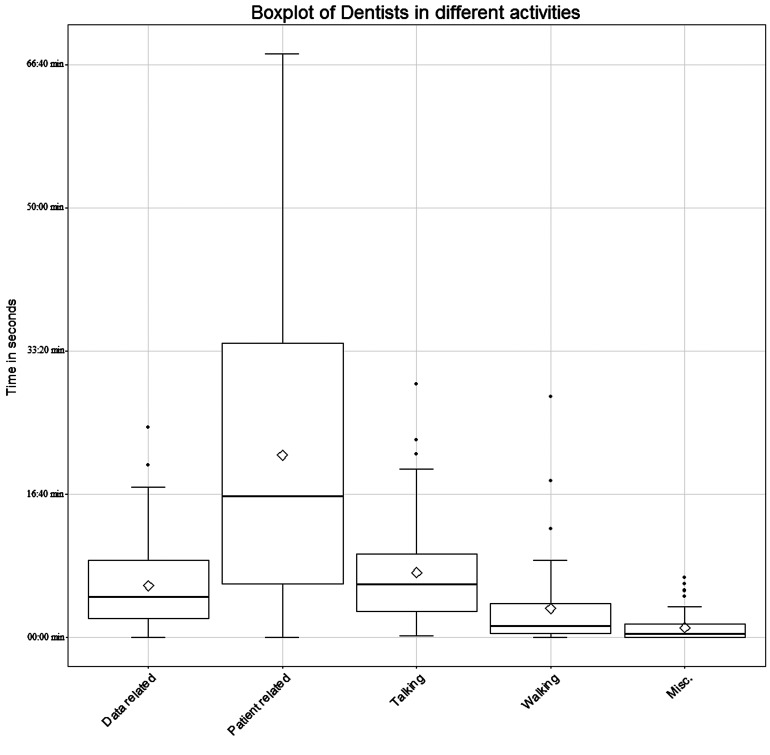
Within our most interesting group, dentists, there were large variations among the time spent on patient related activities, with average as 21:13 min with SD 17:20 min. ► Figure 3 provides the boxplot for distributions of time spent on different activities. There is a very large difference observed in time spent with regard to patient related activities with other types of activities, compared with average of time spent on data related activities 6:20 min with SD 5:24 min (p < 0.0001), the average spent on talking 7:33 min with SD 6:12 min (p < 0.0001), the average spent on walking was 3:23 min with SD 5:40 min (p < 0.0001) and the average spent on miscellaneous activities was 2:00 min with SD 1:47 min (p < 0.0001).
Fig. 3.
Boxplot for distributions of time spent on different activities by dentists
4.2 Observed Workflow Issues
From the inductive approach of content analysis method, four workflow barriers were identified:
1) inefficient charge documentation entry, 2) patient waiting list display deficiencies, 3) lack of integrated view of radiographic data in EDR, and 4) default e-prescribing mode that limited capacity for issue of written prescription.
4.3 Time and Motion Plot Analysis
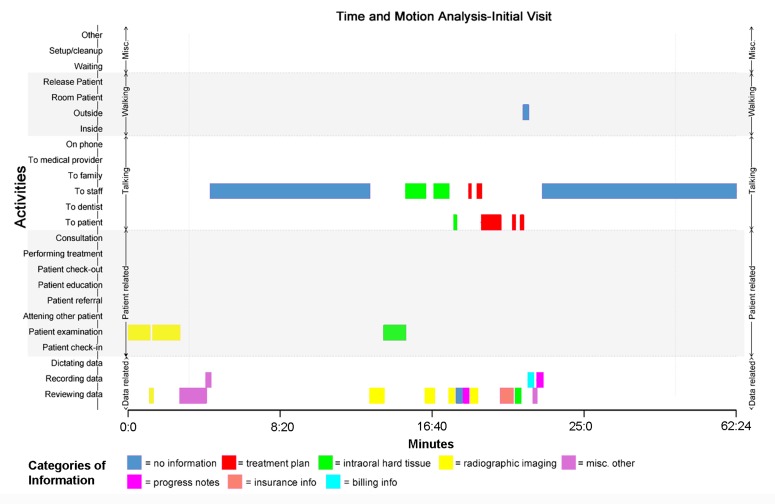
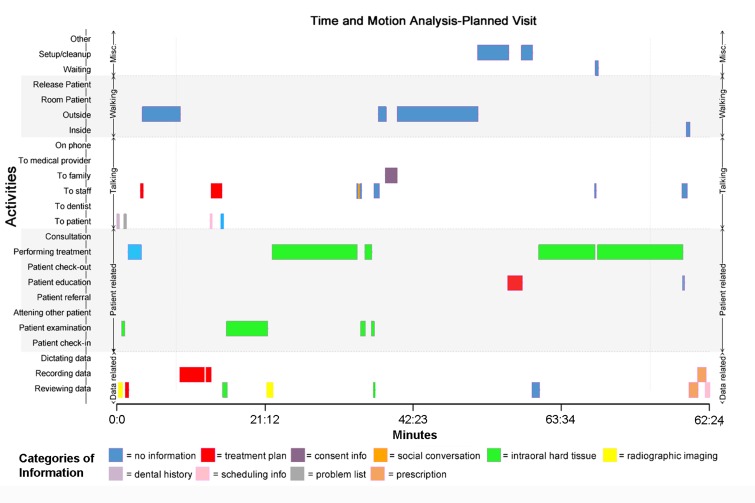
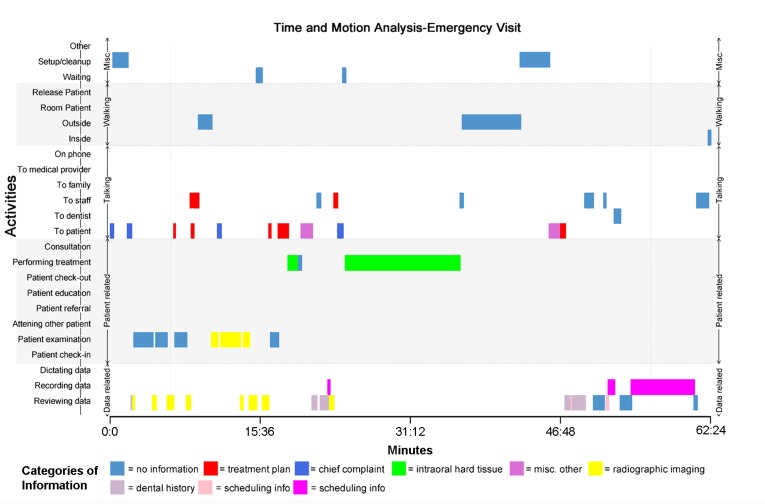
We initially conducted a time and motion plot analysis on n = 53 dentists for the following encounter types: initial visit, planned visit, and emergency visit to explore and illustrate the workflow related patterns. An example of a dentist’s workflow for the three types of patient encounters are illustrated in ► Figure 4, ► Figure 5, and ► Figure 6, respectively.
Fig. 4.
Time and Motion Analysis of a Dentist’s Workflow During an Initial Visit. In the time and motion plot, the x-axis is measured by seconds and the y-axis is the activities to them. The different colored horizontal bars show the duration of each of the activities as well as the information categories the dentist tried to perform. The gray and white horizontal sections are the categories of different groups of activities: data related, patient related, talking, walking, and miscellaneous
Fig. 5.
Time and Motion Analysis of a Dentist’s Workflow During a Planned Visit. In the time and motion plot, the x-axis is measured by seconds and the y-axis is the activities to them. The different colored horizontal bars show the duration of each of the activities as well as the information categories the dentist tried to perform. The gray and white horizontal sections are the categories of different groups of activities: data related, patient related, talking, walking, and miscellaneous
Fig. 6.
Time and Motion Analysis of a Dentist’s Workflow During an Emergency Visit. In the time and motion plot, the x-axis is measured by seconds and the y-axis is the activities to them. The different colored horizontal bars show the duration of each of the activities as well as the information categories the dentist tried to perform. The gray and white horizontal sections are the categories of different groups of activities: data related, patient related, talking, walking, and miscellaneous
4.4 Frequency Analysis
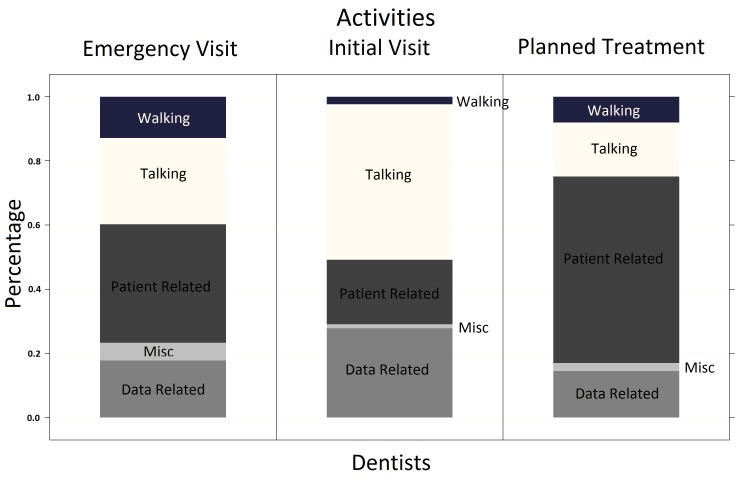
► Figure 7 illustrates the frequency analysis results on a bar chart, which represented the percentages of each encounter type and activities for the role of dentist. Patient related activity time included: planned treatment visit (58%), emergency visit (37%), and initial visit (20%). Talking interaction was highest at 48% for the initial visit 27% for emergency visit and 17% for planned treatment visit. On average, dentists spent 9:55 min (48.47%), 6:55 min (16.8%), and 10:03 min (26.82%) of their time talking during an initial, planned, and emergency visit, respectively.
Fig. 7.
Activity Distribution. Distribution of activities for dentists across all dental centers
4.5 Heat Map Analysis
The heat maps identified correlations between the activities and the informational categories of different encounter types. Heat map analysis was conducted only on the observational data for the role of the dentist provider due to the lack of data for other roles. ► Figure 8 illustrates the heat map analysis for the dentists’ interaction in the context of three different types of encounters including initial visit, emergency visit, and planned visit. For all three types of visits, data related, patient related, and talk activities showed highest correlation with informational tasks, while the ‘walk’ and ‘miscellaneous activities’ showed few informational task correlations, particularly with data related activities. For patient related activities, the intraoral-hard tissue tasks exhibited the highest levels of correlation: 0.52 for emergency visit, 0.25 for initial visit, and 0.62 for planned visit.
Fig. 8.
Activity (Summary) vs. Information for Dentists at Three Different Visit Types. This shows the heat map analysis for the dentists’ role for three different types of encounters. The key for the correlation 0 to 1 is on the right side of the figure
5. Discussion
An informatics tool was successfully developed to use in data collection for assessing dental provider and staff workflow. We thematically compared different types of roles: dentists, dental hygienists, dental assistants, and appointment coordinators at four community based Federally Qualified Health Centers that primarily focus on general dental practice principally involving preventive and restorative procedures and simple extractions. The study further examined data to compare the same types of encounters: initial, planned, emergency visits, and interactions with appointment coordinators, thereby providing more in-depth content analysis of the workflow while using the EDR. Moreover, factors that negatively impacted on workflow were identified including: issues with posting charges, the patient waiting list schedule (‘as soon as possible’ (ASAP) list), the EDR and viewing radiographs, and e-prescribing medications. All of these breakdowns were shown to be time consuming and burdensome to the dental providers and staff, and also to patients. The dental staff expressed frustration as the breakdowns in the workflow were consuming valuable time that could be better spent on patient care. Speculatively, time lost could negatively impact revenues. However further studies engaging cost analyses are required to test this assertion.
5.1 Breakdowns in Workflow
The themes identified from the observational data included workflow issues under the following categories:
Documenting charges: Posting charges for the procedures completed interrupted the dentists’ workflow because they had to go back to their office to document the charges and it was not easy to ascertain whether charges had actually been posted;
Patient waiting list schedule (ASAP list): the ASAP list in the EDR environment was used by dental appointment coordinators. This is a dental center-specific list of patients who were waiting for an appointment that can be called when there is a cancelation in any of the dental providers’ schedule in a specific dental center. This list took too long to display on the computer and there was no way to minimize the list without exiting it completely;
EDR view and radiograph view: very often, radiographs were viewed while entering data into the EDR. The radiographs are only accessible and viewed digitally through a separate software program that was not integrated with the EDR environment. This forced the dental provider to click back and forth between two programs to view the radiographs while documenting data within the EDR; and
e-Prescribing medications: electronically prescribing medications was articulated as an issue by dentists observed in this study. The e-prescription system routed prescriptions to a local organizational pharmacy electronically by default, using patient-level data from the EDR without an option for the dentists to print the prescription or to set up an alternative external pharmacy which was capable of accepting e-prescription orders, as preferred by the patient.
Our results and those of a previous dental workflow study [2] identified that observed breakdowns in workflow largely involved specific limitations associated with the technology and design of the index EDR. Thus workflow studies are important to conduct following implementation of technology in order to identify technological elements that may contribute to workflow disruption and approaches for correcting these shortcomings in order to minimize impact on clinical care delivery.
5.2 Overview of study outcomes
Dentist-patient encounter represented the highest number of encounters in the study with 53 (as seen in ► Figure 2). The observational data collected for the dental hygienist and dental assistant providers under the three types of patient encounter did not provide us with ample amount of data to quantify the workflow analysis similar to that of the dentists. We found that the distributions of the activity groups among three types of encounters are varied. Heat map analyses, revealed correlations between patient related and intraoral-hard tissue data, as well as between talk data and treatment plan. Correlations between talk data and treatment plan are expected, due to the dentist consulting with the patient regarding the treatment plan. These data could inform improved clinical information tool design to optimize the workflow for different roles and visit types in dental practice.
5.3 Time and Motion Analysis
The time and motion plot offered data visualization for all the activities and correlation of activities with informational tasks as well as the interactions with time in each of the dental encounters. As one can see in all three ► Figures (4-6), there was much time spent, 40:41 min, 13:00 min, and 3:30 min, by the dentist working with intraoral-hard tissue during planned, emergency and initial visits, respectfully; as well as a good amount of time, 27:10 min, 24:26 min, and 19:59 min during the planned, emergency, and initial visits respectively, that had no information recorded because the dentist was outside of the dental operatory/exam room at the time. However, there was not much time spent by the dentist providing patient education or checking-in or -out a patient. Similar time and motion patterns could be identified within the same type of patient visit encounter across the providers of dentist, dental hygienist, and dental assistant.
5.4 Frequency Analysis
Frequency analysis was conducted only on the dentists’ provider as other roles with each type of patient encounter did not yield ample observational data for our analysis. According to an American Dental Association survey, dentists routinely see 2.3 patients per hour [23]. ► Figure 7 dentist data showed different distributions for the five grouped activities among different types of encounters. the dentist spent much more time talking to a patient during an initial visit (48.47%) than he/she does during a planned (16.8%) or emergency visit (26.82%). This could be because an initial visit is a scheduled, first time meeting between a patient and dental provider and a lot of information is collected verbally and the focus is on the patient, not the EDR. In our second analysis of frequencies of activities, further investigation was conducted to show which activities contributed the most to the grouped activities as reported in the first step among different types of encounters. Taking patient related activities as an example, we found that among all eight categories of patient related activity (patient examination, performing treatment, patient education/instruction, patient check-in, patient check-out, consultation, patient referral, attending another patient), the percentages of patient education/instruction and performing treatment are very distinctive among different providers in the dental center. For the initial visit, most of the time (93%) was spent on patient examination compared to 12% spent on the planned treatment and 22% spent on emergency visit. However, for the initial visit, no observed time of performing treatment is recorded, compared to 83% spent on the planned treatment and 66% spent on the emergency visit. Furthermore, for ‘walk’ and ‘miscellaneous activities’, most of the informational tasks performed by different visits have no information collected because the observers were stationary in the operatory/exam room and did not follow the dental provider or staff out of the operatory preempting analysis of the exact correlation.
5.5 Heat Map Analysis
When comparing the heat maps for dentists and dental assistants across the three different types of patient encounters, initial, planned, and emergency visits, similarities were seen among ‘talk’ related activities and information categories such intraoral-hard tissue and radiographic imaging. The same similarities were seen when comparing dental hygienists initial and planned visits, but not emergency visits because no patient encounters occurred with the dental hygienists during the study period. However, comparing the heat maps of the three roles across the three patient encounter types was not significant due to the small sample size.
5.6 Limitations
The study team observed the workflow of the dental providers and staff using a single EDR from one organization whose dental practices represented integrated community-based dental centers (Federally Qualified Health Centers) that focused primarily on the practice of general dentistry with services encompassing preventative and restorative dental procedures as well as simple extractions, with more complex cases referred to appropriate specialties or treatment settings. Further, the observational data collected did not include the specific type of procedure that was being performed by the dental provider. It would be interesting for future studies to expand on this study by observing dental providers and staff from multiple organizations using different EDR systems and record the specific procedures being done. Also, it would be hard to generalize our results for some of the encounter types like initial and emergency visits, which were observed less. We could only observe 16 emergency visit encounters (due to only two of the four dental centers accepting emergency visits) and 11 initial visit encounters during the study period. However, the 86 planned visits observed provided us significant data for analysis, which is what we expected to be the highest number of encounter type observed because it is the most common type of encounter. Of the three encounter types that included interaction in an operatory/exam room, we had expected emergency visits to have occurred the least.
Another major limitation of our observational study was that, although the two observers spent about 35 days in four dental centers that were geographically distributed in the rural parts of Wisconsin for the data collection phase, once the 120 encounters were divided into encounter types (planned, initial, emergency visits) across the roles (dentist, dental hygienist, dental assistant encounters, and appointment coordinators) for purposes of data analysis, the sub-data sets turned out to be very small for specific roles and the involved types of patient encounters. However, the study did provide an in-depth look at the dentists’ interaction with the EDR during the initial, planned, and emergency patient encounters types.
6. Conclusion
In this study, a time and motion data collection tool was developed to analyze the breakdowns in workflow of dental providers while interacting with the EDR. Time and motion methodology aided in the examination of the dental provider interaction with the EDR in a dental center environment. The themes identified from the observational data included the following workflow issues: Documenting charges, the patient waiting list schedule, EDR view and radiograph view, and e-prescribing medications. Dentists, dental hygienists, and dental assistants were found to have similar workflows in regards to the same type of patient encounter. The EDR interaction time was significantly different between dentists and dental assistants, as well as between dentists and dental hygienists. However, there was no significant difference between dental assistants and dental hygienists. On an average, dental assistants spent the most amount of time interacting with the EDR, followed by dental hygienists and dentists respectively. Dental hygienists spent the maximum amount of time with EDR data recording followed by dental assistants and dentists respectively. While dental assistants spent the maximum amount of time with EDR data retrieving/reviewing followed by dentists and dental hygienists respectively. Finally, it is important to understand the interaction of dental providers with the existing technologies at point of care to assess breakdown in the workflow which could contribute to better technology designs. Based on the results of this study, it would be beneficial for EDR vendors to focus on user-centric design of EDRs to improve user intuitiveness and minimize any workflow related breakdowns. The EDR needs to be sufficiently intuitive to facilitate data documentation and retrieval activities.
Acknowledgments
The authors thank the MCHS dental centers for their participation in this study. The authors also thank Dr. Ingrid Glurich and Ms. Dixie Schroeder for help with the final review of the manuscript. This project was supported, in part, by a grant from Delta Dental of Wisconsin, and funds from Marshfield Clinic Research Foundation and Family Health Center of Marshfield, Inc.
Footnotes
Clinical Relevance Statement
A time and motion methodology tool was used to study the human-computer interaction and workflow of dental providers with an EDR. The barriers identified in this study could: 1) inform improved clinical information system design in dental practices, and 2) be utilized by large group practices (corporate dentistry models) for purposes of workflow improvement around EDR data recording, retrieval, and time management.
Conflict of Interest
The authors declare that they have no conflicts of interest.
Human Subjects Protections
The study was approved by the Institutional Review Board (IRB) which granted a waiver of documentation of informed consent. The IRB determined that HIPAA regulations were not applicable to the study.
References
- 1.Schleyer TK, Thyvalikakath TP, Spallek H, Torres-Urquidy MH, Hernandez P, Yuhaniak J. Clinical computing in general dentistry. J Am Medical Inform Assoc 2006;13(3): 344-352. [DOI] [PMC free article] [PubMed] [Google Scholar]
- 2.Irwin JY, Torres-Urquidy MH, Schleyer T, Monaco V. A preliminary model of work during initial examination and treatment planning appointments. Br Dent J 2009; 206(1): E1. [DOI] [PubMed] [Google Scholar]
- 3.Wagner IV, Ireland RS, Eaton KA. Digital clinical records and practice administration in primary dental care. Br Dent J 2008; 204(7): 387-395. [DOI] [PubMed] [Google Scholar]
- 4.Niazkhani Z, Pirnejad H, Berg M, Aarts J. The impact of computerized provider order entry systems on inpatient clinical workflow: a literature review J Am Medical Inform Assoc 2009; 14(4): 539-549. [DOI] [PMC free article] [PubMed] [Google Scholar]
- 5.Zheng K, Haftel HM, Hirschl RB, O’Reilly M, Hanauer DA. Quantifying the impact of health IT implementation on clinical workflow: a new methodological perspective. J Am Medical Inform Assoc 2010; 17(4): 454-461. [DOI] [PMC free article] [PubMed] [Google Scholar]
- 6.HealthIT.gov. Benefits of EHRs. Improved diagnostics & patient outcomes. [updated 2014 March 19]. Available at: https://www.healthit.gov/providers-professionals/improved-diagnostics-patient-outcomes. [Accessed 2015 July 23] [Google Scholar]
- 7.Levingston SA. Opportunities in physician electronic health records: a road map for vendors. Bloomberg Government; 2012. [Google Scholar]
- 8.Why adopt EHRs? 2014 Available at: http://www.healthit.gov/providers-professionals/why-adopt-ehrs. [Accessed 2015 July 23] [Google Scholar]
- 9.Ellis CA. Workflow technology. Beaudouin-Lafon M, ed. Computer Supported Cooperative Work. Chichester, UK: John Wiley & Sons; 1999; 29–54. [Google Scholar]
- 10.Keohane CA, Bane AD, Featherstone E, Hayes J, Woolf S, Hurley A, Bates DW, Ghandi TK, Poon EG. Quantifying nursing workflow in medication administration. J Nurs Admin 2008; 38: 19–26. [DOI] [PubMed] [Google Scholar]
- 11.Wong DH, Gallegos Y, Weinger MB, Clack S., Slagle J, Andearson CT. Changes in intensive care unit nurse task activity after installation of a third-generation intensive care unit information system. Crit Care Med 2003; 31(10): 2488-2494. [DOI] [PubMed] [Google Scholar]
- 12.Overhage JM, Perkins S, Tierney WM, McConald CJ. Controlled trial of direct physician order entry: effects on physicians’ time utilization in ambulatory primary care internal medicine practices. J Am Medical Inform Assoc 2001; 8(4): 361-371. [DOI] [PMC free article] [PubMed] [Google Scholar]
- 13.Lo HG, Newmark LP, Yoon C, Volk LA, Carlson VL, Kittler AF, Lippincott M, Wang T, Bates DW. Electronic health records in specialty care: a time-motion study. J Am Medical Inform Assoc 2007; 14(5): 609-615. [DOI] [PMC free article] [PubMed] [Google Scholar]
- 14.Hollingworth W, Devine EB, Hansen RN, Lawless NM, Comstock BA, Wilson-Norton JL, Tharp KL, Sullivan SD. The impact of e-prescribing on prescriber and staff time in ambulatory care clinics: a time–motion study. J Am Medical Inform Assoc 2007; 14(6): 722730. [DOI] [PMC free article] [PubMed] [Google Scholar]
- 15.Pizziferri L, Kittler AF, Volk LA, Honour MM, Gupta S, Wang S, Lippincott M, Li Q, Bates DW. Primary care physician time utilization before and after implementation of an electronic health record: a time-motion study. J Biomedical Inform 2005; 38(3): 176-188. [DOI] [PubMed] [Google Scholar]
- 16.Starren J, Chan S, Tahil F, White T. When seconds are counted: tools for mobile, high-resolution time-motion studies. Proc AMIA Symp 2000; 833-837. [PMC free article] [PubMed] [Google Scholar]
- 17.Allen SI, Johannes RS, Brown CS, Kafonek DM, Plexico PS. Prescription-writing with a PC. Comput Methods Programs Biomed 1986; 22(1): 127-135. [DOI] [PubMed] [Google Scholar]
- 18.Asaro PV, Boxerman SB. Effects of computerized provider order entry and nursing documentation on workflow. Acad Emerg Med 2008; 15(10): 908-915. [DOI] [PubMed] [Google Scholar]
- 19.Achary A, Yoder N, Nycz G. An integrated medical-dental electronic health record environment: a Marshfield experience. Powell V, Din FM, Acharya A, Torres-Urquidy MH, eds. Integration of Medical and Dental Care and Patient Data. London: Springer-Verlag; 2012; 331-351. [Google Scholar]
- 20.Parterns Healthcare. Agency for Healthcare Research and Quality. National Resource Center fro Health Information Technology. Time and Motion Study Tool: Ambulatory Practice (TMS-AP). Available at: https://healthit.ahrq.gov/sites/default/files/docs/page/AHRQ%20NRC%20Time-Motion%20Study%20Tool%20Guide_0.pdf. [Accessed 2015 July 23] [Google Scholar]
- 21.Elo S, Kyngä H. The qualitative content analysis process. J Adv Nurs 2008; 62(1): 107-115. [DOI] [PubMed] [Google Scholar]
- 22.Fleiss JL. Statistical methods for rates and proportions. 2nd ed. New York: John Wiley & Sons, Ltd. 1981. [Google Scholar]
- 23.American Dental Association, 2014 Characteristics of private dental practices. [cited Janaury 19, 2016] 2012. available from http://www.ada.org/en/science-research/health-policy-institute/data-center/dental-practice. [Google Scholar]


