

Abstract
Background For protection against (re‐)infection by influenza virus not only the magnitude of the immune response but also its quality in terms of antibody subclass and T helper profile is important. Information about the type of immune response elicited by vaccination is therefore urgently needed.
Objectives The aim of the study was to evaluate in detail the immune response elicited by three current influenza vaccine formulations and to shed light on vaccine characteristics which determine this response.
Methods Mice were immunized with whole inactivated virus (WIV), virosomes (VS) or subunit vaccine (SU). Following subsequent infection with live virus, serum antibody titers and Th cell responses were measured. The effects of the vaccines on cytokine production by conventional and plasmacytoid dendritic cells were investigated in vitro.
Results and conclusions In Balb/c mice (Th2 prone) as well as in C57Bl/6 mice (Th1 prone), WIV induced consistently higher hemagglutination‐inhibition titers and virus‐neutralizing antibody titers than VS or SU. In contrast to VS and SU, WIV stimulated the production of the antibody subclasses IgG2a (Balb/c) and IgG2c (C57BL/6), considered to be particularly important for viral clearance, and activation of IFN‐γ‐producing T cells. Similar to live virus, WIV stimulated the production of proinflammatory cytokines by conventional dendritic cells and IFN‐α by plasmacytoid cells, while VS and SU had little effect on cytokine synthesis by either cell type. We conclude that vaccination with WIV in contrast to VS or SU results in the desired Th1 response presumably by induction of type I interferon and other proinflammatory cytokines.
Keywords: Dendritic cell, influenza virus, proinflammatory cytokines, Th1, type I interferon, vaccine
Introduction
Influenza remains one of the major infectious diseases with three to five million severe cases of illness and 250–500 000 deaths per year in industrialized countries only according to estimates of the World Health Organization. 1 Next to the yearly epidemics, there is the eminent threat of a new influenza pandemic with an estimated attack rate of 10–30% and possibly a very high death toll. 2 , 3 Vaccination has been and will be the cornerstone of influenza control in epidemic and pandemic situations.
Among the available vaccine formulations split and subunit vaccines are most frequently used for immunization against the yearly influenza epidemics. 4 Split vaccines consist of inactivated virus particles which are disrupted by treatment with detergent and/or ether. Subunit vaccines (SU) consist of the viral surface antigens purified from detergent‐disrupted virus particles. Virosomal vaccines (VS) which have been introduced on the market recently are reconstituted viral membranes consisting of the viral surface antigens inserted in a lipid bilayer thus mimicking the viral envelope. 5 , 6 In the early years of influenza vaccination, whole inactivated virus (WIV) has also been used as influenza vaccine. However, the use of WIV vaccines was largely abandoned due to a higher incidence of side effects when compared with the other formulations. Recently, WIV has regained interest in the context of pandemic vaccine development as a simple and highly immunogenic vaccine formulation. Reactogenicity of modern WIV appears to be comparable with other vaccine formulations possibly due to improved methods for virus production and purification. 7 , 8 , 9 , 10 , 11
For the evaluation of vaccine efficacy, the serum hemagglutination‐inhibition (HI) titer achieved by vaccination is currently used as the only correlate of protection. An HI titer of 40 is estimated to be associated with a 50% reduction in the risk of contracting influenza and is used as the basis for the EMEA criteria to which influenza vaccines have to comply. 4 This 50% protective titer was calculated from a number of clinical studies in which immunity was achieved by either natural infection or by vaccination with inactivated or live‐attenuated influenza vaccines. As infection as well as vaccination will induce a plethora of immune reactions, it is unclear whether HI antibodies themselves provide protection or whether their presence is simply an indication of the immune status to influenza virus. 12
Recent evidence suggests that in addition to the magnitude of the immune reaction also the quality of the immune response is important for protection. The antibody response to natural infection by influenza virus and other viruses in mice is dominated by IgG2a (or in C57BL/6 mice IgG2c). 13 , 14 , 15 , 16 By virtue of its Fc domain, murine IgG2a/2c interacts very efficiently with complement factors and activatory Fc receptors. 17 , 18 , 19 Thereby, IgG2a/2c contributes to viral clearance by activation of the complement system, stimulation of antibody‐dependent cellular cytotoxicity and clearance of opsonized virus by macrophages. 16 , 20 , 21 By contrast, IgG1 does neither activate complement efficiently nor has it a high affinity for activatory Fc receptors. 18 , 19 Recently, it was shown that IgG2a alone protects mice as efficiently from lethal challenge as a mixture of IgG1 and IgG2a. By contrast, IgG1 alone only protects from mild virus challenge but provides insufficient protection upon high dose challenge. 22
The relative contribution of Th1 and Th2 cell‐mediated effector mechanisms to protection from influenza virus‐induced lung damage and to virus clearance is still under investigation. T helper cell responses to influenza infection involve IFN‐γ‐producing Th1 cells as well as IL4‐producing Th2 cells, but Th1 responses are strongly dominant. 23 Evidence is accumulating that Th1 cells are superior to Th2 cells in providing protection against viral infection and do so by secretion of IFN‐γ and by stimulation of B cells and CD8+ T cells but also by direct perforin‐dependent cytolysis. 24 , 25 , 26 , 27 , 28 , 29 On the other hand, Th2 cells are necessary to prevent excessive lung inflammation caused by an overwhelming Th1 response. 27 In the absence of antibodies, T helper cells can provide a certain degree of cross‐protective immunity possibly by secretion of IFN‐γ which activates macrophages or by direct cytolysis of infected cells. 25 , 26 , 29 As epitopes recognized by T helper cells are more conserved than those recognized by antibodies, vaccine‐induced T helper responses might contribute decisively to the cross‐protective potential of influenza vaccines. 29
To shed more light on the quality of the immune response to different influenza vaccine formulations, we immunized mice with WIV, VS or SU vaccines and measured the induced HI titers, virus‐neutralizing antibody titers, virus‐specific IgG1 and IgG2a/2c and determined the Th1/Th2 balance by enumeration of IFN‐γ and IL4‐producing T helper cells. As the genetic background of mice is known to have a large effect on the immune response, the vaccination experiments were performed in Th1‐prone C57BL/6 mice as well as in Th2‐prone Balb/c mice. To gain insight into the mechanisms responsible for the differential reactions to the vaccines, we studied the effect of the vaccine formulations on conventional and plasmacytoid dendritic cells in vitro. These cell types are considered as the most important switches between the innate and the adaptive immune system and are essential for the induction and control of specific immune responses. Our results show that in contrast to VS and SU vaccine, WIV induces a strong immune response qualitatively resembling the response obtained after virus infection irrespective of the genetic background of the recipient. The immune response to the vaccines in vivo is likely to be related to their capability to induce the production of proinflammatory cytokines by conventional DCs and IFN‐α by plasmacytoid DCs.
Materials and methods
Mice
Ten‐ to 12‐week‐old female Balb/c mice or C57BL/6 mice, purchased from Harlan Netherlands B.V. (Zeist, the Netherlands), were used for the immunization study or alternatively for isolation of spleen cells and bone marrow cells for in vitro stimulation experiments. Animal experiments were conducted according to the guidelines provided by the Dutch Animal Protection Act, and were approved by the Committee for Animal Experimentation (DEC) of the University of Groningen.
Virus and vaccines
Egg‐derived A/Panama/2007/99 (H3N2) virus and subunit vaccine produced from this strain were a kind gift from Solvay Pharmaceuticals, Weesp, the Netherlands. WIV vaccine was produced by inactivation of virus with 0·1%β‐propiolactone (Acros Organics, Geel, Belgium) for 24 hours at 19–21°C, followed by dialysis and filtration (0·45 μm). Virosomes were produced as described previously. 5 , 6 In short, membrane lipids of β‐propiolactone‐inactivated virus were solubilized with the detergent octa (ethyleneglycol)‐n‐dodecyl monoether (C12E8) (Nikkol, Tokyo, Japan). Nucleocapsids were removed by ultracentrifugation and membranes were reconstituted by extraction of C12E8 using Biobeads (Bio‐Rad, Hercules, CA, USA). So formed virosomes were concentrated by ultracentrifugation on a 50% sucrose cushion in Hepes‐buffered saline/EDTA buffer (HNE), followed by dialysis and filtration.
Immunizations and infection
Mice were infected intranasally with 150 hemagglutination units (HAU) live A/Panama virus or were intramuscularly immunized in the hind leg with 30 μl of the different vaccine formulations each containing 5 μg of viral hemagglutinin protein (HA) in HNE buffer or received buffer only. After 28 days, serum samples were collected prior to an intranasal boost with 150 HAU live influenza virus in 10 μl divided over both nostrils. Three days hereafter mice were bled to death and spleens were collected for T helper cell evaluation.
Hemagglutination‐inhibition assay
A standard HAI assay was performed. In short, 75 μl of serum was inactivated at 56°C for 30 minutes and absorbed to 225 μl of 25% kaolin/PBS (Sigma‐Aldrich, Inc., St Louis, MO, USA) solution for 20 minutes at room temperature (RT). After centrifugation, 50 μl of supernatant was added to 50 μl of PBS in duplicate in a round‐bottom microtiter plate (Costar; Corning Inc., Corning, NY, USA) followed by two‐fold serial dilutions. Four hemagglutination units (HAU) of virus in 50 μl of PBS were added to each well and the mixtures were incubated for 40 minutes at RT. Finally, 50 μl of 1% guinea pig erythrocytes (Harlan) in PBS was added to each well and HAI titers were determined after 2 hours incubation at RT. HAI titers represent the reciprocal of the highest serum dilution yielding complete inhibition of hemagglutination. HAI titers below the detection limit were assigned with half the value of the lowest serum dilution.
Virus‐neutralization assay
Virus‐neutralizing (VN) serum antibodies were assessed by a VN assay described previously. 30 Briefly, quadruplicates of two‐fold serum dilutions in (serum‐free) cell culture medium were incubated with an equal volume containing 6·25 TCID50 virus, at 37°C for 2 hours before 100 μl of this mix was added to Maden Darby canine kidney (MDCK) cell monolayers in a microtiter plate (Costar; Corning Inc.). After overnight incubation in a humidified CO2 incubator at 37°C, cells were fixed with 80% acetone in PBS and the amount of intracellularly produced viral nucleoprotein (NP) was determined by an ELISA. Blocking was performed with 150 μl of 4% BSA (Sigma‐Aldrich) in 0·05% Tween 20/PBS (PBS/T), 45 minutes at RT, followed by washing with PBS/T. Subsequently, 100 μl of anti‐NP monoclonal antibody (mAb) (Instruchemie, Delfzijl, the Netherlands), diluted 1:8000 in 1% BSA/0·1% Tween 20/PBS, was added for 1 hour at RT, followed by washing. Bound anti‐NP mAb was detected by incubation with 100 μl of goat anti‐mouse IgG‐horseradish peroxidase conjugate (Southern Biotech, Birmingham, AL, USA), diluted 1:8000 in 1% BSA/0·1% Tween/PBS, 1 hour at RT, followed by washing and subsequent staining with o‐phenylene‐diamine‐dihydrochloride (OPD) (Eastman Kodak Company, Rochester, NY, USA). Absorbance at 492 nm (A 492) was measured with an ELISA reader (Bio‐tek Instruments, Inc., Winooski, VT, USA). VN titers were expressed as the reciprocal of the highest dilution yielding an average A 492 above the end‐point value resulting from the equation: [(average A 492 of the positive controls (infected cells) minus average A 492 of the negative controls (non‐infected cells)) divided by 2] plus the average A 492 of the negative controls.
Isotype ELISA
For detection of virus‐specific serum antibodies of different isotypes, microtiter plates (Greiner, Alphen a/d Rijn, the Netherlands) were coated with 0·2 μg of influenza subunit vaccine in 100 μl of 0·05 M carbonate–bicarbonate coating buffer (pH 9·6–9·8) per well, overnight at 37°C, followed by blocking with 2% milk in coating buffer for 45 minutes at 37°C. After washing with coating buffer and 0·05% Tween 20/PBS (PBS/T), 100 μl of serum diluted in PBS/T was applied in duplicate to the first well and serial twofold dilutions were made. A subsequent incubation for 1·5 hours at 37°C was followed by washing and incubation with 100 μl of horseradish peroxidase conjugated goat anti‐mouse IgG‐isotype antibody (Southern Biotech) for 1 hour at 37°C. Plates were washed and stained with OPD (Eastman Kodak Company). Absorbance at 492 nm (A 492) was read with an ELISA reader (Bio‐tek Instruments, Inc.). After subtraction of background levels, serum antibody concentrations were calculated by means of appropriate isotype standards (Southern Biotech) using linear regression.
ELISPOT
IFN‐γ and IL4 ELISPOT assays were performed as described before 31 with some adaptations. In short, erythrocyte‐depleted splenocytes [5 × 10⁵ cells per 100 μl of 5% FCS/50 μmβ‐mercaptoethanol/IMDM medium (Gibco, Paisley, UK)] were seeded in triplicate on a microtiter plate (Greiner), pre‐coated with anti‐IFN‐γ or anti‐IL4 capture antibodies (Pharmingen, San Diego, CA, USA) and blocked with 4% BSA/PBS (Sigma‐Aldrich). Cells were stimulated with 1 μg of A/Panama virosomes per well, overnight in a humidified CO2 incubator at 37°C. Plates were treated with 100 μl of H2O per well and kept on ice to lyze the cells. After washing with 0·02% Tween 20/PBS, biotinylated anti‐IFN‐γ or anti‐IL4 antibody (Pharmingen) was added at a concentration of 0·125 μg/ml in 2% BSA/PBS (Sigma‐Aldrich), 50 μl/well, and incubated for 1 hour at 37°C. After washing and incubation with alkaline phosphatase‐conjugated streptavidin (Pharmingen), 1:1000 diluted in 2% BSA/PBS, 100 μl/well for 1 hour at 37°C, spots were visualized with a 5‐bromo‐4‐chloro‐3‐indolylphosphate (Sigma‐Aldrich) substrate reaction immobilized in solidified agarose. Plates were scanned and spots were counted manually.
Culture of conventional DCs
Femurs from Balb/c mice were dissected and flushed with IMDM (Gibco) to collect bone marrow (BM). BM leukocytes were seeded at 2 × 10⁶ cells in a 100‐mm bacteriological Petri dish (Corning) in the presence of 200 U/ml recombinant mouse (rm) GM‐CSF (Peprotech, London, UK) as described in detail by Lutz et al. 32
After 9 days of culture, the non‐adherent cells were collected by gentle pipetting, and centrifugation at 300 g for 5 minutes at RT. FACS analysis showed over 70% of these cells to be CD11c positive, representing cDCs. 1·5 × 107 cells were seeded per culture dish (100 mm, Corning) in 10 ml fresh medium containing 100 U/ml rmGM‐CSF. To induce maturation and cytokine production, cDCs were exposed to active virus with a multiplicity of infection (MOI) of 1·5, or to different inactivated vaccine formulations (10 μg of HA per ml). After 4, 12 and 24 hours of incubation in a humidified CO2 incubator at 37°C, supernatants were collected for cytokine quantification by Luminex multiplex immunoassay.
Luminex assay
The multiplex technology (Luminex Corp., Oosterhout, the Netherlands) combines the principle of a sandwich immunoassay with fluorescent bead‐based technology, allowing individual and multiplex analysis of up to 100 different analytes in a single microtiter well. 33 The multiplex assay for six cytokines [IL1β, IL6, IL10, IL12p70, TNF‐α and IFN‐γ] was performed in 96‐well microtiter plate format according to the manufacturer’s protocol (LINCO Research, Inc, Missouri, MO, USA). Samples were analyzed on a Luminex 100 apparatus, and calculations were performed using STarStation software (Applied Cytometry Systems, Sheffield, UK).
Plasmacytoid dendritic cells
Single splenocyte suspensions were produced as described in the ELISPOT section and enriched for plasmacytoid DCs (pDCs) by depletion of T cells, B cells, NK cells and macrophages by magnetically labeling and separating CD3‐, CD19‐, CD 11b‐ and CD49b‐positive cells (Miltenyi Biotech GmbH, Bergisch Gladbach, Germany). Labelling of pDCs with anti‐mPDCA‐1‐PE antibody (Miltenyi) for FACS analysis revealed a final pDCs population constituting approximately 6% of the enriched cell population. Cell suspensions containing 1–2 × 10⁵ pDCs in 100 μl were seeded in a microtiter plate and stimulated in triplicate with an equal volume containing the appropriate amount of vaccine or live virus for 20 hours in a humidified CO2 incubator at 37°C. Culture supernatants were collected and subjected to the IFN‐α ELISA.
IFN‐α ELISA
Twofold serial dilutions of culture supernatants, starting from a fourfold primary dilution, were subjected in duplicate to an IFN‐α ELISA previously described by Lund et al., 34 except that the staining was performed with OPD (Eastman Kodak Company) and absorbance was read at 492 nm. IFN‐α concentrations were calculated from a recombinant IFN‐α standard curve performed in quadruplicate (HyCult, Biotechnology, Uden, the Netherlands) using a linear regression, and expressed in units per ml.
Statistical analysis
Statistical analysis on antibody titers was performed using the unpaired Student’s t‐test. Values of P < 0·05 and P < 0·01 were considered statistically significant or highly significant respectively.
Results
To elucidate the effect of vaccine formulation on the magnitude and the quality of the elicited immune response, mice were immunized once with 5 μg of HA derived from A/Panama/2007/99 (H3N2) virus formulated as WIV, VS or SU vaccine. Serum samples were taken 4 weeks after immunization and the hemagglutination‐inhibiting (HAI) and virus‐neutralizing (VN) capacity of the sera was determined (Table 1). In Balb/c mice, all three vaccines induced HAI titers >40, with WIV producing the highest responses. In C57BL/6 mice, HAI titers after immunization with WIV were similarly high as in Balb/c mice but were low (<40) after immunization with VS or SU. The neutralizing activities of the sera correlated with the HAI titers. In both mouse strains, they were the highest after WIV immunization. Immunization with VS or SU vaccine induced measurable virus‐neutralizing activity in Balb/c mice, whereas this activity was under the detection limit of 80 in C57BL/6 mice.
Table 1.
Hemagglutination‐inhibition titers and virus‐neutralization titers after a single immunization
| Balb/c | C57Bl/6 | |||
|---|---|---|---|---|
| HAI | VN | HAI | VN | |
| HNE | <8 | <80 | <8 | <80 |
| WIV | 256 | 691** (577–823) | 256 | 1493** (959–2457) |
| VS | 128 | 160* (125–200) | 16 | <80 |
| SU | 128 | 148* (87–234) | 16 | <80 |
Mice were immunized once i.m. with buffer only (HNE) or with 5 μg of HA formulated as WIV, VS or SU. On day 28, serum samples were taken. For HAI determination, serum samples were pooled per group (n = 9). For determination of VN titers, sera from individual mice were tested. Titer is given as geometric mean, the 95% confidence interval is indicated. Statistically significant differences (P < 0·01) are as indicated: ** compared with VS, SU or HNE, *compared with HNE.
Twenty‐eight days after immunization, the mice were infected intranasally with live A/Panama virus and early memory responses were determined 3 days later. Infection with A/Panama virus does not lead to symptomatic disease in mice, but induces nevertheless humoral and cellular immune responses. Intranasal administration of live A/Panama virus boosted the vaccine‐induced HAI and VN titers in either mouse strain (Figure 1). In Balb/c mice immunization with all three vaccines resulted in high HAI titers and VN titers after virus exposure (Figure 1, left panels). Yet, titers in WIV‐immunized mice were higher than in VS‐ and SU‐immunized animals. These differences were statistically significant for HAI titers after WIV vs SU immunization (P < 0·05) and for VN titers compared between WIV and VS as well as WIV and SU (P < 0·01). In C57BL/6 mice, only WIV induced consistently high HAI and VN titers in all immunized mice, whereas VS or SU resulted in measurable HAI and VN titers in only some of the immunized animals (Figure 1, right panels). Differences in titer between WIV‐ and VS‐ or SU‐immunized mice were highly significant (P < 0·01) in all cases. Taken together, these results show that WIV is more immunogenic than VS or SU irrespective of the mouse strain studied.
Figure 1.
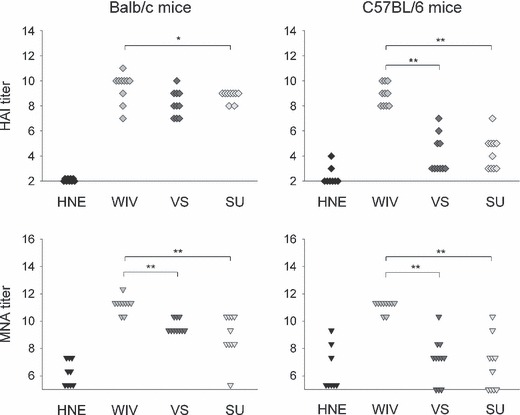
HAI titers and VN titers after immunization followed by virus challenge. Mice (9–10/experimental group) were injected i.m. with buffer (HNE) or were vaccinated by i.m. injection on day 0 with 5 μg of HA derived from strain A/Panama/2007/99 (H3N2) formulated as WIV, VS or SU vaccine and were i.n. infected on day 28 with A/Panama virus. Three days later mice were killed. HAI titers and VN titers were determined in individual sera as described in Materials and methods. Results are given as log2 titers. The detection limit was 2 for HAI determination and 5·3 for VN determination. Significant (P < 0·05) and highly significant (P < 0·01) differences between WIV and the other vaccine formulations are indicated by * and ** respectively.
The quality of the vaccine‐induced immune response was investigated by determination of the IgG subclass profile and enumeration of IFN‐γ‐ and IL4‐producing T helper cells. As a reference, we included in these studies mice that were immunized by exposure to live virus 28 days prior to virus challenge. Determination of IgG subclasses by ELISA revealed that Balb/c mice which had earlier been exposed to live virus produced similar amounts of IgG1 and IgG2a. Immunization with WIV resulted in the production of substantial amounts of IgG2a but little IgG1 (Figure 2). Production of antibodies in response to immunization with VS or SU vaccine was lower and the antibodies synthesized were almost exclusively of the IgG1 subclass. C57BL/6 mice express the antibody subclass IgG2c instead of IgG2a. IgG2c was produced after exposure to live virus and especially after immunization with WIV, but was not induced by VS or SU. IgG1 responses to virus and WIV in C57BL/6 mice were similar to those in Balb/c mice, while IgG1 responses to VS and SU were lower.
Figure 2.
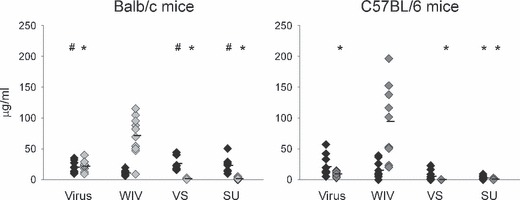
IgG subtypes after immunization and subsequent virus challenge. Mice were treated as described in the caption to Figure 1. An additional group of mice was i.n. infected on day 0 with 150 HAU of live A/Panama virus (virus) and received a second dose of virus 150 HAU on day 28. IgG1 (black diamonds) and IgG2a (light gray diamonds) or IgG2c (dark gray diamonds) were determined by an ELISA and amounts were calculated using IgG1, IgG2a and IgG2c standards. Responses significantly lower or higher than those induced by WIV (P < 0·05) are indicated by # and * respectively.
To gain further insight into the quality of the immune response induced by the three different vaccines in relation to virus exposure, T helper responses were measured (Figure 3). After earlier virus exposure or immunization with WIV, Balb/c mice as well as C57BL/6 mice generated large numbers of IFN‐γ‐producing cells after challenge. IL4‐producing cells were also detected, although in much lower amounts. By contrast, the T helper responses to VS and SU vaccine were either balanced or dominated by IL4‐producing cells. The number of IFN‐γ‐producing cells in VS‐ or SU‐immunized mice was significantly lower than in WIV‐immunized mice except for VS‐immunized Balb/c mice (P < 0·01 in all cases). IFN‐γ and IL4 are regarded as signature cytokines of Th1 and Th2 cells respectively. We therefore used the results of the ELISPOT assays to calculate ratios of Th1‐ and Th2‐type cytokine‐producing cells (Th1/Th2 ratios). Ratios were calculated for individual mice and the average and standard deviation were determined per experimental group (Figure 4). As was found for virus‐exposed mice, the mean Th1/Th2 ratio was >>1 for all mice immunized with WIV with mean ratios of 2·68 for Balb/c mice and 3·51 for C57BL/6 mice. By contrast, Th1/Th2 ratios in VS‐ and SU‐immunized mice were close to 1 or lower than 1 and in each of these experimental groups, a minority of the mice showed ratios >1. Taken together the results of the immunization experiments indicate that immunization with WIV induces a Th1 response with induction of IgG2a‐ and IFN‐γ‐producing T helper cells. At least with respect to the T helper cells this response resembles that observed after exposure to live virus. By contrast, VS and SU vaccines induce Th2 responses dominated by IgG1 and IL4.
Figure 3.
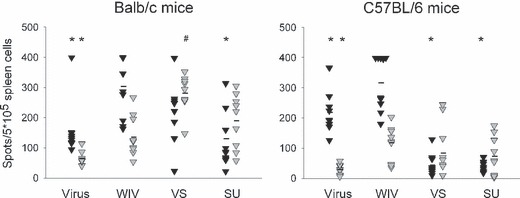
T helper responses after immunization followed by virus challenge. Splenocytes obtained from the mice described in the legend to Figure 1 were used to perform ELISPOT assays for enumeration of IFN‐γ‐ (black triangles) and IL4 (gray triangles)‐producing T helper cells. Cells were stimulated overnight before lysis and detection of the respective cytokines. Responses significantly lower or higher than those induced by WIV (P < 0·05) are indicated by # and * respectively.
Figure 4.
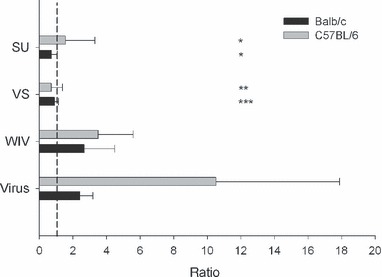
Ratios of IFN‐γ‐ and IL4‐producing T cells (Th1/Th2 ratio) after immunization and challenge. Ratios were calculated for each individual mouse and are given as mean (±SD) per experimental group. A ratio of 1 representing a perfectly balanced response is indicated by a stipple line. ***3/9 mice ratio >1, **2/10 mice ratio >1, *1/10 mice ratio >1.
As dendritic cells (DCs) are important for the polarization of Th cells into Th1 or Th2, the effect of the three vaccine formulations on conventional DCs (cDCs) and plasmacytoid DCs (pDCs) was evaluated in vitro. cDCs were generated from Balb/c bone marrow cells by culture in the presence of GM‐CSF for 10 days. When exposed to live virus or WIV these cells produced substantial amounts of the proinflammatory cytokines IL1β, IL6 and TNF‐α (Figure 5). Exposure to VS also induced these cytokines, although to lower extents, while exposure to SU had little or no effect on cytokine secretion. Active virus and WIV also induced the secretion of IL12, being known as a key inducer of cellular immune responses. In contrast to the proinflammatory cytokines which were present early after exposure, secretion of IL12 was retarded. Similarly, secretion of IL10, mainly involved in control of the immune response, was found at later time points after the start of the exposure. IFN‐γ, which is an important mediator of cellular immune responses and stimulates the production of IgG2a was not secreted after exposure to either of the vaccines. This result is in line with an earlier study which reports on in vitro production of IFN‐γ by bone marrow DCs cultured in GM‐CSF + IL‐15 but not DCs cultured in GM‐CSF only as used here. 35
Figure 5.
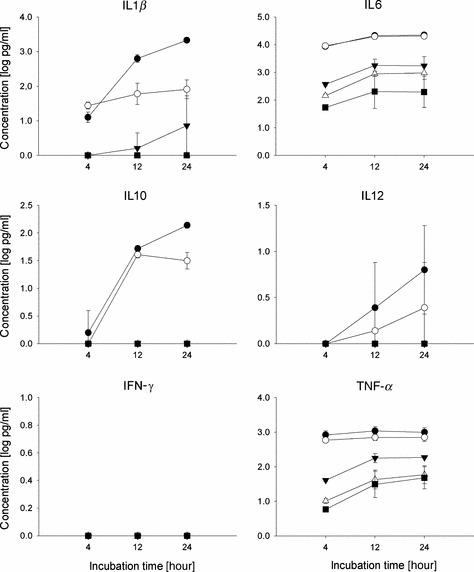
Cytokine production of conventional DCs upon exposure to virus or vaccines. Bone marrow cells were cultured for 9 days with GM‐CSF to obtain cDCs. On day 9, cells were exposed to live influenza virus (closed circles), WIV (open circles), VS (closed triangles) or SU (open triangles) for the periods indicated or were left untreated (black squares). Supernatants were harvested and cytokines were determined using Luminex technology. Results shown are the mean of two independent experiments. Each supernatant was measured in duplicate.
pDCs have been described as the major producers of type I interferon during virus infection. 36 A pDC‐enriched cell population was prepared from splenocytes of naïve Balb/c mice and the cells were incubated with 0·01, 0·1, 1 or 10 μg of HA formulated as active virus or WIV, VS or SU vaccine respectively (Figure 6A). Cells incubated with active virus or WIV produced substantial amounts of IFN‐α. These amounts peaked at a HA concentration of 0·1 μg/ml but were lower for lower as well as higher antigen doses. By contrast, pDCs incubated with VS or SU vaccine did not produce detectable amounts of IFN‐α at any of the antigen concentrations used. IFN‐α production in reaction to WIV was also observed in crude splenocyte preparations, but amounts increased significantly upon pDC enrichment indicating pDCs as a major source of IFN‐α (Figure 6B). Similar to spleen‐derived pDCs from Balb/c mice, pDCs derived from bone marrow of C57BL/6 mice by culture with Flt3 ligand produced IFN‐α upon exposure to WIV but not to SU vaccine (Figure 6C). These data indicate that the differential reaction to the different vaccine formulations is independent of the source of the pDCs and the strain of mice. In conclusion, WIV is superior to VS and SU in activating cDCs as well as pDCs to produce cytokines that can modulate the extent and the phenotype of adaptive immune responses.
Figure 6.

Production of IFN‐α by plasmacytoid DCs after exposure to virus or vaccines. (A) Splenocytes derived from Balb/c mice were enriched for pDCs as described in Materials and methods. Cells were incubated for 20 hours with the indicated amounts of HA using either live virus (filled circles), WIV (open circles), VS (filled triangles) or SU vaccine (open triangles). Supernatants were harvested and IFN‐α was determined by a sandwich ELISA. Results of a representative experiment are shown. (B) Crude splenocytes (black bar) and splenocytes enriched for pDCs as above (gray bar) were incubated for 20 hours with 0·1 μg of WIV. Supernatants were analysed for IFN‐α as above. (C) Flt3 ligand cultured bone marrow cells were exposed to 0·1 μg of WIV (white bar) or SU vaccine (black bar for 20 hours and IFN‐α in the supernatants was analyzed as above.
Discussion
In this paper, we show that, using the same amount of HA, immunization of mice with WIV results in higher HAI and VN titers than immunization with VS or SU. Moreover, the quality of the response to the vaccines differs profoundly. While WIV elicits a Th1 response reminiscent of that found after virus infection, VS and SU induce typical Th2 responses. The observed differences in the amounts and subtypes of the induced antibodies and the phenotypes of the T‐cell responses to the different vaccine formulations were independent of antigen dose as revealed by dose–response studies using antigen amounts as low as 0·04 μg (results not shown). The responses found in vivo reflected the effects of the vaccines on dendritic cells in vitro. Similar to active virus, WIV induced the synthesis of various cytokines by cDCs and stimulated the production of type I interferon by pDCs. By contrast, VS and SU had only moderate‐to‐low effects on DCs in vitro.
Similar to the results obtained in the murine system reported here, higher HAI titers in response to WIV when compared with the other formulations have also been reported from human clinical trials especially when the study population was naive to the vaccine strain used. 7 , 37 , 38 , 39 The superior immunogenicity of WIV could be of great importance in a pandemic situation when protective immune responses against a new virus variant have to be achieved with a minimum amount of antigen.
Evidence is accumulating that not only the magnitude of the immune response but also its quality is important for protection. In the murine system, IgG2a was found recently to have a greater protective potential than IgG1 (see Ref. 22; Bungener et al., unpublished observations]. Moreover, Th1 cells can protect from lung damage while Th2 cells can be deleterious. 24 , 26 , 27 , 28 These observations imply that the vaccine‐induced immune response should ideally be of a type I phenotype. In the murine system, the present study and studies of others show that only WIV but not split, VS or SU vaccine can induce the desired type I response. 40 , 41 , 42 , 43 In the human situation, the quality of the evoked immune response has so far largely been neglected. HAI titers, and for H5N1 trials VN titers, are usually the only correlates of protection measured in clinical studies. As vaccines can differ profoundly in the type of response they evoke and as this type can have important implications for protection, we strongly recommend including the determination of immune response quality in future clinical studies.
Interestingly, the differences we found in the immune response to active virus and WIV on the one hand and VS and SU on the other hand correlated with the effect of these agents on dendritic cells in vitro. DCs are considered as the most important antigen‐presenting cells and are the only cells that can activate naive T cells (for reviews, see Refs 44, 45, 46). Moreover, they are involved in the polarization of naive T cells to a Th1 or Th2 phenotype, respectively, and do so by the secretion of defined cytokines (for a review, see Ref. 47). We used bone marrow cells cultured with GM‐CSF to generate cDCs in vitro. Only when incubated with active virus or WIV, these cells produced substantial amounts of cytokines. These included IL12 which is considered as necessary to activate IFN‐γ production by Th1 cells. 35 Virus and WIV also induced the production of the proinflammatory cytokines IL1β, IL6 and TNF‐α. These cytokines were also found to be upregulated in human DCs incubated with live influenza virus. 48 Notably, IL10 which is involved in the control of the immune response and considered as a Th2 cytokine was also induced by virus and WIV, although at later time points as the proinflammatory cytokines. cDC‐derived cytokines are very important for activating, directing and controlling adaptive immune responses. The higher and qualitatively different immune responses evoked by WIV when compared with the other vaccines might therefore – at least partly – be explained by stronger effects of WIV on cDCs.
pDCs are less active in antigen presentation than cDCs. However, they are highly important in the innate defense of virus infections as they can produce large amounts of type I interferons, particularly IFN‐α upon exposure to virus. 36 , 49 , 50 In our assays, pDCs exposed to active virus and WIV produced similar amounts of IFN‐α, whereas neither VS nor SU induced any IFN‐α synthesis. Type I interferons are major inducers of activation of immature DCs and lead to the upregulation of MHC molecules, chemokines, chemokine receptors and co‐stimulatory molecules. 50 Moreover, they exert direct effects on B and T cells thus affecting antibody secretion and antibody class switching. 51 Type I IFNs have been described as natural adjuvants. When added during immunization with influenza vaccine, type I IFN enhanced IgG1 but especially IgG2a responses and significantly improved survival of the mice after virus challenge. 52 We therefore consider it likely that IFN‐α, presumably produced by pDCs, upon immunization with WIV but not VS or SU vaccine is responsible for the enhanced immune response and the dominant Th1 reaction.
Together with studies of others comparing split vaccine with WIV, 41 , 42 , 43 our current investigations allow interesting conclusions on the parameters which determine vaccine immunogenicity. Split vaccine and WIV both contain all the viral components yet they elicit very different immune responses indicating that not only vaccine composition but also the physical structure of the vaccine (soluble versus particulate) is important. On the other hand, virosomes and WIV sharing the particulate structure but differing in their composition also induce very different responses. From these results, we conclude that it is the combination of vaccine components present and their physical organization which determines the immunological properties of a vaccine. Interestingly, WIV and active virus elicited quantitatively and qualitatively similar responses indicating that the structural integrity of the virus particles is more important for the immune response than the presence or absence of virus replication. The exact mechanisms by which active virus and the vaccines induce the differential production of DC cytokines are so far unclear. It is tempting to speculate that stimulation of pathogen‐associated molecular pattern (PAMP) receptors is involved. Elucidation of these mechanisms is highly interesting in the context of rational vaccine development and will be approached in a follow‐up study.
In conclusion, we showed that WIV vaccine induces a stronger and more Th1‐skewed immune response than VS and SU vaccines most probably due to direct action of the vaccine on conventional as well as plasmacytoid DCs. Due to its enhanced immunogenicity WIV can induce protective immune responses at lower antigen doses. Moreover, the type of the immune response elicited by WIV has proven to provide better protection in animal models. We therefore consider WIV as a highly attractive vaccine candidate especially in a pandemic situation.
Conflict of interest
JW has acted as a paid consultant to Solvay Pharamceuticals, Weesp, the Netherlands. He has received reimbursement for attending symposia, fees for speaking, funds for research, funds as a member of staff and fees for consulting. AH has received reimbursement for attending symposium from Solvay Pharmaceuticals. Weesp, the Netherlands.
Acknowledgements
We thank Solvay Pharmaceuticals, Weesp, the Netherlands, for generous gifts of influenza virus and subunit vaccine. Bert Dontje and Jacqueline de Vries‐Idema are acknowledged for technical assistance. This study was conducted under the auspices of the Netherlands Influenza Vaccine Research Centre (NIVAREC), financially supported by the Netherlands Organisation for Health Research and Development (ZonMw), and under the auspices of the VIRGO research consortium financed by the Netherlands Genomics Initiative funded by the Dutch BSIK program.
References
- 1. Stöhr K, Kieny M, Wood D. Influenza pandemic vaccines: how to ensure a low‐cost, low‐dose option. Nat Rev Micro 2006; 4:565–566. [DOI] [PubMed] [Google Scholar]
- 2. World Health Organization . Avian influenza assessing the pandemic threat, 2005. Available at: http://www.who.int/crs/desease/infuenza/WHO_CDS_2005_29/en/. [Google Scholar]
- 3. Murray CJ, Lopez AD, Chin B, Feehan D, Hill KH. Estimation of potential global influenza mortality on the basis of vital registry data from the 1918–20 pandemic: a quantitative analysis. Lancet 2006; 368:2211–2218. [DOI] [PubMed] [Google Scholar]
- 4. Wilschut JC, McElhaney JE, Palache AM. Vaccination: cornerstone of influenza control In: Wilschut JC, McElhaney JE, Palache AM, eds. Influenza. Amsterdam: Elsevier, 2006; 150–183. [Google Scholar]
- 5. Stegmann T, Morselt HW, Booy FP, Van Breemen JF, Scherphof G, Wilschut J. Functional reconstitution of influenza virus envelopes. EMBO J 1987; 6:2651–2659. [DOI] [PMC free article] [PubMed] [Google Scholar]
- 6. Huckriede A, Bungener L, Daemen T, Wilschut J. Influenza virosomes in vaccine development. Meth Enzymol 2003; 373:74–91. [DOI] [PubMed] [Google Scholar]
- 7. Stephenson I, Nicholson KG, Glück R et al. Safety and antigenicity of whole virus and subunit influenza A/Hong Kong/1073/99 (H9N2) vaccine in healthy adults: phase I randomised trial. Lancet 2003; 362:1959–1966. [DOI] [PubMed] [Google Scholar]
- 8. Hehme N, Engelmann H, Kuenzel W, Neumeier E, Saenger R. Immunogenicity of a monovalent, aluminum‐adjuvanted influenza whole virus vaccine for pandemic use. Virus Res 2004; 103:163–171. [DOI] [PubMed] [Google Scholar]
- 9. Hehme N, Engelmann H, Kunzel W, Neumeier E, Sanger R. Pandemic preparedness: lessons learnt from H2N2 and H9N2 candidate vaccines. Med Microbiol Immunol (Berl) 2002; 191:203–208. [DOI] [PubMed] [Google Scholar]
- 10. Bresson J, Perronne C, Launay O et al. Safety and immunogenicity of an inactivated split‐virion influenza A/Vietnam/1194/2004 (H5N1) vaccine: phase I randomised trial. Lancet 2006; 367:1657–1664. [DOI] [PubMed] [Google Scholar]
- 11. Lin J, Zhang J, Dong X et al. Safety and immunogenicity of an inactivated adjuvanted whole‐virion influenza A (H5N1) vaccine: a phase I randomised controlled trial. Lancet 2006; 368:991–997. [DOI] [PubMed] [Google Scholar]
- 12. De Jong JC, Palache AM, Beyer WE, Rimmelzwaan GF, Boon AC, Osterhaus AD. Haemagglutination‐inhibiting antibody to influenza virus. Dev Biol (Basel) 2003; 115:63–73. [PubMed] [Google Scholar]
- 13. Coutelier JP, Van Der Logt JT, Heessen FW, Warnier G, Van Snick J. IgG2a restriction of murine antibodies elicited by viral infections. J Exp Med 1987; 165:64–69. [DOI] [PMC free article] [PubMed] [Google Scholar]
- 14. Hocart MJ, Mackenzie JS, Stewart GA. The immunoglobulin G subclass response of mice to influenza A virus: the effect of mouse strain, and the neutralizing abilities of individual protein A‐purified subclass antibodies. J GenVirol 1998; 70:2439–2448. [DOI] [PubMed] [Google Scholar]
- 15. Fazekas G, Rosenwirth B, Dukor P, Gergely J, Rajnavolgyi E. IgG isotype distribution of local and systemic immune responses induced by influenza virus infection. Eur J Immunol 1994; 24:3063–3067. [DOI] [PubMed] [Google Scholar]
- 16. Huber VC, Lynch JM, Bucher DJ, Le J, Metzger DW. Fc receptor‐mediated phagocytosis makes a significant contribution to clearance of influenza virus infections. J Immunol 2001; 166:7381–7388. [DOI] [PubMed] [Google Scholar]
- 17. Neuberger MS, Rajewsky K. Activation of mouse complement by monoclonal mouse antibodies. Eur J Immunol 1981; 11:1012–1016. [DOI] [PubMed] [Google Scholar]
- 18. Heusser CH, Anderson CL, Grey HM. Receptors for IgG: subclass specificity of receptors on different mouse cell types and the definition of two distinct receptors on a macrophage cell line. J Exp Med 1977; 145:1316–1327. [DOI] [PMC free article] [PubMed] [Google Scholar]
- 19. Gessner JE, Heiken H, Tamm A, Schmidt RE. The IgG Fc receptor family. Ann Hematol 1998; 76:231–248. [DOI] [PubMed] [Google Scholar]
- 20. Mozdzanowska K, Feng J, Eid M, Zharikova D, Gerhard W. Enhancement of neutralizing activity of influenza virus‐specific antibodies by serum components. Virology 2006; 352:418–426. [DOI] [PubMed] [Google Scholar]
- 21. Jayasekera JP, Moseman EA, Carroll MC. Natural antibody and complement mediate neutralization of influenza virus in the absence of prior immunity. J Virol 2007; 81:3487–3494. [DOI] [PMC free article] [PubMed] [Google Scholar]
- 22. Huber VC, McKeon RM, Brackin MN et al. Distinct contributions of vaccine‐induced immunoglobulin G1 (IgG1) and IgG2a antibodies to protective immunity against influenza. Clin Vaccine Immunol 2006; 13:981–990. [DOI] [PMC free article] [PubMed] [Google Scholar]
- 23. Brown D, Roman E, Swain S. CD4 T cell responses to influenza infection. Sem Immunol 2004; 16:171–177. [DOI] [PubMed] [Google Scholar]
- 24. Moran TM, Isobe H, Fernandez‐Sesma A, Schulman JL. Interleukin‐4 causes delayed virus clearance in influenza virus‐infected mice. J Virol 1996; 70:5230–5235. [DOI] [PMC free article] [PubMed] [Google Scholar]
- 25. Moran TM, Park H, Fernandez‐Sesma A, Schulman JL. Th2 responses to inactivated influenza virus can be converted to Th1 responses and facilitate recovery from heterosubtypic virus infection. J Infect Dis 1999; 180:579–585. [DOI] [PubMed] [Google Scholar]
- 26. Bot A, Bot S, Bona C. Protective role of gamma interferon during the recall response to influenza virus. J Virol 1998; 72:6637–6645. [DOI] [PMC free article] [PubMed] [Google Scholar]
- 27. Bot A, Holz A, Christen U et al. Local IL‐4 expression in the lung reduces pulmonary influenza‐virus‐specific secondary cytotoxic T cell responses. Virology 2000; 269:66–77. [DOI] [PubMed] [Google Scholar]
- 28. Thomas PG, Keating R, Hulse‐Post DJ, Doherty PC. Cell‐mediated protection in influenza infection. Emerg Infect Dis 2006; 12:48–54. [DOI] [PMC free article] [PubMed] [Google Scholar]
- 29. Swain S, Agrewala J, Brown D et al. CD4+ T‐cell memory: generation and multi‐faceted roles for CD4+ T cells in protective immunity to influenza. Immunol Rev 2006; 211:8–22. [DOI] [PMC free article] [PubMed] [Google Scholar]
- 30. Rowe T, Abernathy RA, Hu‐Primmer J et al. Detection of antibody to avian influenza A (H5N1) virus in human serum by using a combination of serologic assays. J Clin Microbiol 1999; 37:937–943. [DOI] [PMC free article] [PubMed] [Google Scholar]
- 31. Bungener L, Huckriede A, De Mare A, De Vries‐Idema J, Wilschut J, Daemen T. Virosome‐mediated delivery of protein antigens in vivo: efficient induction of class I MHC‐restricted cytotoxic T lymphocyte activity. Vaccine 2005; 23:1232–1241. [DOI] [PubMed] [Google Scholar]
- 32. Lutz M, Kukutsch N, Ogilvie A et al. An advanced culture method for generating large quantities of highly pure dendritic cells from mouse bone marrow. J Immunol Methods 1999; 223:77–92. [DOI] [PubMed] [Google Scholar]
- 33. Vignali DA. Multiplexed particle‐based flow cytometric assays. J Immunol Methods 2000; 243:243–255. [DOI] [PubMed] [Google Scholar]
- 34. Lund JM, Alexopoulou L, Sato A et al. Recognition of single‐stranded RNA viruses by Toll‐like receptor 7. Proc Natl Acad Sci U S A 2004; 101:5598–5603. [DOI] [PMC free article] [PubMed] [Google Scholar]
- 35. Feili‐Hariri M, Falkner D, Morel P. Polarization of naive T cells into Th1 or Th2 by distinct cytokine‐driven murine dendritic cell populations: implications for immunotherapy. J Leukocyte Biol 2005; 78:656–664. [DOI] [PubMed] [Google Scholar]
- 36. Barchet W, Blasius A, Cella M, Colonna M. Plasmacytoid dendritic cells: in search of their niche in immune responses. Immunol Res 2005; 32:75–83. [DOI] [PubMed] [Google Scholar]
- 37. Kark JD, Lebiush M, Rannon L, Witztum E, Nili E, Kedem R. The antigenicity of whole virus versus subunit trivalent influenza vaccines – a field trial in the Israel Defence Forces, 1978. Med Microbiol Immunol 1981; 170:55–62. [DOI] [PubMed] [Google Scholar]
- 38. Balkovic ES, Florack JA, Six HR. Immunoglobulin G subclass antibody responses of mice to influenza virus antigens given in different forms. Antiviral Res 1987; 8:151–160. [DOI] [PubMed] [Google Scholar]
- 39. Bernstein DI, Zahradnik JM, DeAngelis CJ, Cherry JD. Clinical reactions and serologic responses after vaccination with whole‐virus or split‐virus influenza vaccines in children aged 6 to 36 months. Pediatrics 1982; 69:404–408. [PubMed] [Google Scholar]
- 40. McElhaney JE, Meneilly GS, Lechelt KE, Beattie BL, Bleackley RC. Antibody response to whole‐virus and split‐virus influenza vaccines in successful ageing. Vaccine 1993; 11:1055–1060. [DOI] [PubMed] [Google Scholar]
- 41. Hovden AO, Cox RJ, Haaheim LR. Whole influenza virus vaccine is more immunogenic than split influenza virus vaccine and induces primarily an IgG2a response in BALB/c mice. Scand J Immunol 2005; 62:36–44. [DOI] [PubMed] [Google Scholar]
- 42. Hovden AO, Cox RJ, Madhun A, Haaheim LR. Two doses of parenterally administered split influenza virus vaccine elicited high serum IgG concentrations which effectively limited viral shedding upon challenge in mice. Scand J Immunol 2005; 62:342–352. [DOI] [PubMed] [Google Scholar]
- 43. Szyszko E, Brokstad K, Cox RJ, Hovden AO, Madhun A, Haaheim LR. Impact of influenza vaccine formulation with a detailed analysis of the cytokine response. Scand J Immunol 2006; 64:467–475. [DOI] [PubMed] [Google Scholar]
- 44. Guermonprez P, Valladeau J, Zitvogel L, Théry C, Amigorena S. Antigen presentation and T cell stimulation by dendritic cells. Annu Rev Immunol 2002; 20:621–667. [DOI] [PubMed] [Google Scholar]
- 45. Shortman K, Liu Y‐J. Mouse and human dendritic cell subtypes. Nat Rev Immunol 2002; 2:151–161. [DOI] [PubMed] [Google Scholar]
- 46. Lopéz C, Yount J, Moran T. Toll‐like receptor‐independent triggering of dendritic cell maturation by viruses. J Virol 2006; 80:3128–3134. [DOI] [PMC free article] [PubMed] [Google Scholar]
- 47. Moser M, Murphy KM. Dendritic cell regulation of TH1–TH2 development. Nat Immunol 2000; 1:199–205. [DOI] [PubMed] [Google Scholar]
- 48. Huang Q, Liu D, Majewski P et al. The plasticity of dendritic cell responses to pathogens and their components. Science 2001; 294:870–875. [DOI] [PubMed] [Google Scholar]
- 49. Asselin‐Paturel C, Boonstra A, Dalod M et al. Mouse type I IFN‐producing cells are immature APCs with plasmacytoid morphology. Nat Immunol 2001; 2:1144–1150. [DOI] [PubMed] [Google Scholar]
- 50. Theofilopoulos AN, Baccala R, Beutler B, Kono DH. Type I interferons (alpha/beta) in immunity and autoimmunity. Annu Rev Immunol 2005; 23:307–336. [DOI] [PubMed] [Google Scholar]
- 51. Le Bon A, Thompson C, Kamphuis E et al. Cutting edge: enhancement of antibody responses through direct stimulation of B and T cells by type I IFN. J Immunol 2006; 176:2074–2078. [DOI] [PubMed] [Google Scholar]
- 52. Proietti E, Bracci L, Puzelli S et al. Type I IFN as a natural adjuvant for a protective immune response: lessons from the influenza vaccine model. J Immunol 2002; 169:375–383. [DOI] [PubMed] [Google Scholar]