

Abstract
Please cite this paper as: Lloyd et al. (2011) Experimental transmission of avian‐like swine H1N1 influenza virus between immunologically naïve and vaccinated pigs. Influenza and Other Respiratory Viruses 5(5), 357–364.
Background Infection of pigs with swine influenza has been studied experimentally and in the field; however, little information is available on the natural transmission of this virus in pigs. Two studies in an experimental transmission model are presented here, one in immunologically naïve and one in a combination of vaccinated and naïve pigs.
Objectives To investigate the transmission of a recent ‘avian‐like’ swine H1N1 influenza virus in naive piglets, to assess the antibody response to a commercially available vaccine and to determine the efficiency of transmission in pigs after vaccination.
Methods Transmission chains were initiated by intranasal challenge of two immunologically naïve pigs. Animals were monitored daily for clinical signs and virus shedding. Pairs of pigs were sequentially co‐housed, and once virus was detected in recipients, prior donors were removed. In the vaccination study, piglets were vaccinated and circulating antibody levels were monitored by haemagglutination inhibition assay. To study transmission in vaccinates, a pair of infected immunologically naïve animals was co‐housed with vaccinated recipient pigs and further pairs of vaccinates were added sequentially as above. The chain was completed by the addition of naive pigs.
Results and conclusions Transmission of the H1N1 virus was achieved through a chain of six pairs of naïve piglets and through four pairs of vaccinated animals. Transmission occurred with minimal clinical signs and, in vaccinates, at antibody levels higher than previously reported to protect against infection.
Keywords: Influenza, naïve, pigs, transmission, vaccinated
Introduction
Three subtypes of swine influenza virus (SIV) circulate and cause disease in Europe, H1N1, H3N2 and H1N2. 1 , 2 , 3 These strains differ from those isolated in North America and various lineages can be distinguished within each subtype. 4 The ‘avian‐like’ H1N1 viruses were first isolated in continental Europe in 1979 and spread to the UK in 1992. 5 , 6 , 7 , 8 All eight gene segments are of avian origin, 9 , 10 indicating transmission of an avian virus to pigs. 4 These viruses were found to be antigenically distinguishable from classical swine H1N1 viruses and have since become widespread. 11 , 12 , 13 , 14 They contributed two gene segments to the current human pandemic virus. 15
The severity of SIV disease generally varies with the age and immune status of the pig, the virus isolate involved and the presence or absence of concurrent infections. Typical clinical signs include pyrexia, lethargy, nasal/ocular discharge, dyspnoea, coughing, sneezing and weight loss. SIV can cause epidemics with disease spreading throughout a whole herd, typically with rapid recovery and no complicating factors.
Transmission experiments allow a variety of questions regarding transmission dynamics to be answered, as well as permitting studies of virus evolution. There are reports of mammalian models for influenza transmission in the ferret and guinea pig, 16 , 17 , 18 , 19 but the virus does not consistently transmit between mice. 18 Transmission of the recent human pandemic H1N1 and SIV H1N2 has been demonstrated in pigs; 20 , 21 however, there are few reports of the transmission dynamics of endemic SIV in the natural host under experimental conditions.
Our aim was to characterise the transmission of ‘avian‐like’ H1N1 SIV in both immunologically naïve and partially immune pigs. Two transmission experiments are described here, the first of which was conducted in naïve piglets. A pair of pigs was challenged with a recent isolate of avian‐like H1N1 SIV and then transmitted virus to subsequent pairs of naïve piglets that were co‐housed with them. In the second experiment, the decline of circulating antibodies induced by two doses of a commercially available SIV vaccine was first determined. Transmission of the same virus through these previously vaccinated pigs was then determined, with naïve pigs included at the end of the transmission chain.
Materials and methods
Containment facilities
Animal experiments were carried out in the BCL 3 containment facilities at the Animal Health Trust. For experiment 1, two separate containment rooms were used for each phase in the study: one for the acclimatisation phase to hold clean pigs, the second to hold the transmission phase pigs. Gross pathological examinations were undertaken in a third area of the building. For the transmission phase of experiment 2, three separate containment rooms were used: a clean room, a transmission room and an additional holding room, in which pigs were monitored after leaving the transmission chain. Rooms were maintained at 16 ± 4°C and 55% humidity. Naive piglets were provided with an infra‐red heat lamp for additional heat. The air from each room was exhausted through high‐efficiency (HEPA) sterilising filters at 18–20 changes per hour. The pigs in each containment room were cared for by a different group of personnel, observing standard biosecurity procedures.
Pig supply, accommodation and husbandry
Commercial Hibred piglets, landrace × large white cross aged 4–5 weeks, were sourced from a high health status farm. Pregnant sows and their litters were screened for porcine reproductive and respiratory syndrome (PRRS) and antibodies against influenza subtypes H1N1, H3N2 and H1N2 and confirmed to be seronegative.
Pigs were allowed 3–7 days to acclimatise in the containment unit, and each pig was assessed by a veterinarian to ensure fitness prior to challenge. Enrichment equipment was supplied to alleviate boredom, discourage fighting and to increase interaction and thus aid virus transmission. Pigs were kept in groups of at least two throughout the experiments. Clean barley straw and dust‐free bedding were provided, water was supplied ad libitum and pigs were fed on commercial pelleted diet. Animals were checked twice daily for signs of ill health. During the vaccination phase, vaccinated and same aged naïve pigs were housed in an open barn on deep straw bedding.
All procedures were approved by the ethical review committee of the Animal Health Trust and conducted under licence from the Home Office under the Animals (Scientific Procedures) Act 1986.
Challenge virus
A/sw/England/453/06 (H1N1), an avian‐like H1N1 virus similar to those circulating in European pigs, was used in these studies. Virus was passaged twice after isolation and titred (EID50) in 11‐day‐old fertile hen’s eggs, using 10‐fold dilutions and 10 eggs per dilution. The infectious dose was calculated according to Reed and Muench. 22
Vaccine
Pigs were vaccinated with a commercial bivalent split virus product, containing A/NewJersey/8/76 (H1N1) and A/PortChalmers/1/73 (H3N2) in an oil‐in‐water adjuvant (Gripovac®; Merial SA, Lyon, France), according to manufacturer’s recommendations.
Detection of virus shedding
Individual nasal swabs (Medical wire, MW100, WA Products Ltd, Burnham on Crouch, UK) were collected on days 1–4 from the naïve piglets. Larger swabs were used for the pigs in the second study (Sarstedt, Leicester, UK 80.1301) and two samples were taken daily, one per nostril. Swabs were placed into 1·0 ml virus transport medium (VTM, PBS containing 2% tryptose phosphate broth, 2% penicillin/streptomycin and 2% amphotericin B) and then vortexed before analysis. A rapid point‐of‐care Influenza A antigen detection system (Directigen®; BD Diagnostic Systems, Oxford, UK) was used to detect virus during the naïve transmission study, and quantitative RT‐PCR (qPCR) was used in the vaccination study, as described below, and applied retrospectively to the naïve study.
Quantitative RT‐PCR
A two‐step qPCR assay was developed against the NS1 gene of ‘avian‐like’ swine H1N1 and optimised for rapid analysis (sample to result in <4 hours), to facilitate movement of pigs on the same day. Viral RNA was extracted from nasal swab using a QIAamp Viral RNA kit (Qiagen, Crawley, UK). RNA was reverse transcribed using random hexamers with Superscript II (Invitrogen Life Sciences, Paisley, UK); reactions were incubated at room temperature for 10 minutes, 42°C for 30 minutes and then 70°C for 15 minutes. The qPCR assay was carried out using SYBR green mix (Thermo Scientific, Fisher, Loughborough, UK) with specific primers for the NS1 gene (swNSF: TGGTCTGGAAATCGAACCAG; swNSR: GCATGAACCAGTCCCTTGA). Samples were incubated at 94°C for 15 minutes followed by 40 cycles of 94°C/15 seconds, 55°C/15 seconds and 72°C/15 seconds. This was followed by a ramp of 70–90°C with a 0·5°C temperature increment and hold time of 10 seconds. Serial dilutions of a plasmid containing the Sw/England/453/06 NS1 gene were used for the standard curve. Results were analysed using quansoft software (Techne, Stone, UK).
Haemagglutination inhibition (HI) assays
Sera were treated to remove non‐specific inhibitors of haemagglutinin by receptor‐destroying enzyme (RDE) pre‐treatment and non‐specific agglutinins by adsorption to erythrocytes (RBCs). Four volumes of RDE (Sigma Aldrich) were added to one volume of serum followed by incubation at 37°C for 18 hours. RDE was inactivated by the addition of one volume 1·5% w/v sodium citrate, pH 7·2 and incubation at 56°C for 30 minutes. Ten volumes of treated sera were then adsorbed with one volume of 50% v/v chicken RBCs, followed by thorough mixing and incubation at 4°C for 1 hour. Cells were removed by centrifugation at 10 000 g for 3 minutes at 4°C.
Treated sera were tested against A/sw/England/453/06 (H1N1) using 1% v/v chicken RBCs in a 96‐well plate format using 4 HA units of virus per well and twofold serial dilutions of sera. Titres of ≥20 HI units (HIU) were considered as positive.
Clinical monitoring
Clinical signs (rectal temperature, nasal discharge, ocular discharge, dyspnoea, cough, weight loss and depression) were measured on the day of challenge (intranasal or by contact) until euthanasia. Pigs were examined twice daily.
Experimental design
Naïve pig transmission study
One group of seronegative, 5‐ to 6‐week‐old piglets (n = 14) was used for the study. Two animals were inoculated with 106·8EID50 influenza virus by the intranasal route to serve as donors for the transmission study. Once virus excretion was detected by Directigen™ test, two more piglets were introduced into the same pen. Once virus was detected in these animals, the initial two ‘transmitter’ pigs were removed. The recipient pigs were held in a separate area of the containment room whilst the pen and all feeding troughs were thoroughly disinfected with Virkon, prior to a further two piglets being introduced. This pattern of events continued for seven pairs of pigs. After transmission had occurred, piglets were euthanased for pathological examination.
Blood samples were taken from the anterior vena cava immediately prior to exposure and on the day animals were euthanased (3–5 days post‐exposure) and tested for influenza H1N1 HI antibodies. Pigs were sedated using azaperone (Stresnil®; Janssen, High Wycombe, UK) at 4–6 mg/kg and ketamine (Vetalar®; Parke‐Davis, Pontypool, UK) at 5–7·5 mg/kg, via the intramuscular route, and then euthanased by intravenous overdose of sodium pentobarbital (Euthatal®; Merial Animal Health, Harlow, UK) at 150 mg/kg.
Transmission in vaccinated pigs
One group of piglets (n = 12) was vaccinated with Gripovac®, one dose at 4–5 weeks old (V1) followed by a second dose (V2) 4 weeks later. A second group (n = 6) was not vaccinated. Blood samples were collected at V1, V2 then at 1‐ to 2‐week intervals for 4 months and tested by HI against A/sw/Eng/453/06 (H1N1). The target titre was ≤40 HIUs, a level above which infection was thought unlikely (K. van Reeth, personal communication), although in‐contact challenges have not been reported in vaccinated pigs. 23 , 24 By the time that antibody titres in sufficient animals for the experiment to be performed had declined to this level, pigs were approx 5 months of age and weighed between 113 and 133 kg. Two unvaccinated naïve pigs were challenged with 1·0 × 106·1 EID50 avian‐like H1N1 via the intranasal route. Nasal swabs were collected daily and RNA extracted for analysis by qPCR. On detection of virus shedding, the transmission chain proceeded as described for the previous study; pigs entered the transmission chain in order of antibody titre, lowest first (20 HIU). Once virus shedding could no longer be detected in recipient‐vaccinated animals, two pairs of naïve pigs were added to the end of the chain. On removal from the transmission chain, pigs were transferred to the holding room and monitored (clinical assessment, nasal swabs and rectal temperatures) for up to 5 days (pairs 3–7). Pairs 1 and 2 were kept for longer to collect sera. Blood samples were taken from each pig on the day of exposure and on the day they were euthanased (8–29 days post‐exposure). The euthanasia procedure was modified to suit larger pigs:animals were pre‐sedated with a combination of azaperone at 1 mg/kg, ketamine at 7 mg/kg and midazolam (Hypnovel®; Roche, Welwyn Garden City, UK) at 0·1 mg/kg via the intramuscular route using a 20‐ml syringe attached to a spiral extension set and this allowed the pigs to move freely and reduced handling stress. Once recumbent, an 18G catheter was inserted into a locally anaesthetised marginal ear vein and animals were euthanased by injection of secobarbital (40 mg/kg) and cinchocaine hydrochloride (2·5 mg/kg) (Somulose®; Dechra Veterinary Products, Shrewsbury, UK).
Results
Detection of virus shedding
The Directigen™ test had a minimum detection of around 1·0 × 105·3 EID50 and was used in the naïve pig study to determine the onset of virus excretion. The NS1 qPCR method could detect as few as eight copies of specific product and was used in the second study, as it was predicted that the older vaccinated pigs would shed virus at a lower level than naïve piglets. The use of SYBR green rather than a probe‐based assay enabled melt curves to be obtained to allow analysis of product specificity. Pigs displaying low copy numbers but with specific product were counted as positive, and those with detectable signal copy numbers but non‐specific product (incorrect size) were scored as negative.
Naïve pig transmission study
The first two naïve pigs were intranasally challenged with virus and developed clinical signs within 48 hours post‐infection, which included dullness, depressed behaviour, serous nasal discharge and dyspnoea. No reduction in weight or pyrexia was observed for any of the pigs, with individual maximum temperatures ranging from 39·3 to 39·9°C. The virus transmitted to the next pair of piglets showed similar clinical signs by 24 hours post‐exposure. Subsequent pairs of naïve pigs displayed signs within 24–48 hours, as shown in Table 1. The virus successfully transmitted through all six pairs of naïve pigs, with animals being moved every 48 hours (Figure 1). Clinical signs remained mild throughout the study; six animals showed ocular discharge and five had mucopurulent nasal discharge for up to 2 days. The most consistent early sign was depression, displayed by 12 of the 14 pigs in the study within 48 hours of challenge.
Table 1.
Summary of acute clinical signs observed for each pig in the naïve transmission chain
| Pig | Pair | Clinical sign | D0 | D1 | D2 | D3 | D4 |
|---|---|---|---|---|---|---|---|
| 115 | 1 | Depression | + | ||||
| Nasal discharge | + | + | |||||
| Ocular discharge | |||||||
| Dyspnoea | + | ||||||
| Cough | |||||||
| 113 | 1 | Depression | + | ||||
| Nasal discharge | |||||||
| Ocular discharge | + | + | |||||
| Dyspnoea | |||||||
| Cough | + | ||||||
| 104 | 2 | Depression | + | ||||
| Nasal discharge | + | + | + | ++ | |||
| Ocular discharge | + | + | + | ||||
| Dyspnoea | + | ||||||
| Cough | + | + | + | ||||
| 116 | 2 | Depression | + | + | + | ||
| Nasal discharge | + | + | + | + | |||
| Ocular discharge | |||||||
| Dyspnoea | + | + | |||||
| Cough | + | + | |||||
| 109 | 3 | Depression | |||||
| Nasal discharge | + | + | + | ||||
| Ocular discharge | |||||||
| Dyspnoea | |||||||
| Cough | |||||||
| 111 | 3 | Depression | |||||
| Nasal discharge | + | ++ | + | ++ | |||
| Ocular discharge | + | ||||||
| Dyspnoea | |||||||
| Cough | + | + | |||||
| 108 | 4 | Depression | + | + | |||
| Nasal discharge | + | + | + | + | |||
| Ocular discharge | |||||||
| Dyspnoea | |||||||
| Cough | |||||||
| 105 | 4 | Depression | + | + | + | ||
| Nasal discharge | + | + | + | + | |||
| Ocular discharge | |||||||
| Dyspnoea | |||||||
| Cough | |||||||
| 112 | 5 | Depression | + | + | |||
| Nasal discharge | + | + | + | ||||
| Ocular discharge | + | + | + | ||||
| Dyspnoea | |||||||
| Cough | |||||||
| 106 | 5 | Depression | + | ||||
| Nasal discharge | + | ||||||
| Ocular discharge | + | + | + | ||||
| Dyspnoea | + | + | + | ||||
| Cough | |||||||
| 110 | 6 | Depression | + | + | |||
| Nasal discharge | ++ | + | + | ||||
| Ocular discharge | |||||||
| Dyspnoea | |||||||
| Cough | |||||||
| 114 | 6 | Depression | + | + | |||
| Nasal discharge | + | + | + | ||||
| Ocular discharge | |||||||
| Dyspnoea | |||||||
| Cough | + | + | |||||
| 107 | 7 | Depression | + | + | |||
| Nasal discharge | + | ++ | + | ||||
| Ocular discharge | + | ||||||
| Dyspnoea | |||||||
| Cough | + | ||||||
| 103 | 7 | Depression | + | + | |||
| Nasal discharge | + | ++ | |||||
| Ocular discharge | |||||||
| Dyspnoea | |||||||
| Cough | + |
+, sign observed; ++, mucopurulent discharge; blank cell, sign not observed; shaded cell, no sample collected (animal euthanased).
Figure 1.

Virus shed by individual pigs during transmission in naïve animals. Horizontal bars represent the period each pig was in the transmission chain, and each colour represents a different pig as indicated in the key. Y‐axis indicates viral RNA copy number, determined by qPCR of the NS1 gene, and X‐axis indicates day of study.
Pigs were moved on the basis of the Directigen™ test and/or clinical signs. In addition, they were tested retrospectively by q‐PCR (Figure 1). Virus excretion was detected by 24 hours in the intranasally challenged pigs and by 3 days post‐exposure for the in‐contact challenged pigs. For in‐contact pairs 2–6, clinical signs were often observed a day prior to detection of virus excretion by q‐PCR.
A summary of gross pathological changes is presented in Table 2. Lesions were restricted to the respiratory tract. Gross lesions for pigs euthanased on day 3–5 post‐exposure were mild and moderate for those pigs euthanased at day 9. Where present, lung lesions were located in the cranioventral lobes. In pigs 106 and 112, lesions only extended to the cranial parts of the caudal lobes.
Table 2.
Summary of gross lesions observed in piglets at post‐mortem examination
| Pig ID | Pair | Challenge | Day post‐challenge | Lung | Thoracic LNs | Trachea | Nasal cavity |
|---|---|---|---|---|---|---|---|
| 109 | 3 | Contact | 5 | +/− | +/− | NE | +/− |
| 111 | 3 | Contact | 5 | +/− | +/− | + | +/− |
| 105 | 4 | Contact | 5 | +/− | +/− | − | +/− |
| 108 | 4 | Contact | 5 | +/− | +/− | − | − |
| 106 | 5 | Contact | 8 | ++ | ++ | − | +/− |
| 112 | 5 | Contact | 8 | ++ | ++ | − | − |
| 114 | 6 | Contact | 4 | +/− | − | − | − |
| 110 | 6 | Contact | 4 | +/− | − | − | − |
| 107 | 7 | Contact | 4 | +/− | +/− | +/− | − |
| 103 | 7 | Contact | 4 | +/− | +/− | − | − |
+/−, very mild lesions/marginal changes; +, mild/small focal lesions; ++, moderate/multifocal lesions; NE, not examined.
Partially immune pig transmission study
After vaccination, antibody levels to A/sw/Eng/453/06 (H1N1) were monitored by HI (Figure 2). Antibodies were first detected in five of the 13 pigs at V1 + 14 days and levels were boosted in all pigs following V2, reaching a mean titre of approximately 1200 HIUs by days 7–14 after vaccination. By V2 + 118 days, the pigs had antibody levels ranging between 20 and 320 HIUs. Eight vaccinated pigs were chosen for the study with titres ≤1:160. Six of these pigs had antibody levels of ≤40, the target level for the commencement of the transmission study.
Figure 2.
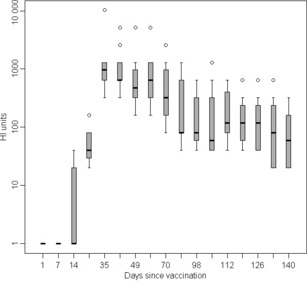
Box and Whisker plot showing the decline of haemagglutination inhibition (HI) antibody levels following vaccination of pigs with Gripovac®. HI assays were carried out against the challenge strain A/sw/England/453/06.
The first pair of naïve pigs was intranasally challenged with A/sw/Eng/453/06 (H1N1) as above, using the same virus stock. Virus shedding was detected by qPCR at day 2 post‐infection (Table 3 and Figure 3). The first pair of vaccinates introduced to the chain (pair 2) had HI titres of 1:20 and excreted virus on day 3 (Table 3). The second pair of vaccinates also had a titre of 20 and excreted detectable virus on day 3. The third pair of vaccinates (pair 4) had HI antibody levels of 1:40, following in‐contact challenge both animals displayed mild clinical signs and shed detectable virus. The fourth pair of vaccinates (pair 5) were introduced with HI antibody levels of 1:80 and 1:160. In these animals, virus shedding was not detected after 3 days and clinical signs were barely detectable (very mild ocular discharge). Therefore, two naïve pigs (pair 6) were introduced to amplify and detect low levels of virus that might have been shed. These naïve pigs became infected, shed large amounts of virus and displayed mild clinical signs. The four vaccinates in pairs 4 and 5 were removed and a further pair of naïve pigs were introduced (pair 7). These final naïve pigs also excreted virus and displayed clinical signs.
Table 3.
Virus excretion data for vaccinated and naïve pigs post‐exposure to sw/England/453/06, measured by qPCR
| Pig number | Pair ID | Immune status | Virus challenge | Pre challenge antibody level | Post‐challenge antibody level (d.p.e. sampled) | Days post‐exposure | |||||||||
|---|---|---|---|---|---|---|---|---|---|---|---|---|---|---|---|
| 1 | 2 | 3 | 4 | 5 | 6 | 7 | 8 | 9 | 10 | ||||||
| 405 | 1 | Naïve | Intranasal | <20 | 320 (29) | 0 | 1246 | 1471 | 1010 | 5443 | 86 | 12 | 128 | 0 | 0 |
| 410 | 1 | Naïve | Intranasal | <20 | 160 (29) | 0 | 983 | 1543 | 481 | 2186 | 229 | 31 | 33 | 0 | 0 |
| 409 | 2 | Vaccinated | In contact | <20 | 320 (19) | 0 | 0 | 38 | 0 | 7·0 | 513 | 0 | 0 | 0 | 0 |
| 417 | 2 | Vaccinated | In contact | 20 | 2560 (19) | 0 | 0 | 13 | 0 | 46 | 611 | 29 | 3 | 0 | 12 |
| 401 | 3 | Vaccinated | In contact | 20 | 20 (7) | 0 | 0 | 1071 | 0 | 0 | 35 | 0 | |||
| 402 | 3 | Vaccinated | In contact | 20 | 20 (7) | 0 | 0 | 63 | 0 | 0 | 0 | 0 | |||
| 415 | 4 | Vaccinated | In contact | 40 | 40 (11.) | 0 | 0 | 10 | 0 | 21 | 0 | 0 | 0 | 0 | 0 |
| 416 | 4 | Vaccinated | In contact | 40 | 40 (11.) | 0 | 0 | 0 | 0 | 8 | 0 | 24 | 0 | 0 | 0 |
| 403 | 5 | Vaccinated | In contact | 80 | 80 (9) | 0 | 0 | 0 | 0 | 0 | 0 | 0 | 0 | 0 | |
| 406 | 5 | Vaccinated | In contact | 160 | 160 (9) | 0 | 0 | 0 | 0 | 0 | 52 | 0 | 0 | 0 | |
| 412 | 6 | Naïve | In contact | <20 | 320 (12) | 0 | 0 | 0 | 2836 | 2100 | 1729 | 405 | 61 | 0 | 0 |
| 414 | 6 | Naïve | In contact | <20 | 320 (12) | 0 | 0 | 0 | 0 | 1386 | 786 | 117 | 421 | 0 | 0 |
| 400 | 7 | Naïve | In contact | <20 | 20 (8) | 0 | 0 | 0 | 0 | 127 | 46 | 0 | |||
| 413 | 7 | Naive | In contact | <20 | >20 | 0 | 0 | 0 | 63 | 76 | 0 | 0 | |||
Data presented as viral RNA copy number/μl swab extract. Shaded cells, no sample collected (pig euthanased).
Figure 3.
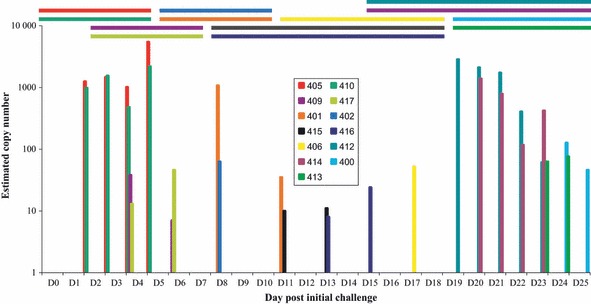
Virus shed by individual pigs during transmission in vaccinated and naive animals. Horizontal bars represent the period each pig was in the transmission chain, and each colour represents a different pig as indicated in the key. Y‐axis indicates viral RNA copy number, determined by qPCR of the NS1 gene, and X‐axis indicates day of study. The first two and last four pigs were unvaccinated.
Clinical signs in the naive pigs in the second study were milder than those in the younger pigs. The predominant signs were mild or moderate ocular discharge and depression, and slight nasal discharge was observed in one case. Again, no significant increase in rectal temperature, maximum temperatures ranged from 38·5 to 38·9°C, nor any reduction in weight was observed. Clinical signs were also very mild in the vaccinated pigs, particularly those with higher antibody levels; very slight ocular discharge and limited depression alone were observed.
The serological responses to virus exposure for each of the pigs in the second study are shown in Table 3. The first two pairs of pigs, kept for up to 4 weeks post‐infection, seroconverted as expected. The remainder of the vaccinated pigs, bled at shorter times post‐exposure, did not seroconvert during the time they were in the study. Both the naïve pigs in pair 6 and one of the pigs in pair 7 seroconverted in <2 weeks.
Discussion
Transmission of an avian‐like swine H1N1 influenza virus was achieved through a chain of five pairs of naïve piglets. The clinical signs observed in all pigs were mild, less severe than those reported for the original UK avian‐like H1N1 SIV strain isolated in 1992. 7 , 8 As a similar challenge method was used and a lower dose (1·0 × 104·5 EID50) for the earlier strain, the sw/England/453/06 isolate appeared to be less pathogenic, although this was not compared directly. The avian‐like H1N1 virus produced very mild gross lesions that were restricted to the lung, throracic lymph nodes, trachea and nasal cavity. Small areas of dark red consolidation present in the lungs may represent areas of acute bronchopneumonia; however, this could also have been because of alveolar collapse secondary to bronchitis or bronchiolar obstruction.
In the naïve study, the original pair of transmitter pigs and five pairs of in‐contact pigs shed virus for the duration of the transmission phase, up to 3 days. Despite showing clinical signs, excretion was not detected in the final pair (pair 7) based on direct antigen detection or retrospectively by qPCR (data not shown). Analysis of the retrospective qPCR results indicated that only one of the pigs in pair 5 shed detectable viral RNA, potentially reducing the challenge dose for the sixth pair. Pair 6 shed less virus than pigs earlier in the chain, possibly thus resulting in reduced challenge for pair 7, although this pair did display clinical signs and may have shed virus at a level below that detectable by the assay used. Importantly, this study defines the incubation time for co‐housed SIV infections in naïve piglets with avian‐like H1N1 virus. All infected piglets had virus detectable within 48 hours of contact with infected piglets and none had any virus detectable at just less than 24 hours after the mixing.
Vaccination against SIV is widely used in Europe. The prototype classical H1N1 New Jersey 1976 strain contained in the vaccine used here previously provided protection against an avian‐like H1N1 when pigs were challenged 2 weeks after vaccination, at peak antibody levels. 23 The mean peak titres here were considerably higher than those previously reported. 23 , 25 The antibody response was also highly variable between different animals and only half the pigs had levels predicted to be protective (c. 1:40) at 4 months. However, these results also suggest that animals can be infected at HI titres of 40 or more and are able to transmit virus to naïve pigs under experimental conditions. Vaccination in the field is likely to provide some herd immunity but not complete protection at 4 months or more after completing the course, although clinical disease should also be mitigated.
Our method of detecting virus was based upon qPCR analysis of RNA extracted from nasal swabs. Virus shedding decreased with every transmission cycle for pairs 1–5 and initial detection became more delayed, which correlated with the increase in pre‐challenge antibody levels for these pigs. Our data show that pigs could be infected with SIV at higher antibody titres than previously reported, where antibody levels as low as 1:20 and above reduced virus replication. 24 , 25 , 26 Here, animals with higher antibody levels displayed extremely mild clinical signs but were able to transmit virus to naïve animals. The pair of naïve animals introduced to four vaccinates shed virus at a higher level than those at the beginning of the chain. This may have been because of increased transmission as a result of mixing six pigs together rather than four, thus increasing contacts between animals, even though they shed virus at a low level. It is also possible that a virus variant was selected during the passage of avian‐like H1N1 in vaccinated pigs; however, the final pair of naïve animals shed at a lower level despite being exposed to high excretion levels. The potential selection of virus variants during the transmission through naïve and vaccinated animals is currently being investigated by clonal sequence analysis of viral RNA extracted during the course of the transmission experiment and will be reported elsewhere. The apparent ease of transmission through the vaccinated animals may in part be because of a mismatch between the vaccine and challenge strains, as the vaccine used here contained a classical swine H1N1 (New Jersey/1976) whereas the challenge strain was a recent avian‐like H1N1; however, viral heterogeneity does not appear to be a reason for clinical failure of vaccination. 23 , 24
Transmission models such as that described here could be used, particularly on a larger scale, to investigate the reduction in transmission induced by vaccination. 27 Natural challenge models using transmission offer benefits over the more typical methods of aerosol challenge, because the virus has come directly from an infected pig and thus represents the type of challenge seen in the field. Reduction in transmission is a critical but generally under‐emphasised characteristic of field vaccination programmes.
Addendum
D. Elton, J. Wood, J. Mumford and I. Brown contributed to the overall design of the experiments. L. Lloyd was responsible for running the naïve pig study and writing the manuscript, D. Elton for the study in vaccinated pigs and editing the paper. J. Lyall and M. Joncyzyk developed and implemented novel PCR assays, and C. Jervis was responsible for sampling pigs and RNA extractions, A. Foote carried out the PMs and D. Flack was the senior NACWO responsible for pig studies and supervision of all animal work and training staff.
Acknowledgements
The excellent work of the AHT animal care staff is gratefully acknowledged. The authors thank Kristen Van Reeth for helpful advice. This work was funded by a Veterinary Training and Research Initiative grant provided through Defra (VT0105). James Wood is supported by the Alborada Trust and the RAPIDD program of the Science and Technology Directorate, Department of Homeland Security.
References
- 1. Brown IH, Harris PA, McCauley JW, Alexander DJ. Multiple genetic reassortment of avian and human influenza A viruses in European pigs, resulting in the emergence of an H1N2 virus of novel genotype. J Gen Virol 1998; 79:2947–2955. [DOI] [PubMed] [Google Scholar]
- 2. Brown IH. The epidemiology and evolution of influenza viruses in pigs. Vet Microbiol 2000; 74:29–46. [DOI] [PubMed] [Google Scholar]
- 3. Van Reeth K, Brown IH, Dürrwald R et al. Seroprevalence of H1N1, H3N2 and H1N2 influenza viruses in pigs in seven European countries in 2002–2003. Influenza Other Respi Viruses 2008; 2:99–105. [DOI] [PMC free article] [PubMed] [Google Scholar]
- 4. Dunham EJ, Dugan VG, Kaser EK et al. Different evolutionary trajectories of European avian‐like and classical swine H1N1 influenza A viruses. J Virol 2009; 83:5485–5494. [DOI] [PMC free article] [PubMed] [Google Scholar]
- 5. Pensaert M, Ottis K, Vandeputte J, Kaplan MM, Bachmann PA. Evidence for the natural transmission of influenza A virus from wild ducks to swine and its potential importance for man. Bull World Health Organ 1981; 59:75–78. [PMC free article] [PubMed] [Google Scholar]
- 6. Brown IH, Done S, Hannam D, Higgins RJ, Machie SC, Courtenay A. Outbreak of influenza in pigs. Vet Rec 1992; 130:166. [DOI] [PubMed] [Google Scholar]
- 7. Brown IH, Done SH, Spencer YI, Cooley WA, Harris PA, Alexander DJ. Pathogenicity of a swine influenza H1N1 virus antigenically distinguishable from classical and European strains. Vet Rec 1993; 132:598–602. [DOI] [PubMed] [Google Scholar]
- 8. Brown IH, Manvell RJ, Alexander DJ, Chakraverty P, Hinshaw VS, Webster RG. Swine influenza outbreaks in England due to a new H1N1 virus. Vet Rec 1993; 132:461–462. [DOI] [PubMed] [Google Scholar]
- 9. Scholtissek C, Burger H, Bachmann PA, Hannoun C. Genetic relatedness of hemagglutinins if the H1 subtype of influenza A viruses isolated from Swine and birds. Virology 1983; 129:521–523. [DOI] [PubMed] [Google Scholar]
- 10. Schultz U, Fitch WM, Ludwig S, Mandler J, Scholtissek C. Evolution of pig influenza viruses. Virology 1991; 183:61–73. [DOI] [PubMed] [Google Scholar]
- 11. Brown IH, Ludwig S, Olsen CW et al. Antigenic and genetic analyses of H1N1 influenza A viruses from European pigs. J Gen Virol 1997; 78:553–562. [DOI] [PubMed] [Google Scholar]
- 12. Donatelli I, Campitelli L, Castrucci MR, Ruggieri A, Sidoli L, Oxford JS. Detection of two antigenic subpopulations of A (H1N1) influenza viruses from pigs: antigenic drift or interspecies transmission? J Med Virol 1991; 34:248–257. [DOI] [PubMed] [Google Scholar]
- 13. Bachmann PA. Swine influenza virus; in Pensaert MB. (ed.): Virus Infections of Porcines. Amsterdam, The Netherlands: Elsevier, 1989, pp 193–207. [Google Scholar]
- 14. Campitelli L, Donatelli I, Foni E et al. Continued evolution of H1N1 and H3N2 influenza viruses in pigs in Italy. Virology 1997; 232:310–318. [DOI] [PubMed] [Google Scholar]
- 15. Garten RJ, Davis CT, Russell CA et al. Antigenic and genetic characteristics of swine‐origin 2009 A(H1N1) influenza viruses circulating in humans. Science 2009; 325:197–201. [DOI] [PMC free article] [PubMed] [Google Scholar]
- 16. Herlocher ML, Elias S, Truscon R et al. Ferrets as a transmission model for influenza: sequence changes in HA1 of type A (H3N2) virus. J Infect Dis 2001; 184:542–546. [DOI] [PubMed] [Google Scholar]
- 17. Herlocher ML, Truscon R, Elias S et al. Influenza viruses resistant to the antiviral drug oseltamivir: transmission studies in ferrets. J Infect Dis 2004; 190:1627–1630. [DOI] [PubMed] [Google Scholar]
- 18. Lowen AC, Mubareka S, Tumpey TM, García‐Sastre A, Palese P. The guinea pig as a transmission model for human influenza viruses. Proc Natl Acad Sci USA 2006; 103:9988–9992. [DOI] [PMC free article] [PubMed] [Google Scholar]
- 19. Mubareka S, Lowen AC, Steel J, Coates AL, García‐Sastre A, Palese P. Transmission of influenza virus via aerosols and fomites in the guinea pig model. J Infect Dis 2009; 199:858–865. [DOI] [PMC free article] [PubMed] [Google Scholar]
- 20. Choi YK, Goyal SM, Joo HS. Evaluation of transmission of swine influenza type A subtype H1N2 virus in seropositive pigs. Am J Vet Res 2004; 65:303–306. [DOI] [PubMed] [Google Scholar]
- 21. Brookes SM, Núñez A, Choudhury B et al. Replication, pathogenesis and transmission of pandemic (H1N1) 2009 virus in non‐immune pigs. PLoS ONE 2010; 5:2. [DOI] [PMC free article] [PubMed] [Google Scholar]
- 22. Reed LJ, Muench H. A simple method of estimating fifty per cent end points. Am J Hyg 1938; 27:493–497. [Google Scholar]
- 23. Van Reeth K, Labarque G, De Clercq S, Pensaert M. Efficacy of vaccination of pigs with different H1N1 swine influenza viruses using a recent challenge strain and different parameters of protection. Vaccine 2001; 19:4479–4486. [DOI] [PubMed] [Google Scholar]
- 24. Kyriakis CS, Gramer MR, Barbé F, Van Doorsselaere J, Van Reeth K. Efficacy of commercial swine influenza vaccines against challenge with a recent European H1N1 field isolate. Vet Microbiol 2010; 144:67–74. [DOI] [PubMed] [Google Scholar]
- 25. Van Reeth K, Van Gucht S, Pensaert M. Investigations of the efficacy of European H1N1‐ and H3N2‐based swine influenza vaccines against the novel H1N2 subtype. Vet Rec 2003; 153:9–13. [DOI] [PubMed] [Google Scholar]
- 26. Haesebrouck F, Pensaert MB. Effect of intratracheal challenge of fattening pigs previously immunised with an inactivated influenza H1N1 vaccine. Vet Microbiol 1986; 3:239–249. [DOI] [PubMed] [Google Scholar]
- 27. De Jong MCM, Kimman TG. Experimental quantification of vaccine‐induced reduction in virus transmission. Vaccine 1994; 12:761–766. [DOI] [PubMed] [Google Scholar]