

Abstract
We imaged transcription in living cells using a locus-specific reporter system, which allowed precise, single-cell kinetic measurements of promoter binding, initiation and elongation. Photobleaching of fluorescent RNA polymerase II revealed several kinetically distinct populations of the enzyme interacting with a specific gene. Photobleaching and photoactivation of fluorescent MS2 proteins used to label nascent messenger RNAs provided sensitive elongation measurements. A mechanistic kinetic model that fits our data was validated using specific inhibitors. Polymerases elongated at 4.3 kilobases min−1, much faster than previously documented, and entered a paused state for unexpectedly long times. Transcription onset was inefficient, with only 1% of polymerase-gene interactions leading to completion of an mRNA. Our systems approach, quantifying both polymerase and mRNA kinetics on a defined DNA template in vivo with high temporal resolution, opens new avenues for studying regulation of transcriptional processes in vivo.
Transcription by RNA polymerase II (Pol II) is at the core of gene expression and hence is the basis of all cellular activities. Little information exists about the kinetics of this process in live cells1, as understanding of gene expression regulation comes from studies using purified proteins. For instance, the subunits of the elongating Pol II are well known2 and the crystal structure of this enzyme explains much of its behavior in vitro3,4. mRNA transcription can be deconstructed into a succession of steps: promoter assembly, clearance and escape5, followed by elongation and termination. The process of transcriptional initiation involves several structural changes in the polymerase as the nascent transcript elongates6. Early in initiation, the polymerase can produce abortive transcripts7,8. These abortive cycles have been observed with a single prokaryote polymerase (RNAP) releasing several transcripts without escaping the promoter9,10. The elongation step can be regulated by pausing for various times, as demonstrated using prokaryotic polymerases in vitro11,12. For eukaryotic cells, attempts have been made to calculate the endogenous elongation speed using run-on assays13, reverse-transcription (RT)-PCR14 or fluorescence in situ hybridization (FISH)15 on specific mRNAs, and these have yielded apparent elongation estimates ranging from 1.1 to 2.5 kilobases (kb) min−1. To date, no assay has been developed to measure the various steps of Pol II transcription in a living cell. For instance, although abortive initiation is widely believed to occur, the dynamics of this event are unknown, including whether initiating polymerases are committed to entering processive elongation or whether they may dissociate from the DNA, and the probability of each event. Furthermore, no assay exists that can measure elongation speed on a chromatin template within a live cell. Accurate measurements of the kinetics of transcription are fundamental to the understanding of transcription assembly, transcriptional regulation and cross-talk with transcription-coupled processes.
Here we report accurate in vivo measurements of the mammalian Pol II engaged in each of the steps of active transcription. We previously developed a method for the in vivo labeling of mRNA transcripts containing a series of repeated stem-loops (from phage MS2), which are specifically bound by an MS2 coat protein fused to green fluorescent protein (GFP)16. The assay consists of a human cell line harboring a gene array into which these stem-loops have been integrated17. We have now used this system to follow the synthesis of RNA in real time. Our method allows direct measurement of Pol II initiation events as well as elongation in isolation from the other steps of transcription. By using a deterministic computational model constrained by extensive data sets and tested with transcription inhibitors, we were able to extract features of transcription heretofore unexplored and provide a guide for application of the method to other genes.
RESULTS
Kinetics of Pol II transcription
We used a cell line with a stable integration of approximately 200 repeats of a gene cassette at a single locus17, each containing 256 upstream lacO repeats18 and a minimal cytomegalovirus (CMV) promoter coupled to a tetracycline-operator cassette controlling a gene that encodes a functional mRNA with 24 MS2 repeats in its 3’ untranslated region16,19 (Fig. 1). We could detect the locus using the lactose repressor fused to red (Fig. 1b,e,h,k) or cyan (Fig. 1n,r,v) fluorescent protein (RFP-LacI or CFP-LacI). Transcription was activated by the doxycycline-induced binding of a VP16 transactivation domain fused to a modified tetracycline repressor DNA-binding element. Upon transcriptional activation, we monitored the number of nascent precursor mRNAs (pre-mRNAs) at the locus using quantitative FISH20 (Fig. 1p,t), the binding of MS2-GFP protein to the nascent mRNAs (Fig. 1o,s) or the recruitment of RNA polymerase to the site (Fig. 1c,f,i,l). The total number of mRNAs detected at the site ranged from 200 to 400, with an average of two polymerases per transcription unit. Probes directed to either exon (Fig. 1w) or intron sequences (Fig. 1x) demonstrated the presence and correct excision of the intron at the transcription site; exon probes detected the distribution of messenger ribonucleoprotein particles in the nucleoplasm19 and cytoplasm21, whereas intron probes detected only the transcription site22,23.
Figure 1. Detecting transcription in vivo using fluorescence microscopy.

(a) Schematic of the gene cassette17 stably integrated into chromosomes of human U2OS cells. P above protein sequence denotes Pol II phosphorylation state (red, phosphorylated). Reverse tet transactivator (rtTA) in the presence of doxycycline drives gene expression from a minimal CMV promoter17. Arrows indicate the 3.3-kb region transcribed by Pol II and the 2.3-kb region labeled by GFP-MS2 fusion proteins. Red lines indicate targets of FISH oligonucleotide probes. (b–m) Active transcription sites recruit Pol II. In b,e,h,k, RFP-LacI labels gene locus. Immunofluorescence (using indicated antibodies) reveals Pol II in three phosphorylation states: unphosphorylated (c), phosphorylated at Ser5 (f) and phosphorylated at Ser2 (i). l shows that the transcription site recruits YFP–Pol II (YFP-RPB1αAmr). In n–y, nascent mRNAs were detected at active sites. In n,r,v, CFP-LacI labels gene locus. In o,s, mRNAs bound by GFP-MS2 were detected by FISH (probes at 5' and 3' ends are shown in p,t). FISH signals at exon (w) and intron regions (x) colocalize only at transcription site (see merge of each row, q,u,y). Scale bars, 5 µm.
Phosphorylation of the C-terminal domain (CTD) of the Pol II large subunit (RPB1) indicates its activity status24. Immunostaining with antibodies to the unphosphorylated CTD (Fig. 1b–d), CTD phosphorylated on Ser5 (Fig. 1e–g) or CTD phosphorylated on Ser2 (Fig. 1h–j) indicated that all polymerase activity states are present at the transcription site, suggesting that they participate in the three main processes of transcription: promoter binding, promoter clearance and elongation (Fig. 1a). A yellow fluorescent protein (YFP) fusion of the large subunit of Pol II was recruited and detected at the transcription site, allowing study of the dynamics of these three states (Fig. 1k–m).
Real-time transcription was monitored via the dynamics of fluorescent fusion proteins19,25. By measuring several hundred engaged polymerases, we averaged out the stochastic ‘noise’ of individual gene expression. We selected a stable cell line expressing YFP fused to an a-amanitin–resistant RPB1 mutant (YFP-RPB1aAmr). Under a-amanitin selection, endogenous RPB1 was degraded26 and there was no detectable growth phenotype27. Doxycycline-induced cells expressing YFP-RPB1aAmr showed an accumulation of the YFP–Pol II signal at the actively transcribing locus (Fig. 1l). Fluorescence recovery after photobleaching (FRAP) was measured by bleaching the YFP–Pol II signal enriched at transcription sites (Fig. 2) while the locus was continuously tracked using the RFP-LacI signal (Fig. 2b). A multiexponential fit of the recovery data revealed that a minimum of three kinetically distinct populations of polymerases were needed to describe the data (Fig. 2j). We postulated that the fraction of the recovery data showing the slowest kinetics represents post-initiation polymerases engaged with the gene and involved in elongation, the fastest fraction represents transient Pol II primary interactions at the promoter site, and the intermediate fraction represents initiation events. We then analyzed fluorescence recovery at the transcription site using mechanistic kinetic models25 to quantitatively assess our hypothesis. We chose to apply a binding-dominated model, as we were able to verify that nucleoplasmic diffusion of YFP–Pol II did not influence our results (see below). The model (Fig. 3a) simulated the kinetics of Pol II assembly and elongation, and allowed the resolution of time constants for polymerases entering at a single site and the relative molecular flux for each step of the transcription process. A simple, linear sequential model could not fit the data, as this would mean that at steady state almost all the polymerases would accumulate at the slowest (rate-limiting) step, so three kinetically distinct populations would not be resolved.
Figure 2. Quantifying Pol II transcription kinetics in vivo.
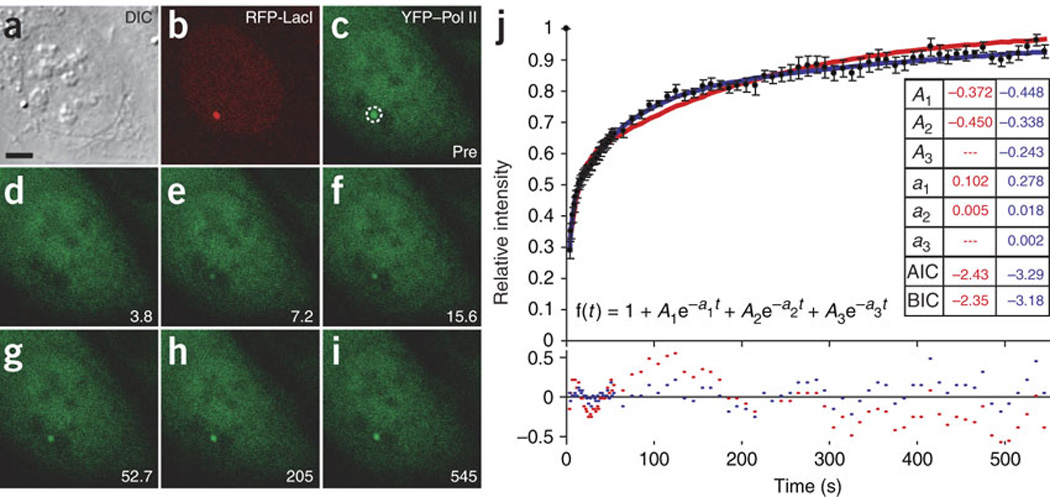
Fluorescence recovery after photobleaching of the transcription site is shown in a–i. (a) Differential interference contrast images of live cells. (b) RFP-LacI labels gene locus. (c) Dashed circle indicates photobleached region. (d–i) Bleaching (d) and recovery (e–i) of YFP–Pol II17 at active site, monitored for 545 s. Scale bar, 5 µm. (j) Pol II FRAP data (black; n = 10) fit to a sum of exponentials (see equation) to determine the minimal model complexity. This was done using generalized least-squares optimization as implemented in the SAAM II software package (http://depts.washington.edu/saam2/). Goodness of fit was evaluated by requiring that coefficients of variation on the parameter estimates were less than 30% and by checking for a random distribution of residuals around 0 (red and blue dots in lower chart represent residuals for two and three exponentials, respectively). By these criteria, a fit of the Pol II FRAP data requires three exponentials (blue), as residuals are not randomly distributed when fit to two exponentials (red). The Akaike information criterion (AIC)59 and the Bayes-Schwarz information criterion (BIC)60 for two- and three-exponential models are reported in the inset table. These standard quantitative measures of goodness-of-fit penalize additional model parameters. If the fit is sufficiently improved to justify the increased complexity of the model, then the AIC and BIC of the more complex model will be less than those of the simpler model. By this measure, three exponentials are superior to two in modeling our data. Error bars show s.e.m.
Figure 3. Polymerase II mechanistic kinetic model used to simulate the data.
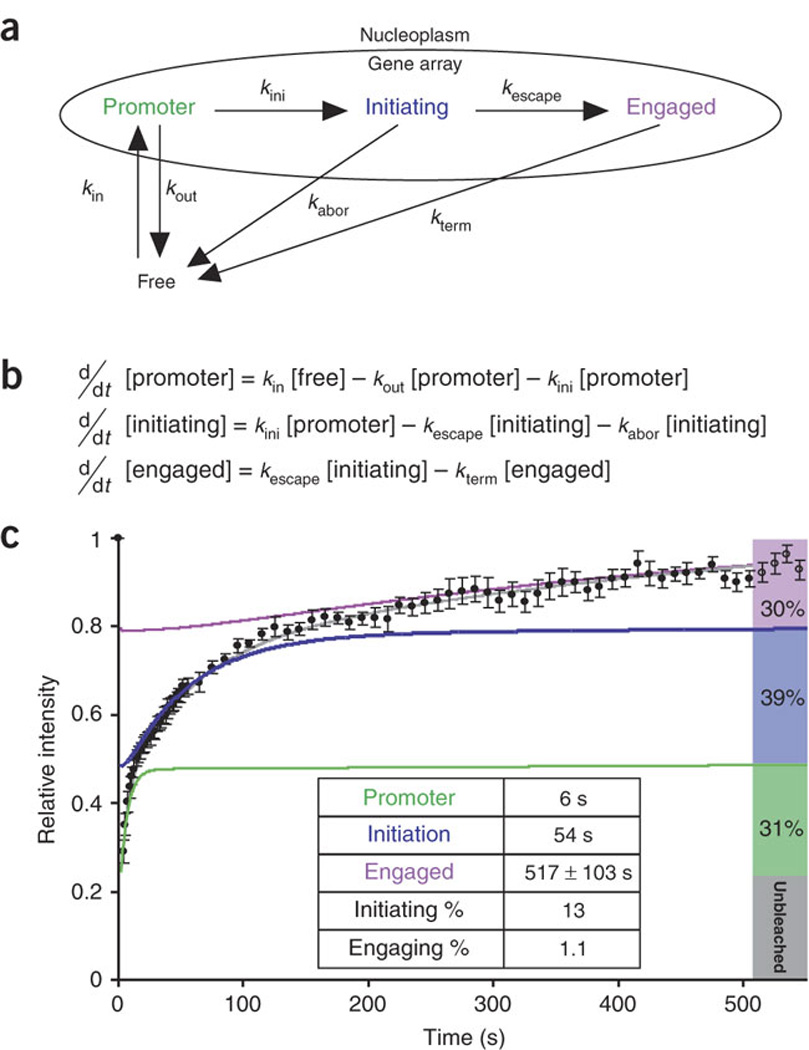
(a) Arrows labeled with rate constants represent transitions. (b) Differential equations simulating the mechanistic model in a, used to analyze the data in c. (c) Normalized fluorescence recovery of YFP–Pol II after photobleaching (black dots; data are the same as in Fig. 2j). The best-fit solution for the mathematical model (gray) characterizes three kinetically distinct states of Pol II (green, blue and purple, respectively) and predicts the steady-state fraction accumulating in each state (right bars). Inset table lists residence times for each state and probabilities for each step derived from the model in a and equations in b.
Two types of models could fit the data: the first would simulate three independent populations of Pol II, each committed to performing only a specific step of transcription, whereas the second model would involve three interconnected and dependent populations. We considered the first solution biologically unrealistic, because then each Pol II subpopulation would have to be recruited independently for promoter binding, initiation and elongation. We therefore pursued the second model and formulated it as a system of ordinary differential equations (Fig. 3b). The model included the sequential steps of polymerase assembly, initiation and elongation as well as exit points for the polymerase from each step, and it therefore was not constrained to linearity (see above). These exit points represented abortive release from the pre-initiation or initiation complex28 (Fig. 3a), as suggested by the observation that RNA polymerases have an intrinsic tendency to abort initiation after transcribing a short RNA molecule5,29. Parameter optimization constrained by the experimental data yielded a consistent solution (Fig. 3c, gray curve). In the solution, the mean residence times of the three kinetic fractions for promoter binding, initiation and elongation were 6, 54 and 517 s, respectively (Fig. 3c, green, blue and purple curves, respectively; Table 1 summarizes all the measurements). These data indicate that, as in many nuclear events, the association of a molecule with its target is based on a series of transient interactions30.
Table 1.
Kinetic parameters and calculations derived from the model solutions
| Description | Symbol | Valuea | Method or equation for determination |
|---|---|---|---|
| Initiation constant | kiniPol II | 0.0216 s−1 | Model solution |
| Promoter dissociation constant | koffPol II | 0.145 s−1 | Model solution |
| Promoter escape constant | kescapePol II | 0.00159 s−1 | Model solution |
| Abortive initiation constant | kaborPol II | 0.0170 s−1 | Model solution |
| Termination constant | ktermPol II | 0.0016 <> 0.0024 s−1 |
Model solution |
| mRNA release constant | koutMS2 | 0.0302 s−1 | Model solution |
| mRNA pausing constant | kpMS2 | 0.00131 s−1 | Model solution |
| mRNA pause-releasing constant | k−pMS2 | 0.00326 <> 0.00489 s−1 |
Model solution |
| Number of nascent mRNAs in the array | nmRNA | 200–400 | FISH (this study) |
| Number of genes in the array | ngenes | 200 | Southern blotb |
| Number of active genes in the array | nacts | 200 | Assumptionc |
| Partition of elongating versus pausing MS2-labeled polymerases |
Pelong | 0.76 | Model solution |
| Ratio: MS2-labeled polymerases/total engaged polymerases |
RMS2 | 0.7 | Assumptiond |
| Number of elongating Pol II making MS2-labeled mRNA |
nMS2 elong | 106–213 | Pelong•RMS2•nmRNA |
| Number of paused Pol II making MS2-labeled mRNA | nMS2 paused | 33–66 | (1 − Pelong) • RMS2 • nmRNA |
| Initiation efficiency | 13% | kiniPol II / (kiniPol II + koffPol II) | |
| Promoter release efficiency | 8.6% | kescapePol II / (kescapePol II + kaborPol II) | |
| Pausing probability | 4.2% | kpMS2 / (kpMS2 + koutMS2) | |
| Promoter residence time | tpromoter | 6 s | (koffPol II + kiniPol II)−1 |
| Initiation residence time | tinitiation | 54 s | (kescapePol II + kabortPol II)−1 |
| Engaged residence time | tengaged | 517 ± 103 s | (ktermPol II)−1 |
| Elongation residence time | telongation | 32 s | (kpMS2 + koutMS2)−1 |
| Pause residence time | tpause | 204 <> 307 s | (k−pMS2)−1 |
| Average frequency of mRNA production in the gene array | farray | 3.2–6.4 s−1 | koutMS2 • nMS2 elong |
| Average frequency of mRNA production per gene (promoter escape frequency) |
fgene | 0.016–0.032 s−1 | farray / nacts |
Rate constants obtained from least-squares fits of the experimental data are shown, as well as values calculated from these rates. Rate constants derived from the YFP–Pol II FRAP data have Pol II superscript; rate constants derived from the GFP-MS2 FRAP data have MS2 superscript.
The symbol <> represents lower and upper bounds of determined value.
Southern data provided in ref. 17.
To calculate the frequency of engaged polymerases, we assumed that all 200 genes were activated.
Polymerases transcribe 1 kb of nonfluorescent pre-mRNA before entering the MS2 repeat region and then transcribe 2.3 kb of pre-mRNA where they are labeled by fluorescent MS2 proteins linked to the polymerase through the nascent RNA (Fig. 1a). Because we experimentally determined the number of nascent mRNAs present at the transcription site, we assumed that polymerases were evenly distributed on the gene to estimate the number of polymerases loaded on the transcription unit upstream of the MS2-binding repeats (using the ratio 2.3 kb / 3.3 kb). Models were created with Process DB and solutions were obtained by exporting these models to Berkeley Madonna.
Pol II commitment to the gene is highly inefficient
The best-fit solution of this model predicts that only 13% of the polymerases interacting with the promoter are delivered to the initiation step and that only 8.6% of these engage in a longer-lasting process consistent with elongation (Fig. 3c). The net result of these sequential processes is that only 1 polymerase in 90 interaction events proceeds to elongation and produces an mRNA molecule. Despite the progressive order-of-magnitude increases in the residence time (6 s, 54 s and B500 s (517 ± 103 s)) for their respective components, each of the polymerase populations represents about one-third of the steady-state polymerases (Fig. 3c, green, blue and purple bars). This equilibrium is the result of the balanced loss of polymerases during the steps of transcription.
In our analysis, we assumed that Pol II diffusion would not affect the measured recovery speed and therefore need not be included in the model; however, we tested this assumption using established methods31,32. First, we compared the dynamics of recovery of the gene array to the corresponding recovery of a nucleoplasmic region distant from the array, where it has been shown that the freely diffusing Pol II represents nearly three-fourths of the signal, whereas the engaged polymerases represent one-fourth33. This approach compared regions with different numbers of binding sites. The transcription site, containing 200 copies of the gene cassette, amplified the bound signal, whereas the nucleoplasmic region, expected to contain few active genes, reflected the recovery expected from predominately free rather than bound polymerases33,34. The recovery curve (Fig. 4a, gray curve) was fit to a simple differential equation:
where i is the intensity at the site, kdif is the kinetic rate constant of diffusion for this particular setting, [nPolII] is the concentration of YFP–Pol II molecules present outside the bleached area and [rPolII] is the concentration inside the bleached area. This allowed us to obtain a kdif of 0.4 s−1, corresponding to a residence time in the bleached region of 2.5 s. The three kinetic components extracted from the Pol II simulation were then plotted (all the diffusion simulations were normalized to range from 0 to 0.6, so that they represent a diffusive range of that magnitude in comparison to the data normalized to range from 0 to 1). The resulting graph demonstrates that even the fastest two components revealed by the model have recovery curves that are distinguishable from diffusion.
Figure 4. Diffusion is not a significant factor in the Pol II kinetic model.

(a) FRAP was measured for YFP–Pol II in the nucleoplasm, where the local concentration of genes is lower than at the gene array. During 40 s of recovery, we observed only the diffusing population of polymerases (60% of the recovery signal; black dots). This component was fit with a kinetic rate constant (kdif) to describe the influx and efflux of molecules with respect to the nucleoplasmic bleached regions (gray curve). We also plotted the transcription site (TS) kinetic components for comparison. The fastest component (green) corresponds to a residence time of 6 s. The intermediate component (blue) is an order of magnitude slower, and the elongating polymerase (purple) is an order of magnitude slower still, as a fixed fraction near 0 was seen on this timescale. Error bars show s.e.m.; n = 5. (b) FRAP of YFP–Pol II was monitored for 2.5 min at the transcription site using four different bleached areas and measuring the recovery of the central transcription site. Spot sizes ranged from 3 µm2 (12 times the area of a typical active transcription site19) to 25 µm2 (100 times the area of a typical transcription site). Superimposition of these curves demonstrated that the recovery rates we measured are independent of spot size and enabled us to disregard diffusion in our model. Error bars show s.e.m.
Diffusion of Pol II represented 60% of the recovery observed in the nucleoplasm (Fig. 4a), whereas a quickly diffusing component on the gene array remained undetectable over the bound state. This suggests that (i) the enrichment provided by the gene array bound by many polymerases rendered the number of molecules diffusing in and out minimal by comparison, and (ii) none of the processes observed at the locus occurred at a speed similar to that of diffusion. In addition, we tested whether diffusion limits the binding of polymerases at the transcription site. To address this, we performed FRAP experiments using increasingly large bleach spots, as described32. Recovery time was not influenced by an increase in the diffusional distance in the bleached volume, indicating that the diffusing polymerase molecules are available to the locus within the timescale of our fastest observed component. Spot sizes ranged from 3 µm2 (12 times the surface area of a typical active transcription site19) to 25 µm2 (100 times the surface area of a typical transcription site) (Fig. 4b).
Although diffusion does not contribute to the two slower states, the fastest step could reflect the binding time plus a small contribution from the diffusion of polymerases entering the system (Fig. 4a). In any case, this interaction time cannot be greater than the residence time of 6 s calculated from the model. Therefore, for the purposes of modeling, we disregarded diffusion.
The transcriptional inhibitor DRB affects only elongation
We used a transcriptional inhibitor targeting elongation events on the gene array to test and validate the model. We verified that the slow Pol II recovery component represented elongation by FRAP experiments in the presence of 5,6-dichloro-1-b-D-ribofuranosylbenzimidazole (DRB)35, an elongation inhibitor that acts on the positive transcription elongation factor P-TEFb36 (Fig. 5a). Under these conditions, the slow recovery phase was undetectable, with a residence time longer than our detection limit, validating this phase as the elongation step. In contrast, the two fastest components were unaffected, irrespective of the acquisition source. This demonstrates that the Pol II slow component depends on elongating polymerases. We checked our model by drawing curves based on residence times that varied by 20% (Fig. 5b, gray) or 40% (red) from the elongation time calculated from the best-fit curve (blue). The data fall within the 20% error curves. Hence, we set the elongation time at 517 ± 103 s.
Figure 5. The transcription inhibitor DRB specifically affects the slow component.

(a) Data from confocal microscopy (green squares, data from Fig. 2j, with curve (upper blue line) showing three-exponential fit using kinetic parameters from Fig. 2j) and three-dimensional wide-field microscopy (gray squares; n= 13) yield similar kinetics. YFP–Pol II kinetics in cells treated with the transcription elongation inhibitor DRB35 (black dots; n = 5) were fit using the same kinetic parameters, but engaged residence time was increased to an infinite value. The resulting curve (lower blue line) demonstrate that the slow component is dependent on elongation. Error bars show s.e.m. (b) Modeling the goodness of fit for the Pol II component. Errors of ± 20% (gray) or ± 40% (red) modeled to demonstrate the accuracy of the best-fit curve (blue) from which the rate constants are derived. As the data fall within the 20% error curves, we determined a residence time of 517 ± 103 s (20% error) for the slow component (Fig. 3c; black dots show same data as in Fig. 2j).
Direct measurements of elongation kinetics
The average polymerase velocity over this time (517 s) for the 3.3-kb gene would be approximately 378 bases min−1, much slower than has been reported37. This suggests that an additional process may be taking place within the elongating population. To investigate the elongation kinetics at a temporal resolution capable of distinguishing subpopulations and independent of the preceding initiation events, we directly imaged transcription of the MS2-labeled RNA on the last 2.3 kb of the gene (Fig. 1a). We measured the recovery kinetics of fluorescent MS2 fusion protein bound to the MS2 stem-loops in the mRNA after photobleaching the transcription site (Fig. 6a–i), providing readouts that correlate with the rate of transcription on the gene. Notably, the FRAP curve best fit a sum of two exponential functions, one fast and one much slower (Fig. 6j). Because the recovery was dominated by the faster component, the second exponential could not be resolved with confidence. Consequently, to delineate the kinetics of the slower fraction, we used a photoactivatable GFP (paGFP) fusion of the MS2 protein19 (Fig. 6k–s). In contrast to the photobleaching experiment, previously transcribed MS2-tagged mRNA was fluorescently activated and monitored until its release from the transcription machinery. This allowed resolution of the slower fraction with higher confidence, as it quickly became the sole contributor to the measured fluorescence after the fast component had disappeared (Fig. 6t). The photoactivation experiment thus confirmed the hypothesis that elongation consists of two kinetically resolved components, one fast and one much slower. Both photobleaching recovery and photoactivation data were fit to a single kinetic model (as they measured the same events), in which their initial step (entry point) was elongation, the process responsible for synthesizing new MS2 binding sites, and the end step (exit point) was mRNA release into the nucleoplasm19.
Figure 6. Quantifying mRNA synthesis in vivo.

(a–s) FRAP (a–i) and loss of fluorescence after photoactivation (k–s) at the transcription site of the MS2-labeled mRNA. a,k show differential interference contrast images of live cells. In b,l, RFP-LacI labels gene locus. In c,m, dotted circle indicates photobleached and photoactivated regions, respectively. d,n show bleached MS2-GFP and activated paGFP-MS2, respectively. e–i show MS2-GFP recovery and o–s show paGFP-MS2 release from transcription site monitored for 10 min. Scale bars, 5 µm. (j,t) Normalized locus recovery (j) or loss in fluorescence (t) (black dots; n = 10). Curves show best-fit solutions for mathematical model (see equation) with single exponential (red) or two exponentials (blue), and inset tables list the resulting parameters (also see residuals in lower chart) along with the Akaike information criterion (AIC)59 and the Bayes-Schwarz information criterion (BIC)60. See Figure 2 for details. Both data sets require two exponentials, as the residuals are not randomly distributed with one exponential. When the MS2 photoactivation data (t) are fit to a single-exponential function, all the residuals for t < 200 s are negative and all those for t > 200 s are positive. If the two fits (j and t) are constrained to use the same Eigen values, the resulting mean residence times are 238 s and 34 s (see also Table 1). Error bars show s.e.m.
The slow component of the FRAP and photoactivation curves must correspond to a transcriptional process, because adding DRB resulted in the disappearance of the signal at the transcription site (data not shown). It is therefore likely that this slow component corresponds to the data above for DRB-sensitive polymerase activity. Therefore, in the model proposed above, we considered the slow polymerase process highlighted by the MS2 experiments to be a component of elongation, thereby incorporating both sets of kinetics. As polymerase pausing during elongation has been observed for both prokaryotic38 and eukaryotic transcriptional machinery39, we also added the possibility of pausing to the model. The two polymerase states were modeled as elongation with a stochastic transition to pausing (Fig. 7a). Optimization of the differential equations from this model (Fig. 7b), constrained by fitting of both the photobleaching recovery and photoactivation data simultaneously, yielded an elongation speed of 4.3 kb min−1 with a stochastic transition to a slower synthesis rate (pausing for a cumulative time of 4 min). Modeling showed that this transition from elongation to pausing affected only 4.2% of the polymerases that enter elongation. However, because they stay on the gene longer, they represent 26% of the polymerases seen at the locus (Fig. 7c summarizes these parameters for the fits in Fig. 7d,e; also see Discussion). As with the curves fit to the polymerase kinetics data, we tested the significance of the best fits (Fig. 7f,g, blue) for photobleaching recovery and photoactivation by varying the parameters by 20% (gray) and 40% (red). We tested the fit of each of the components of the model, elongation and pausing. For elongation, we varied the calculated polymerase velocity to find how well this velocity fit (Fig. 8a,b). We did the same for pausing, testing various pause efficiencies and times (Fig. 8c,d; see Discussion). In addition, we eliminated alternative models using criteria described in the Discussion, because they did not accommodate the experimental results. These FRAP and photoactivation data resolved Pol II elongation into two processes, rapid elongation and probabilistic pausing.
Figure 7. Modeling the kinetics of elongation during mRNA synthesis.
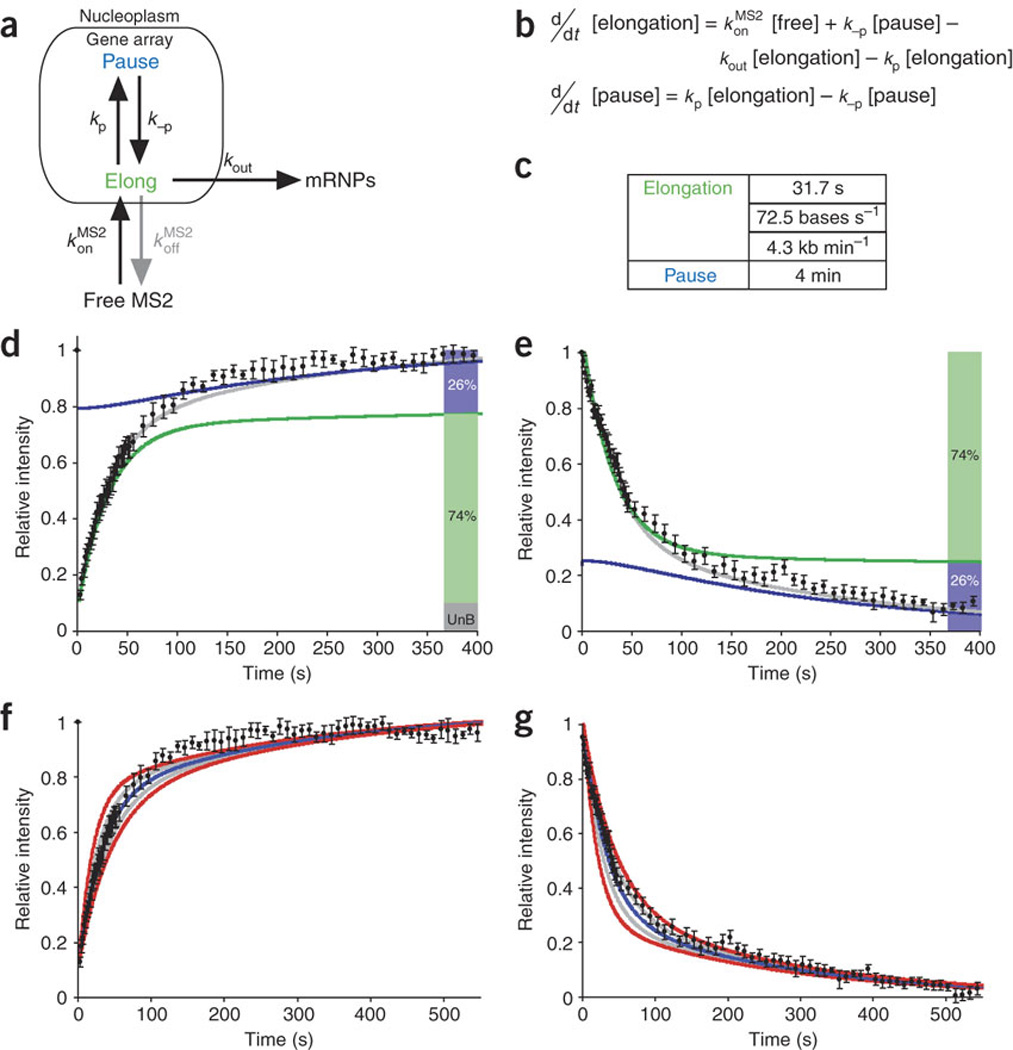
(a) Model of mRNA synthesis with two states, elongation and pausing, corresponding to kinetic parameters derived independently from Figure 6j,t. Arrows labeled with rate constants represent transitions. mRNPs, messenger ribonucleoprotein particles. (b) Differential equations corresponding to the model. (c) Residence times for each state. (d,e) Fits of the data from Figure 6 to this mathematical model. Shaded bars at right indicate fraction of mRNA in each state (UnB, unbleached fraction). Gray curve is best fit. (f,g) Assessment of errors for best-fit curves in d,e, as in Figure 5b.
Figure 8. Simulations of RNA synthesis curve fitting to test the effects of different pausing percentages and residence times on our model.

(a,b) Different elongation speeds ranging from 1 to 5 kb min−1 were simulated to illustrate that slower elongation speeds are inconsistent with our FRAP and photoactivation data. Data in a,b (black dots) are the same as in Figure 6j,t, respectively. (c) Best-fit solution predicts that a small fraction of polymerases (4.2% in our solution) enter long pauses; here we explored situations where different amounts of polymerases are forced to pause, ranging from 0% (dark blue) to 90% (green). A nonpausing system is simulated by a single-exponential fast decay, and increasing percentages of pausing allow the slow decay to dominate the simulation, gradually becoming the predominant population at the locus. This demonstrates that our model depends on only a small fraction of the polymerases pausing. Data (black dots) are the same as in Figure 6t. (d) Curves based on different pausing times illustrate that although our data (black dots; same as in Fig. 6t) cannot distinguish small differences in pausing time, larger variations are inconsistent with the data.
Transcriptional inhibitors reduce elongation kinetics
To validate the elongation component further, we performed GFP-MS2 FRAP experiments after treatment with drugs that inhibited transcription. Actinomycin D intercalates into DNA and stalls the polymerase34, generating a predominantly static fraction in the recovery curve (Fig. 9a). The remaining recovering fraction could be fit (albeit with low confidence) to our model using the same parameters as for the data from untreated cells, opening the possibility that our short actinomycin D treatment did not completely abolish transcription. This is in agreement with the hypothesis that actinomycin D acts on transcription by stalling polymerases. A polymerase could therefore be either stalled by the drug or fully active between intercalation sites. Upon treatment with actinomycin D for longer times, the transcription sites could not be detected owing to the release or degradation of the nascent RNAs. Camptothecin40 targets topoisomerase I41,42, which is necessary to relax DNA supercoiling during transcription. Treatment with this drug yielded a slower transcriptional rate of 1 kb min−1 (Fig. 9b), consistent with the expected effect of slower DNA unwinding. This quantifies topoisomerase I’s contribution to elongation speed. The effects of these drugs were in accordance with their known modes of action. In addition, kinetic modeling provided a quantitative insight into the mechanism of action for each of the drugs. For instance, the increased torsion of the DNA in the presence of the topoisomerase inhibitor reduced the velocity of the polymerase to about one-fourth of its normal speed, a measure of the contribution of unwinding to transcription.
Figure 9. Drugs that inhibit elongation affect the kinetics of RNA synthesis in specific ways.

Drugs were added to doxycycline-activated cells and GFP-MS2 transcription sites were photobleached. (a) Fluorescence recovery after actinomycin D treatment (5 µg ml−1) for 20 min resulted in a large immobile fraction, indicating stalling of the polymerase owing to intercalation. (b) Fluorescence recovery in untreated cells (normal) and cells treated with the fast-acting drug camptothecin (14 µM) for 15–45 min (+Cmt), detected with a Zeiss confocal microscope (see Supplementary Methods). Treatment with camptothecin led to a much slower recovery. These data are consistent with the drug causing inhibition of topoisomerase I, so that polymerases can not proceed at full speed owing to torsional stress imposed by the supercoiling of the DNA41. Error bars in a,b show s.e.m.
As mentioned above, we also treated cells with DRB before FRAP analysis of MS2-GFP–labeled sites, but the MS2-GFP signal decreased faster than with actinomycin D and did not permit us to perform FRAP measurements even soon after treatment. Therefore, the experiments described above were done at after short DRB treatments on transcription sites where the drug’s effect is probably not complete.
DISCUSSION
We have analyzed the transcriptional process in vivo on a specific gene array in the mammalian nucleus. Our methodology allowed direct and independent measurements of the Pol II enzyme and its mRNA product and provided rate constants for separate components of transcription: initiation, elongation and pausing (Table 1 and Supplementary Discussion online). The results of our analysis and modeling suggest the following conclusions.
A small fraction of polymerases at any moment are paused during elongation for cumulatively long periods. At steady state, they account for about one-fourth of all polymerase signals, because polymerases that do not pause contribute their fluorescent signals for much shorter times. We cannot distinguish whether the pausing of a single polymerase consists of many short pauses or one long pause. If a larger number of polymerases were paused, the genes would fill up with paused polymerases. In our analysis, a model in which more polymerases are paused at any time (for example, 10%) is inconsistent with the data (Fig. 8c). Notably, the pausing described here is different from the promoter-proximal pausing observed using chromatin immunoprecipitation of Pol II subunits5,43–46, as the pausing we detected occurred 1 kb downstream from the promoter. Stochastic pausing can be detected only by time-resolved live-cell measurements, and not by a chromatin immunoprecipitation assay, which cannot differentiate paused polymerases that are distributed randomly along each gene and are present in only a small subpopulation of the genes.
-
Elongation in the absence of pausing proceeded much faster than published estimates of overall mRNA synthesis rates (about 70 bases s−1, compared with about 30 bases s−1). This is because we measured only the maximum polymerase velocity. Previous studies measured the total time required to produce mRNAs, from transcriptional induction to accumulation of mature mRNAs13,14,34. Those analyses therefore provide an averaged polymerase velocity slower than what we observed.
As the slowest population comprises elongating polymerases, we can estimate the time necessary for transcription starting at the promoter. The mean interaction time of 517 ± 103 s corresponds to an elongation speed of 0.4 ± 0.08 kb min−1. This result is in accordance with a previous report34 that RNA polymerase’s average residence time in random positions of the nucleus is about 20 min, corresponding to an elongation speed of 0.7 kb min−1 for an average transcription-unit size of 14 kilobases. We consider these values to be lower estimates, as the measurements reflect all the events from commitment to elongation to release from the gene. For instance, it is known that polymerases do not elongate at constant rates: site-specific pauses have been described at splicing and polyadenylation sites, and during early elongation47. Additionally, polymerases are known to transcribe further downstream past the cleavage and polyadenylation site48. Finally, nothing is known about the time necessary for subsequent release of the RNA.
High rates of elongation (5.6 kb min−1) have been reported previously for RNA polymerase I transcription in the nucleolus49. This value was determined by measuring recovery after photobleaching of the polymerase, but it is similar to our measurement of Pol II elongation speed using the MS2 sites. This suggests that pausing is a Pol II–specific behavior. In the case of Pol I, the high efficiency of promoter escape led to 70-base distances between polymerases, as observed in Miller spreads50, implying that pausing within these transcription units would lead to catastrophic stalling. In contrast, polymerases observed on nonribosomal DNA spreads are spaced more than 4 kb apart51, consistent with our observations of an average of two polymerases per gene (Table 1). Taking into account these considerations, transcription by RNA polymerases I and II can be seen as two evolutionarily selected modes of regulation of the same enzymatic process, a view strengthened by their common subunits and conserved structural features.
Transcription can be inefficient. According to the above calculation, only 1 in 90 polymerases proceeds to elongation. The observed lack of processivity through the initial step of transcription—promoter escape, or clearance—makes a recycling model unlikely; otherwise, the transcription sites would not have completely recovered from photobleaching. Moreover, it suggests that the low efficiency with which the polymerase binds and engages at the promoter may be biologically useful. For instance, it may reduce the background of transcriptional noise, ensuring efficient transcription from a promoter only when many polymerases persistently interact52. Notably, this result contrasts with recent findings on insect systems, which have suggested a recycling mechanism for Pol II molecules sequestered at induced heat-shock loci on polytene chromosomes53. A recycling mechanism for Pol II is not supported by the conditions of our model, where the number of free polymerases is large compared to the number of promoters, but these conditions may not hold for the polytene heat-shock locus.
-
At the single-gene level, the production of mRNA may not be a continuous process. The model predicts that a single gene in the array produces an RNA about once or twice per minute (Table 1). As one-fourth of elongating polymerases are paused, at least one-fourth of genes would have a paused polymerase at any given time.
A nonpausing polymerase could transcribe the entire 3.3-kb gene in 46 s (at 4.3 kb min−1). If transcription were initiated by a lead polymerase that paused for a total of 4 min, other polymerases might ‘pile up’ behind it (as though it were a Sunday driver on a narrow road). This would result in discontinuous production of RNA. If the gene were highly expressed (that is, if its transcription were initiated frequently) this could result in ‘pulsing’ of transcription54, where the polymerases pile up and then the obstructed transcripts ‘burst’ when the pausing of the downstream polymerase is relieved, possibly by rephosphorylation of the CTD or ‘bumping’ by an upstream polymerase38. Previous work has clearly shown that polymerases can pause for some time before resuming transcription, for instance in response to heat shock or other factors5,46.
The amplified gene array provides an ensemble measurement. It allows clear visualization of the transcriptional process owing to the high signal-to-noise ratio of the measured fluorescence. Although transcription has been shown to take place in assemblies of genes and polymerases termed ‘transcription factories’, one should be cautious when extrapolating from the present array system to single genes or single factories. The results obtained from the array were interpreted under the assumption that all genes were equally active. However, the yield per gene would be different if a smaller number of different genes were transcribed. Still, the number of genes could not be small (for example, 20), as the polymerases would become too closely packed to allow the low percentage of pausing we modeled. It is probably also possible that other genes are transcribed more efficiently that the construct described here. For instance, recent unpublished results using similar approaches (E. Bertrand, Institut Génétique Moléculaire de Montpellier, personal communication) suggest that transcription of viral genes may be much more efficient. Thus, varieties of gene expression may be revealed and described more completely and mechanistically using similar quantitative approaches.
A systems-modeling approach combined with a quantitative assessment of the various kinetic parameters of transcription has allowed a more complete understanding of the components of gene expression. If the polymerase velocity is constant because of the polymerase’s inherent enzymatic properties, then the control points for regulating gene expression could be either at the promoter (initiation frequency) or at the pausing step (Supplementary Fig. 1 online). As the initiation frequency increases, pausing becomes more of a limiting factor; hence, regulation of the pause time is essential to allow high levels of gene expression over short periods of time. Recently, elegant work on the assembly of transcription factors on the heat-shock locus in living Drosophila cells53 has demonstrated that new developments in microscopy will allow testing of kinetic hypotheses using endogenous genes to determine the time dependence of splicing or termination. We therefore expect that future results with endogenous genes, as more sensitive microscopy methods are introduced, will reveal the myriad of controls by which genes are expressed55.
METHODS
Cell line
A genomic locus into which a gene was integrated served as an inducible transcription site for a 3.4-kb pre-mRNA17 (Fig. 1a). Preceding the transgene were 256 lacO repeats, which could be detected with a LacI repressor protein fused to a fluorescent tag (CFP or RFP, depending on the color combination needed for the experiment) to identify the chromosomal site of integration in living cells18. The promoter consists of a minimal CMV promoter preceded by 96 Tet operator repeats, which bind a chimeric transcriptional activator composed of the reverse tetracycline repressor (rTetR) doxycycline-dependent DNA-binding domain and the VP16 transactivation domain. The mRNA contained a 5’ sequence encoding CFP bearing a tripeptide peroxisome-targeting sequence, allowing us to monitor the translation of the mRNA via accumulation of the CFP signal in cytoplasmic peroxisomes. For real-time detection of the RNA, we inserted 24 MS2-binding sites downstream of the open reading frame. These sequences are bound efficiently and specifically by a fluorescently tagged MS2 bacteriophage coat protein. The 3’ end of the transcript consisted of the last intron-exon module of the mRNA encoding human b-globin, followed by its terminator. Approximately 200 copies of this gene were stably integrated into a euchromatic site in a human osteosarcoma cell line (U2OS)17.
Cell culture and transfection
Human U2OS osteosarcoma cells containing the integrated gene (clone 2-3-6) were cultured, transfected and transcriptionally activated as described17. Briefly, cells were cultured in low-glucose DMEM (Invitrogen) with 10% (v/v) FBS and, for live-cell experiments, were maintained in phenol red–free Leibovitz’s L15 medium. Cells were transfected by electroporation (using a Bio-Rad Gene Pulser Xcell) with 2 mg of pTet-On, 2 mg of pSV2-XFP-Lac repressor and 40 mg of sheared salmon sperm DNA (Amresco). Plasmids encoding GFP-MS2 with a nuclear localization signal (GFP-MS2-NLS) and a similar construct with photoactivatable GFP (paGFP-MS2-NLS) were cotransfected in some experiments. Cells were plated on coverslips or dishes coated with Cell-Tak (BD Biosciences). Transcription was induced by the addition of doxycycline (1 mg ml−1) to the medium for 30 min. A stable cell line expressing a YFP-fused, a-amanitin–resistant RPB1 mutant (YFP-RPB1aAmr) was established using a-amanitin as a selection marker. Under a-amanitin selection, endogenous RPB1 is degraded26; selected cells were viable for over 1 month with no detectable growth phenotype, demonstrating the full functionality of YFP-RPB1aAmr (ref. 27).
Fluorescence in situ hybridization
Cells were transfected with 2 mg of pTet-On, 2 mg of pSV2-CFP-Lac repressor and 40 mg of sheared salmon sperm DNA, and also with a plasmid encoding GFP-MS2 where indicated. After the cells adhered to coverslips, transcription was induced by addition of doxycycline for the indicated times. Cells were fixed and fluorescence hybridization was done as described56. The probes used were the following: Cy3-conjugated probe targeted to the 5’ exonic region of the CFP-SKL module, 5’-ATAT AGACGTTGTGGCTGATGTAGTTGTACTCCAGCTTGTGCCCCAGGATA-3’; Cy3-conjugated probe for the 3’ region at the end of the mRNA, 5’-TTGGCAG AGGGAAAAAGATCTCAGTGGTATTTGTGAGCCAGGGCATTGGC-3’; Cy5-conjugated probe for the b-globin intron, 5’-GGCAGGATGATGACCAGG GTGTAGTTGTTTCTACCAATAAGAATATTTCC-3’. Bold Ts represent aminoalyl deoxythymidines used for dye coupling.
Immunofluorescence
Cells expressing RFP-LacI were fixed for 20 min in 4% paraformaldehyde and for an additional 2 min in 4% (w/v) paraformaldehyde with 0.5% (v/v) Triton X-100. After washing and blocking in 5% (w/v) BSA, cells were stained with the indicated antibodies for 45 min, washed twice and then incubated with the appropriate secondary antibodies for 45 min.
Antibodies
H14 and H5 antibodies were obtained from hybridoma supernatants57 (see Acknowledgements). V15 antibodies were described58.
Photoactivation and fluorescence recovery after photobleaching
Transfected cells were plated on 0.17-mm Delta T dishes (Bioptechs), and transcription was induced by doxycycline 30 min before live-cell imaging. Experiments were performed at 37 1C using a temperature-controlled Delta T4 culture dish system with a heated lid and an objective heater (Bioptechs). Images were collected using independent imaging platforms, three confocal systems and a wide-field microscope for live-cell imaging, described below. On the Leica confocal microscope, cells were scanned using a 488-nm laser for detection of GFP-MS2, paGFP-MS2 or YFP–Pol II at the locus, and with a 543-nm laser for detection of RFP-LacI. GFP fluorescence was activated at the transcription site using one full-power pulse of a 405-nm laser for 1.635 s. Time-lapse imaging was done after bleaching, in two phases: a fast acquisition (593 Hz for FRAP and 612 Hz for photoactivation) for 30 frames followed by a second acquisition at 100 Hz for 50 frames. We tested constant imaging frequencies of 500, 200 and 100 Hz for 80 frames to check that the frequency change did not influence the recovery, verifying that data from the constant-frequency protocol were consistent with those from our dual-frequency protocol (data not shown). With the wide-field microscope used for live-cell imaging, the cells were photoactivated or bleached using a Mosaic Digital Diaphragm System (Photonic Instruments) and imaged in three dimensions over time using a 200-nm z-axis step size over a range of 2.2 µm to capture the transcription site, which moves in three dimensions. Three three-dimensional stacks were acquired before bleaching. The recovery was imaged in two phases. Milliseconds after bleaching, three-dimensional stacks were acquired every 3 s for 120 s. Then the stacks were acquired every 10 s for 500 s. Each stack was composed of 11 frames. The three-dimensional data were transformed into two-dimensional movies using a maximum projection, and the data were analyzed using the same protocol as for analysis of the confocal data, described below. Pol II diffusion was imaged in two dimensions, one image every 0.5 s for the first 25 s and then one every 0.6 s for 60 s. The spot-size experiments were done with a Zeiss LSM 5 Live DuoScan microscope and images were acquired in two dimensions every 0.5 s for 10 s, then every 3 s for 90 s and finally every 5 s for 50 s.
Drug treatments
For DRB treatment, stable cells expressing YFP–Pol II and growing regularly in a-amanitin (25 mg ml−1), were transfected, plated and induced with doxycycline. After 30 min of induction, DRB (Sigma) was add to the medium at 37–50 mg ml−1. FRAP experiments were done 10–60 min after drug treatment. For actinomycin D treatment, doxycycline-induced cells transfected with GFP-MS2 were incubated with 5 mg ml−1 actinomycin D (Sigma) for 20 min and transcription sites were photobleached thereafter. For camptothecin treatment, doxycycline-induced cells transfected with GFP-MS2 were incubated with 14 mM of (S)-(+)-camptothecin (Sigma) for 15–45 min as described42. The experiments were done on a Zeiss confocal microscope at 37 1C using the FCS2 live-cell chamber system (Bioptechs) and an objective heater (Bioptechs). Cells were scanned using a 488-nm laser for detection of GFP-MS2 and a 543-nm laser for detection of RFP-LacI repressor protein at the locus. To compare the microscope systems, we also photobleached doxycycline induced cells without drug treatment, and the recovery curve was identical to the one collected on the Leica confocal system (Fig. 9b).
Mechanistic kinetic modeling
FRAP and photoactivation experiments were modeled using ProcessDB (Integrative Bioinformatics; http://www.integrativebioinformatics.com) to generate the systems of differential equations, and Berkeley Madonna (http://www.berkeleymadonna.com) was used to solve and fit the models. Table 1 summarizes all the kinetic parameters obtained in this paper and explains how they were calculated.
Additional methods
Information on microscopy, image analysis, single-RNA quantification and statistical analysis is available in the Supplementary Methods online and at http://singerlab.org/.
Supplementary Material
Acknowledgments
We acknowledge the seminal contributions of S. Janicki and D. Spector in developing the cell line. We thank D. Larson and O. Bensaude for discussions on the kinetic modeling, K. Neugebauer for suggesting the use of camptothecin, S. Buhl (Albert Einstein College of Medicine) for hybridoma supernatants containing the H14 and H5 antibodies, and E. Bertrand for sharing unpublished data. This work was online in open peer review in July 2006 on the Nature website. This work was supported by the US National Institutes of Health, National Institute of Biomedical Imaging and Bioengineering, grant EB-002060 to R.H.S. Y.S.-T. is the Jane Stern Lebell Family Fellow in Life Sciences at Bar-Ilan University.
Footnotes
AUTHOR CONTRIBUTIONS
All data were initially acquired by X.D. and Y.S.-T. Subsequent data were obtained by V.d.T. (Fig. 4a,b and Fig. 5a) and Y.B. (Fig. 9b). S.M.S. was responsible for the microscopy, built the wide-field microscope for live-cell imaging and wrote analysis software. X.D. performed the kinetic modeling. R.D.P. provided consultation on model formulation and testing, and training in the use of the ProcessDB software. R.H.S. supervised the project.
COMPETING INTERESTS STATEMENT
The authors declare competing financial interests: details accompany the full-text HTML version of the paper at http://www.nature.com/nsmb/.
References
- 1.Moore MJ. From birth to death: the complex lives of eukaryotic mRNAs. Science. 2005;309:1514–1518. doi: 10.1126/science.1111443. [DOI] [PubMed] [Google Scholar]
- 2.Shilatifard A, Conaway RC, Conaway JW. The RNA polymerase II elongation complex. Annu. Rev. Biochem. 2003;72:693–715. doi: 10.1146/annurev.biochem.72.121801.161551. [DOI] [PubMed] [Google Scholar]
- 3.Cramer P, Bushnell DA, Kornberg RD. Structural basis of transcription: RNA polymerase II at 2.8 angstrom resolution. Science. 2001;292:1863–1876. doi: 10.1126/science.1059493. [DOI] [PubMed] [Google Scholar]
- 4.Cramer P. RNA polymerase II structure: from core to functional complexes. Curr. Opin. Genet. Dev. 2004;14:218–226. doi: 10.1016/j.gde.2004.01.003. [DOI] [PubMed] [Google Scholar]
- 5.Krumm A, Hickey LB, Groudine M. Promoter-proximal pausing of RNA polymerase II defines a general rate-limiting step after transcription initiation. Genes Dev. 1995;9:559–572. doi: 10.1101/gad.9.5.559. [DOI] [PubMed] [Google Scholar]
- 6.Dvir A. Promoter escape by RNA polymerase II. Biochim. Biophys. Acta. 2002;1577:208–223. doi: 10.1016/s0167-4781(02)00453-0. [DOI] [PubMed] [Google Scholar]
- 7.Lescure B, Williamson V, Sentenac A. Efficient and selective initiation by yeast RNA polymerase B in a dinucleotide-primed reaction. Nucleic Acids Res. 1981;9:31–45. doi: 10.1093/nar/9.1.31. [DOI] [PMC free article] [PubMed] [Google Scholar]
- 8.Holstege FC, Fiedler U, Timmers HT. Three transitions in the RNA polymerase II transcription complex during initiation. EMBO J. 1997;16:7468–7480. doi: 10.1093/emboj/16.24.7468. [DOI] [PMC free article] [PubMed] [Google Scholar]
- 9.Kapanidis AN, et al. Initial transcription by RNA polymerase proceeds through a DNA-scrunching mechanism. Science. 2006;314:1144–1147. doi: 10.1126/science.1131399. [DOI] [PMC free article] [PubMed] [Google Scholar]
- 10.Margeat E, et al. Direct observation of abortive initiation and promoter escape within single immobilized transcription complexes. Biophys. J. 2006;90:1419–1431. doi: 10.1529/biophysj.105.069252. [DOI] [PMC free article] [PubMed] [Google Scholar]
- 11.Adelman K, et al. Single molecule analysis of RNA polymerase elongation reveals uniform kinetic behavior. Proc. Natl. Acad. Sci. USA. 2002;99:13538–13543. doi: 10.1073/pnas.212358999. [DOI] [PMC free article] [PubMed] [Google Scholar]
- 12.Davenport RJ, Wuite GJ, Landick R, Bustamante C. Single-molecule study of transcriptional pausing and arrest by E. coli RNA polymerase. Science. 2000;287:2497–2500. doi: 10.1126/science.287.5462.2497. [DOI] [PubMed] [Google Scholar]
- 13.O'Brien T, Lis JT. Rapid changes in Drosophila transcription after an instantaneous heat shock. Mol. Cell. Biol. 1993;13:3456–3463. doi: 10.1128/mcb.13.6.3456. [DOI] [PMC free article] [PubMed] [Google Scholar]
- 14.Tennyson CN, Klamut HJ, Worton RG. The human dystrophin gene requires 16 hours to be transcribed and is cotranscriptionally spliced. Nat. Genet. 1995;9:184–190. doi: 10.1038/ng0295-184. [DOI] [PubMed] [Google Scholar]
- 15.Femino AM, Fogarty K, Lifshitz LM, Carrington W, Singer RH. Visualization of single molecules of mRNA in situ. Methods Enzymol. 2003;361:245–304. doi: 10.1016/s0076-6879(03)61015-3. [DOI] [PubMed] [Google Scholar]
- 16.Bertrand E, et al. Localization of ASH1 mRNA particles in living yeast. Mol. Cell. 1998;2:437–445. doi: 10.1016/s1097-2765(00)80143-4. [DOI] [PubMed] [Google Scholar]
- 17.Janicki SM, et al. From silencing to gene expression: real-time analysis in single cells. Cell. 2004;116:683–698. doi: 10.1016/s0092-8674(04)00171-0. [DOI] [PMC free article] [PubMed] [Google Scholar]
- 18.Robinett CC, et al. In vivo localization of DNA sequences and visualization of large-scale chromatin organization using lac operator/repressor recognition. J. Cell Biol. 1996;135:1685–1700. doi: 10.1083/jcb.135.6.1685. [DOI] [PMC free article] [PubMed] [Google Scholar]
- 19.Shav-Tal Y, et al. Dynamics of single mRNPs in nuclei of living cells. Science. 2004;304:1797–1800. doi: 10.1126/science.1099754. [DOI] [PMC free article] [PubMed] [Google Scholar]
- 20.Femino AM, Fay FS, Fogarty K, Singer RH. Visualization of single RNA transcripts in situ. Science. 1998;280:585–590. doi: 10.1126/science.280.5363.585. [DOI] [PubMed] [Google Scholar]
- 21.Fusco D, et al. Single mRNA molecules demonstrate probabilistic movement in living mammalian cells. Curr. Biol. 2003;13:161–167. doi: 10.1016/s0960-9822(02)01436-7. [DOI] [PMC free article] [PubMed] [Google Scholar]
- 22.Bentley DL. Rules of engagement: co-transcriptional recruitment of pre-mRNA processing factors. Curr. Opin. Cell Biol. 2005;17:251–256. doi: 10.1016/j.ceb.2005.04.006. [DOI] [PubMed] [Google Scholar]
- 23.Darzacq X, et al. Stepwise RNP assembly at the site of H/ACA RNA transcription in human cells. J. Cell Biol. 2006;173:207–218. doi: 10.1083/jcb.200601105. [DOI] [PMC free article] [PubMed] [Google Scholar]
- 24.Palancade B, Bensaude O. Investigating RNA polymerase II carboxyl-terminal domain (CTD) phosphorylation. Eur. J. Biochem. 2003;270:3859–3870. doi: 10.1046/j.1432-1033.2003.03794.x. [DOI] [PubMed] [Google Scholar]
- 25.Phair RD, Misteli T. Kinetic modelling approaches to in vivo imaging. Nat. Rev. Mol. Cell Biol. 2001;2:898–907. doi: 10.1038/35103000. [DOI] [PubMed] [Google Scholar]
- 26.Nguyen VT, et al. In vivo degradation of RNA polymerase II largest subunit triggered by alpha-amanitin. Nucleic Acids Res. 1996;24:2924–2929. doi: 10.1093/nar/24.15.2924. [DOI] [PMC free article] [PubMed] [Google Scholar]
- 27.Becker M, et al. Dynamic behavior of transcription factors on a natural promoter in living cells. EMBO Rep. 2002;3:1188–1194. doi: 10.1093/embo-reports/kvf244. [DOI] [PMC free article] [PubMed] [Google Scholar]
- 28.Mason PB, Struhl K. Distinction and relationship between elongation rate and processivity of RNA polymerase II in vivo. Mol. Cell. 2005;17:831–840. doi: 10.1016/j.molcel.2005.02.017. [DOI] [PubMed] [Google Scholar]
- 29.Boeger H, et al. Structural basis of eukaryotic gene transcription. FEBS Lett. 2005;579:899–903. doi: 10.1016/j.febslet.2004.11.027. [DOI] [PubMed] [Google Scholar]
- 30.Phair RD, Misteli T. High mobility of proteins in the mammalian cell nucleus. Nature. 2000;404:604–609. doi: 10.1038/35007077. [DOI] [PubMed] [Google Scholar]
- 31.Beaudouin J, Mora-Bermudez F, Klee T, Daigle N, Ellenberg J. Dissecting the contribution of diffusion and interactions to the mobility of nuclear proteins. Biophys. J. 2006;90:1878–1894. doi: 10.1529/biophysj.105.071241. [DOI] [PMC free article] [PubMed] [Google Scholar]
- 32.Sprague BL, et al. Analysis of binding at a single spatially localized cluster of binding sites by fluorescence recovery after photobleaching. Biophys. J. 2006;91:1169–1191. doi: 10.1529/biophysj.105.073676. [DOI] [PMC free article] [PubMed] [Google Scholar]
- 33.Hieda M, Winstanley H, Maini P, Iborra FJ, Cook PR. Different populations of RNA polymerase II in living mammalian cells. Chromosome Res. 2005;13:135–144. doi: 10.1007/s10577-005-7720-1. [DOI] [PubMed] [Google Scholar]
- 34.Kimura H, Sugaya K, Cook PR. The transcription cycle of RNA polymerase II in living cells. J. Cell Biol. 2002;159:777–782. doi: 10.1083/jcb.200206019. [DOI] [PMC free article] [PubMed] [Google Scholar]
- 35.Yamaguchi Y, Wada T, Handa H. Interplay between positive and negative elongation factors: drawing a new view of DRB. Genes Cells. 1998;3:9–15. doi: 10.1046/j.1365-2443.1998.00162.x. [DOI] [PubMed] [Google Scholar]
- 36.Peterlin BM, Price DH. Controlling the elongation phase of transcription with P-TEFb. Mol. Cell. 2006;23:297–305. doi: 10.1016/j.molcel.2006.06.014. [DOI] [PubMed] [Google Scholar]
- 37.Darzacq X, Singer RH, Shav-Tal Y. Dynamics of transcription and mRNA export. Curr. Opin. Cell Biol. 2005;17:332–339. doi: 10.1016/j.ceb.2005.04.004. [DOI] [PMC free article] [PubMed] [Google Scholar]
- 38.Epshtein V, Nudler E. Cooperation between RNA polymerase molecules in transcription elongation. Science. 2003;300:801–805. doi: 10.1126/science.1083219. [DOI] [PubMed] [Google Scholar]
- 39.Landick R. The regulatory roles and mechanism of transcriptional pausing. Biochem. Soc. Trans. 2006;34:1062–1066. doi: 10.1042/BST0341062. [DOI] [PubMed] [Google Scholar]
- 40.Liu LF, et al. Mechanism of action of camptothecin. Ann. NY Acad. Sci. 2000;922:1–10. doi: 10.1111/j.1749-6632.2000.tb07020.x. [DOI] [PubMed] [Google Scholar]
- 41.Collins I, Weber A, Levens D. Transcriptional consequences of topoisomerase inhibition. Mol. Cell. Biol. 2001;21:8437–8451. doi: 10.1128/MCB.21.24.8437-8451.2001. [DOI] [PMC free article] [PubMed] [Google Scholar]
- 42.Listerman I, Sapra AK, Neugebauer KM. Cotranscriptional coupling of splicing factor recruitment and precursor messenger RNA splicing in mammalian cells. Nat. Struct. Mol. Biol. 2006;13:815–822. doi: 10.1038/nsmb1135. [DOI] [PubMed] [Google Scholar]
- 43.Cheng C, Sharp PA. RNA polymerase II accumulation in the promoter-proximal region of the dihydrofolate reductase and gamma-actin genes. Mol. Cell. Biol. 2003;23:1961–1967. doi: 10.1128/MCB.23.6.1961-1967.2003. [DOI] [PMC free article] [PubMed] [Google Scholar]
- 44.Eick D, Bornkamm GW. Transcriptional arrest within the first exon is a fast control mechanism in c-myc gene expression. Nucleic Acids Res. 1986;14:8331–8346. doi: 10.1093/nar/14.21.8331. [DOI] [PMC free article] [PubMed] [Google Scholar]
- 45.Kao SY, Calman AF, Luciw PA, Peterlin BM. Anti-termination of transcription within the long terminal repeat of HIV-1 by tat gene product. Nature. 1987;330:489–493. doi: 10.1038/330489a0. [DOI] [PubMed] [Google Scholar]
- 46.Rougvie AE, Lis JT. The RNA polymerase II molecule at the 5' end of the uninduced hsp70 gene of D. melanogaster is transcriptionally engaged. Cell. 1988;54:795–804. doi: 10.1016/s0092-8674(88)91087-2. [DOI] [PubMed] [Google Scholar]
- 47.Saunders A, Core LJ, Lis JT. Breaking barriers to transcription elongation. Nat. Rev. Mol. Cell Biol. 2006;7:557–567. doi: 10.1038/nrm1981. [DOI] [PubMed] [Google Scholar]
- 48.Luo W, Bentley D. A ribonucleolytic rat torpedoes RNA polymerase II. Cell. 2004;119:911–914. doi: 10.1016/j.cell.2004.11.041. [DOI] [PubMed] [Google Scholar]
- 49.Dundr M, et al. A kinetic framework for a mammalian RNA polymerase in vivo. Science. 2002;298:1623–1626. doi: 10.1126/science.1076164. [DOI] [PubMed] [Google Scholar]
- 50.Miller OL, Jr, Hamkalo BA. Visualization of RNA synthesis on chromosomes. Int. Rev. Cytol. 1972;33:1–25. doi: 10.1016/s0074-7696(08)61446-1. [DOI] [PubMed] [Google Scholar]
- 51.Jackson DA, Iborra FJ, Manders EM, Cook PR. Numbers and organization of RNA polymerases, nascent transcripts, and transcription units in HeLa nuclei. Mol. Biol. Cell. 1998;9:1523–1536. doi: 10.1091/mbc.9.6.1523. [DOI] [PMC free article] [PubMed] [Google Scholar]
- 52.Struhl K. Transcriptional noise and the fidelity of initiation by RNA polymerase II. Nat. Struct. Mol. Biol. 2007;14:103–105. doi: 10.1038/nsmb0207-103. [DOI] [PubMed] [Google Scholar]
- 53.Yao J, Munson KM, Webb WW, Lis JT. Dynamics of heat shock factor association with native gene loci in living cells. Nature. 2006;442:1050–1053. doi: 10.1038/nature05025. [DOI] [PubMed] [Google Scholar]
- 54.Chubb JR, Trcek T, Shenoy SM, Singer RH. Transcriptional pulsing of a developmental gene. Curr. Biol. 2006;16:1018–1025. doi: 10.1016/j.cub.2006.03.092. [DOI] [PMC free article] [PubMed] [Google Scholar]
- 55.Shav-Tal Y, Singer RH, Darzacq X. Imaging gene expression in single living cells. Nat. Rev. Mol. Cell Biol. 2004;5:855–861. doi: 10.1038/nrm1494. [DOI] [PMC free article] [PubMed] [Google Scholar]
- 56.Chartrand P, Bertrand E, Singer RH, Long RM. Sensitive and high-resolution detection of RNA in situ. Methods Enzymol. 2000;318:493–506. doi: 10.1016/s0076-6879(00)18072-3. [DOI] [PubMed] [Google Scholar]
- 57.Bregman DB, Du L, van der Zee S, Warren SL. Transcription-dependent redistribution of the large subunit of RNA polymerase II to discrete nuclear domains. J. Cell Biol. 1995;129:287–298. doi: 10.1083/jcb.129.2.287. [DOI] [PMC free article] [PubMed] [Google Scholar]
- 58.Bonnet F, Vigneron M, Bensaude O, Dubois MF. Transcription-independent phosphorylation of the RNA polymerase II C-terminal domain (CTD) involves ERK kinases (MEK1/2) Nucleic Acids Res. 1999;27:4399–4404. doi: 10.1093/nar/27.22.4399. [DOI] [PMC free article] [PubMed] [Google Scholar]
- 59.Akaike H. A new look at the statistical model identification. IEEE Trans. Automat. Contr. 1974;19:716–723. [Google Scholar]
- 60.Schwarz G. Estimating the dimension of a model. Ann. Stat. 1978;6:461–464. [Google Scholar]
Associated Data
This section collects any data citations, data availability statements, or supplementary materials included in this article.