

Abstract
Technical advances in the field of live-cell imaging have introduced the cell biologist to a new, dynamic, subcellular world. The static world of molecules in fixed cells has now been extended to the time dimension. This allows the visualization and quantification of gene expression and intracellular trafficking events of the studied molecules and the associated enzymatic processes in individual cells, in real time.
It is now possible to follow changes in the spatial distribution of molecules as a function of time and of perturbations in the cellular environment. The kinetics of these movements, as well as their specific interactions with cellular structures, can be analysed using the power of digital imaging. The image sets can be subjected to mathematical analyses to enhance our understanding of molecular dynamics in living cells. Fluorescence microscopy provides the ability to quantify the number of molecules in cellular compartments, thereby transcending the qualitative, phenomenological constraints that have been the hallmark of experimental cell biology. The ability to study single molecules within single cells has been possible thanks to recent progress in the field of biological microscopy. A cell biologist today requires state-of-the-art microscopes, charge-coupled device (CCD) cameras that convert photons to electronic information, and powerful software tools for the subsequent analysis of the acquired images. This article will outline recent techniques that allow components of the gene-expression pathway to be followed in living cells and, in particular, will summarize the advances that are responsible for the detection and quantification of RNA molecules in real time and for the understanding of their expression in single cells.
The world of bioimaging
Over the past decade, a sea change has occurred in how images from the microscope are recorded and how the data are analysed. The shift from film to digital photography has caused similar revolutionary changes in the capturing of microscopic images. The improvements in CCD chips as well as the evolution of the electronic circuits that allow the unloading and storage of the collected data, together with the exponential increase in the speed of computers and in their storage capacity, now allow large-format (mega-pixel) images to be captured and stored rapidly, thereby making frame rates within the range of a few milliseconds achievable. This technological revolution allows cellular events to be recorded at speeds that are comparable to most biological trafficking events.
The speed of computational processing is essential for the analysis and preparation of these images. As each image, in effect, can represent millions of data points (pixels), the handling of these data becomes a bioinformatics problem. Images can contain information from the emission of many different dyes that have a diversity of spectral features, which make the data highly complex. For example, further parameters can be added to the two-dimensional (X–Y) image itself: time, the focal plane and wavelength. The speed of acquisition of the CCD cameras, as well as the precision of automated stages that control movement of the focal plane through the specimen, allow the investigator to collect three-dimensional images over time, thereby transforming a two-dimensional snapshot into a four-dimensional dynamic view of the intracellular space1.
Recent developments in tunable filters, which can be set to scan across a spectrum of wavelengths with high precision, now allow the readout of the entire spectral bandwidth of an image, enabling the combinatorial use of many more dyes2, 3. The introduction of wavelengths into the imaging process adds a fifth dimension and allows the precise relative quantification of different molecules in the three-dimensional element (which is known as the 'voxel' for volume pixel). These developments have transformed microscopes into powerful biometric readers that now allow cellular compartments to be used for the study of molecular interactions.
Microscopes have changed substantially over the years but perhaps the most significant component of the optical revolution is the software. Computer-processing units have allowed the speed of data handling to grow every year, even faster than the doubling of transistors per circuit as predicted by Moore's law4. This provides a platform for programs that require a massive throughput of data. An example is the deconvolution algorithms that enabled the three-dimensional reconstruction of images, whereby the collected light is re-assigned to its points of origin using constant iterations to obtain the best fit for all the individual points5. By using a 'point spread function', an algorithm can be designed that describes how the objective lens of each microscope distorts point sources of light through a series of focal steps, and a mathematical function can provide the basis for restoring the images to their ideal, undistorted state6. Such an analysis is computationally intensive, but restorations, which took several days until a few years ago, can now be done in minutes. Different deconvolution algorithms are now available and are becoming integral components of image-analysis software packages. Eventually, even real-time deconvolutions will become commonplace. This computational approach yields images that have a higher signal-to-noise ratio than can be achieved by confocal microscopy, because out-of-focus photons, which contain information, are used by many deconvolution algorithms to reconstruct the original spatial distribution of the emitted light.
By contrast, confocal microscopy discards photons that are not within the imaged plane. This information loss is detrimental to achieving the sensitivity that is required to detect single molecules. Furthermore, analogue photomultiplying tubes (PMT), which are required to amplify the signal in the imaging process of confocal microscopy, are less sensitive than the CCDs used in modern cameras that provide the digital conversion of photons into electronic information. The emerging technology of electron-multiplying CCDs (EMCCDs) that can detect extremely weak signals over noise will provide higher levels of sensitivity in photon collection. Furthermore, by both mathematical and physical approaches, it has been possible to develop super-resolution techniques that provide discrimination beyond the diffraction limit of light7, 8. Statistical analysis of light diffraction across a small area as well as using a laser to deplete the disperse fluorescent light makes it possible to effectively decrease so-called Raleigh scattering — which occurs when molecules are much smaller than the wavelength of the light — and thereby increase the resolution9.
Another avenue of progress over the past decade has been the quality and diversity of reagents10. New dyes such as the cyanines or Alexas provide high-quantum efficiency and low-bleaching properties. Also, new developments in single-excitation high-emission components such as quantum dots will provide new applications11. These technical advancements are now being harnessed in the emerging field of biophotonics in which photons are generated and then used for imaging, detection and manipulation of biological materials.
Below, we describe how these technical innovations have been put to use for the detection of nucleic-acid molecules in fixed cells and, ultimately, in living cells.
Observations in fixed, single cells
The ability to design reagents for fluorescence in situ hybridization (FISH) in conjunction with deconvolution has allowed the detection of single molecules of RNA12. The first attempts to understand transcription at the single-cell level allowed the detection of a gene that actively produces mRNA at the site of transcription and provided a first description of the transcriptional-activation events that take place at a gene locus. By activating the gene for increasing amounts of time using serum stimulation, it was possible to distinguish the site for β-actin mRNA transcription12. Probes that were directed to the 5' end detected all nascent transcripts, whereas probes that were directed to the 3' untranslated region (UTR) visualized only the nearly completed transcripts, which provided a means to address the timeframe and the kinetics of transcriptional activation.
The ability to visualize the site of gene expression allowed for the single-cell analysis of several genes that are active at the time of fixation. By conjugating several dyes to different oligonucleotide probes, a mixture of probes could be designed to comprise a 'spectral barcode'. In this way, each gene was uniquely labelled with a different set of dyes. The simultaneous identification of several transcription sites in a single cultured cell provided a snapshot of the transcriptome at the time of fixation and showed extensive variability in single-cell gene-expression profiles13. In another study, transcriptional activation of the α- and β-globin genes in erythroid cells was shown to follow a stochastic pattern of expression14. Detailed analyses of the patterns of gene expression in simple single-cell systems such as bacteria and yeast have shown the stochastic nature of gene expression15, 16, 17, 18, 19. These techniques for transcriptional visualization in fixed cells will be important in understanding complex genetic regulation such as that associated with imprinting, cellular responses to positional information within organs, or co-regulation pathways. For example, different spatial positioning within the nuclear volume of the α- and β-globin genes (which reside on separate chromosomes) has been observed in different cell types that originate from the haematopoietic system and have different expression levels of these genes20. These methods will also be useful in medical diagnostics by addressing specific gene-expression patterns at the cellular level in tissue biopsies.
Visualizing molecules in vivo
The dynamic nature of transcription requires methods that can follow gene expression in individual living cells. Imaging biological processes in vivo has been revolutionized since the introduction of genetically encoded fluorescent reagents. The use of green fluorescent protein (GFP) and its variants as fluorescent tags for the detection of cellular proteins by gene fusion have allowed a variety of proteins to be 'fluorescentized', in many cases with minimal functional consequences21. It is now feasible to co-express several fusion proteins in one cell, each of which is tagged with a different fluorescent protein, and then to follow their subcellular paths in living cells using a rapid-frame-rate camera that is coupled to a fluorescence microscope.
Selective labelling of molecules is now available using photoactivatable forms of GFP22 or fluorochromes that do not fluoresce until they are excited or 'uncaged'23. Another labelling approach, which overcomes the bulkiness of GFP proteins and their potential consequences for protein function, involves the use of small-molecule labels such as the FlAsH (fluorescein arsenic helix binder) and ReAsH (resorufin arsenic helix binder), which are fluorescent biarsenicals that specifically recognize genetically inserted binding motifs that contain four cysteine amino acids (tetracysteine motifs)10.
The digital format of the image files allows for measurements of the kinetic properties of these fluorescently labelled proteins. Imaging techniques such as fluorescence recovery after photobleaching (FRAP), fluorescence loss in photobleaching (FLIP), inverse-FRAP (i-FRAP) and uncaging by photoactivation (Box 1) can provide insights into the kinetics and trafficking of subsets of the studied proteins and their accessibility to different cellular compartments. This not only provides information on the overall mobility of molecules but also allows for the detection of sequential translocation of factors from one compartment to another24.
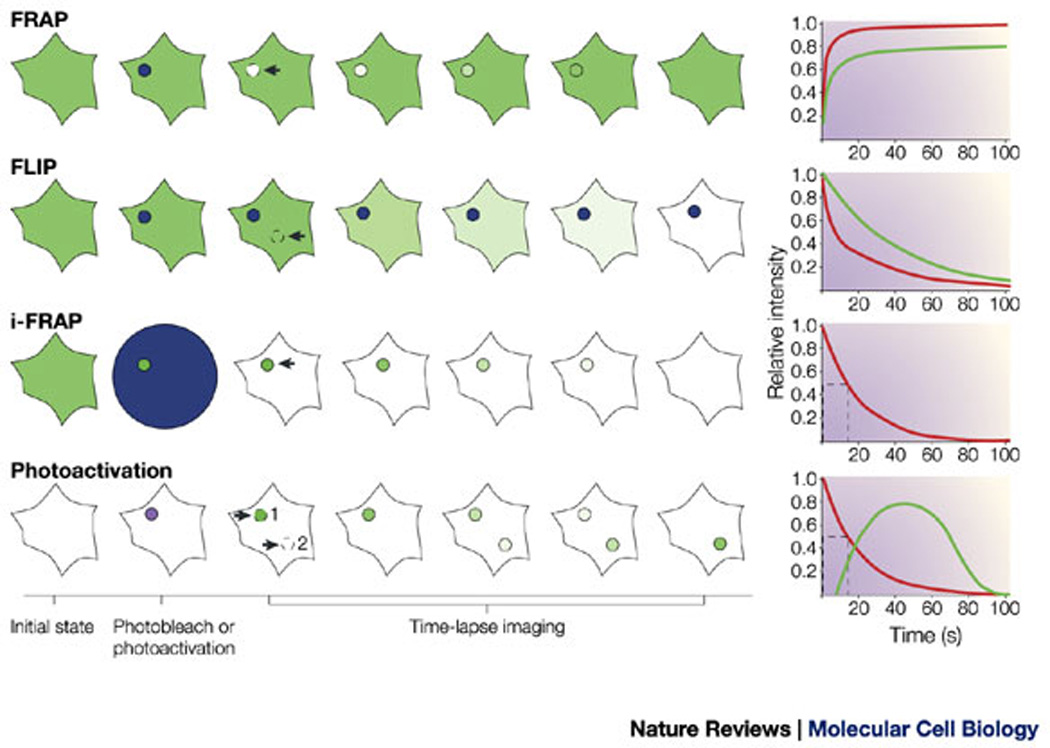
Box 1. Techniques for the analysis of protein kinetics in living cells.
Fluorescence recovery after photobleaching (FRAP)
The fluorescent signal (blue circle) is bleached in a small intracellular area and the recovery is measured inside this region as a function of time (see figure, top panel). Using this technique, diffusion coefficients (D) and the proportion of molecules that are mobile can be measured68. Red curve: 100% of molecules are diffusing (D = 0.5 µm2 s−1); green curve: 80% of molecules are diffusing (D = 0.2 µm2 s−1) and 20% are immobile.
Fluorescence loss in photobleaching (FLIP)
A small area (blue circle) is repeatedly photobleached and the loss in fluorescence intensity is recorded as a function of time in another region of the cell (see figure, second panel). FLIP provides measurements of the number of populations of a particular molecule and their relative proportions69. Green curve: a molecule that is present as a single population; red curve: two different populations of a molecule are present, each of which has a different rate constant.
Inverse-FRAP (i-FRAP)
The total fluorescent signal in a cell is bleached (blue circle) except for one area in which the signal is recorded as a function of time (see figure, third panel). This technique is useful for studying small organelles as it gives a direct readout of the residency time of different factors61, 66. One of the main limitations of this approach lies in the time that is needed to photobleach the total fluorescent signal that is present in a cell; this makes this technique unsuitable for detecting fast translocations as the signal is lost during the bleaching phase. Red curve: the fluorescent molecule has a half residency time of 15 seconds in the compartment that is being studied.
Photoactivation
A photoactivable version of green fluorescent protein (GFP), which has a decreased absorbance at 488 nm and therefore does not behave as wild-type GFP, is activated in a cell (purple circle) and fluorescence is recorded at the activation site (see figure, bottom panel). Although similar to i-FRAP, the advantage of photoactivation is that it requires less energy than bleaching. Sub-populations that move rapidly and have a short residence time can be detected, whereas in i-FRAP they are bleached and undetectable. Photoactivation allows for the spatial detection of the successive translocations of proteins in a cell, and therefore serves as a visual, pulse-chase, real-time view of protein dynamics22. Red curve: the fluorescent molecule has a half residency time of 15 seconds in the activated compartment 1. Green curve: the molecules translocate to compartment 2 after leaving compartment 1.
When attempting to observe single molecules, individual particles must be detected in each frame to address their different translocations, establishing a spatio-temporal continuum in their successive positions. In this way, one can transform a statistical view of molecular position into a meaningful dynamic view. According to the Nyquist sampling theorem, images must be acquired at least at twice the highest frequency of the movements for the data to be suitable for analysis by iterative detection. However, a limitation of the sampling rate is the sensitivity of the camera; obviously, an image must be registered to detect movement in subsequent frames. In some cases, biological processes will be too fast for the sensitivity of the camera. Therefore, a means to increase the signal and decrease the noise for each of these molecules must be part of the strategy for live-cell imaging. In the case of living cells, the use of several fluorescent proteins provides cumulative signal enhancement. Improvements in single-molecule resolution are essential and, to this end, efforts have been made to develop techniques for the imaging of single molecules in living cells. At first, these studies were focused on the visualization of the kinetics and dynamics of single molecules of fluorophores or proteins in aqueous solutions; later this was extended to the study of single-molecule dynamics within a living cell25. This expanding field now includes reports on enzymatic reactions and both intracellular and extracellular protein, lipid and nucleic-acid interactions on the single-molecule level26, 27, 28, 29, 30, 31.
Molecular dynamics of DNA and RNA
The fluorescent tagging of proteins for their detection in single-molecule studies is usually straightforward and is carried out either by a fusion with a fluorescent protein or by labelling with a fluorescent-dye moiety. In the case of nucleic acids, intramolecular-tagging approaches are required because the target sequences — chromosomal DNA or transcribed RNA — are typically not accessible to labelling in vivo, compared with proteins. Labelling of chromosomal regions in vivo can be achieved by the use of fluorescently tagged chromosome-binding proteins and has provided valuable insights into chromatin structure as well as the global dynamics of chromatin during interphase32, 33, 34 and mitosis35, 36, 37. An elegant strategy for labelling specific chromatin regions uses arrays of the lac operator (lacO) DNA sequence that are inserted into the DNA sequence of interest, and the expression of a fluorescent-protein–lac-repressor (lacI) fusion protein, which will bind to these DNA repeats38 (Box 2). This system has been useful for understanding issues such as chromosome positioning and chromosome movements in living cells39, 40, 41, 42.
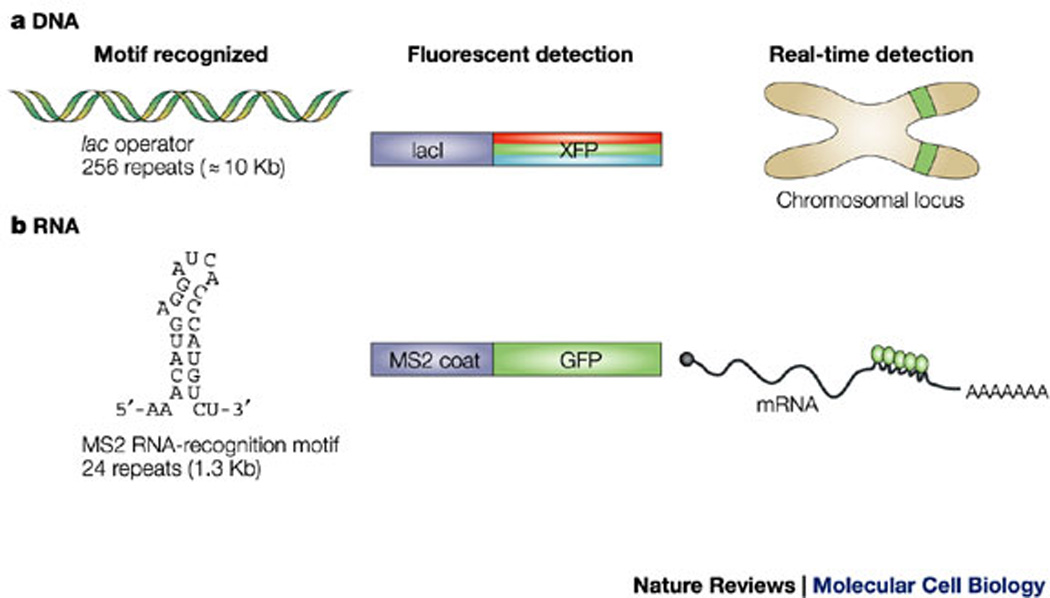
Box 2. Labelling techniques for the detection of nucleic acids in living cells.
DNA labelling
A tandemly repeated array (256 copies) of the lac operator (lacO) sequence is inserted into a chromosome. A fluorescent protein (XFP) is then artificially tethered to this specific DNA sequence by fusion to the DNA-binding lac-repressor protein (lacI), which binds these repeats and thereby allows for the detection of the integration locus in living cells (see figure, panel a).
RNA labelling
RNA molecules are detected using a fusion protein that comprises green fluorescent protein (GFP) and the MS2 bacteriophage coat protein, which has an extremely high affinity for a short RNA-recognition motif that is derived from the phage genome. Single mRNA molecules that contain as few as 24 MS2 RNA repeats can be detected (see figure, panel b).
RNA molecules that are conjugated to fluorescent dyes have been directly microinjected into living cells43, 44, but several techniques have been devised that avoid the need for this invasive procedure. These include the use of fluorescently labelled probes for in vivo hybridization45, 46, 47, caged fluorescent probes and photoactivation23, molecular 'beacons' that fluoresce only when the probes have hybridized to the target48 and RNA-binding proteins49, 50. These studies have used several microscope-based techniques to shed light on the general characteristics of the movement of the total population of mRNA molecules in the nucleoplasmic space. However, the stability of these labelled complexes might be problematic: the natural behaviour of the target RNA molecules could be compromised by the formation of double-stranded RNA molecules with the probe, and transcript-specific detection is an issue when using probes or proteins that bind to the entire mRNA pool.
A highly specific and extremely stable fluorescent-protein-based labelling system51 that does not affect the coding sequence of the mRNA and provides labelling for a specific sequence has been shown to have single-molecule sensitivity52. In this procedure, a series of RNA aptamers — stem–loops — are inserted into the transcript of interest, and the RNA is then tagged by the expression of a fusion protein that comprises a fluorescent protein fused to MS2 (a bacteriophage coat protein) that forms specific and stable interactions with these secondary structures (Box 2). These mRNA molecules had the same properties as an endogenous mRNA; that is, they are transcribed, exported from the nucleus and translated53.
This method has proven useful for studying the behaviour of single RNA molecules in living cells52, 53. First, quantification of the transcripts of interest was carried out by sensitive FISH in fixed cells to confirm that they travel as single transcripts12. These single mRNA molecules, which bound to GFP–MS2 protein, formed particles that were then tracked, either in the cytoplasm or in the nucleoplasm. As the technique of single-particle tracking allows for the direct analysis of the motion characteristics of a particular object that is being observed in its cellular environment, it provides a means to identify the cause-and-effect relationship between intracellular organization and molecule, complex or organelle mobility54. For example, the tracked cytoplasmic RNA particles showed a whole range of movements that could be characterized as diffusive, corralled, directed or stationary and could switch between these different mobilities. Furthermore, directed movements were shown to follow cytoplasmic filaments52. In the nucleus, mRNP movements were found to be non-directional and random, being controlled by rules of simple diffusion and not requiring energy. The mobility of these mRNP molecules could be correlated to the formation of diffusion barriers by chromatin domains53. Whereas single-particle tracking proved useful for the analysis of mRNP movements in their nuclear microenvironments, FRAP analysis was used to follow the characteristics of the whole population of these mRNPs, and photoactivation was used to address the mobility of subpopulations of mRNPs at the time of their release from the site of transcription.
Since this technology discerned the subsets of single mobile transcripts, it was possible to use this system to define a possible mechanism for RNA localization55. During this biological process only certain transcripts are mobilized to specific areas in the cell, whereas other transcripts are not. Using the above technique, single mRNA molecules that contain the 3' UTR of the β-actin gene, which is required for β-actin mRNA localization at the leading edge of fibroblasts, showed a high frequency of directed movements on microtubules52 (Fig. 1,supplementary information S1 (movie)). Other studies have examined the localization of single RNA particles or granules. RNA granules in dendrites of hippocampal cultures had oscillatory and directed movements56. In budding yeast, ASH1 (asymmetric synthesis of HO endonuclease) mRNA could be seen moving directionally into the daughter cell and this movement was dependent on a myosin motor protein51 (Fig. 2).
Figure 1. Dynamics of mRNA molecules in the cytoplasm of mammalian cells.
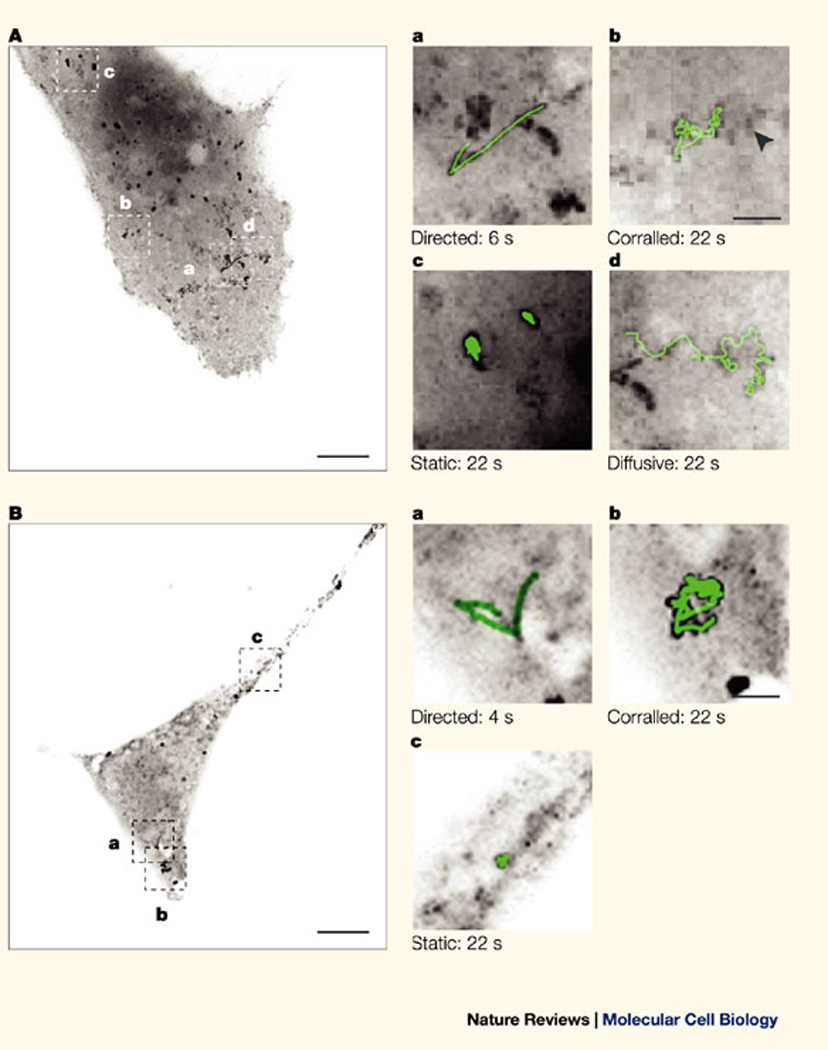
A | An mRNA transcript that contains the coding sequence of lacZ, 24 MS2 stem–loops and the 3' untranslated region (UTR) of the human growth-hormone gene (hGH) was transiently expressed in COS cells together with the green fluorescent protein (GFP)–MS2 fusion protein. GFP–MS2-tagged RNA particles were followed, and different types of motility were detected in single living cells: directed (Aa), corralled (Ab), static (Ac) and diffusive (Ad). The image in A is a maximum-intensity image projection of 200 time frames. Bar, 10 µm. Panels Aa–Ad are magnified sections of A that show an mRNA track (in green) superimposed on an enlargement from each of the indicated boxed areas. The arrowhead points to a 'static' particle in the vicinity of a 'corralled' particle. Bar, 2 µm. B | An mRNA transcript that contains the coding sequence of lacZ, 24 MS2 stem–loops and the 3' UTR of SV40 was transiently expressed in COS cells together with the GFP–MS2 protein and analysed as above. Reproduced with permission from Ref. 52
Figure 2. Analysis of ASH1-particle movement in yeast.
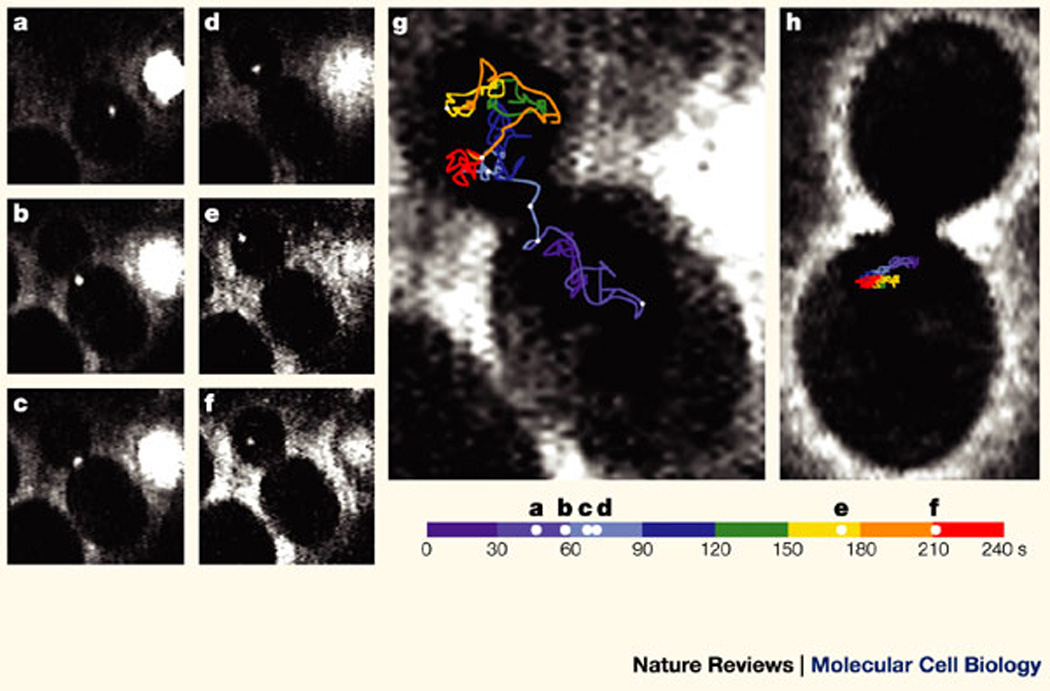
Yeast that expresses both the ASH1 (asymmetric synthesis of HO endonuclease) reporter gene, which contains MS2 stem–loops, and the green fluorescent protein (GFP)–MS2 protein were observed using epifluorescence and bright-field microscopy. Movement of the GFP–MS2-coated ASH1 mRNA particle was recorded and followed over time. Images are presented at indicated intervals. a–f | Movement of the particle from the mother cell to the bud (total distance: 23 µm in 128 s). g | The diagram shows the total path of the particle movement (43 µm in 240 s). Intervals of 30 s each are represented by different colours and images a–f are indicated by white dots on the travel line. The particle spends 180 out of 240 s in the bud and ~ 60 s localized at or near the bud tip. h | A yeast strain that contains a deletion of she1 (a microfilament motor that is required for the localization of ASH1 to the bud tip) and was analysed by the same approach showed significantly less net displacement and stayed within the mother cell, never localizing to the bud tip. Bar, 2 µm. Reproduced with permission from Ref.51
The RNA-localization process could also be observed in a whole organism. Endogenous nanos mRNA was labelled with GFP–MS2 and its localization in developing Drosophila melanogaster eggs — from the ovarian nurse cells to the posterior pole of the oocyte — was recorded in real time57 (supplementary information S2 (movie)). This was found to be a diffusion-based pathway that is assisted by the microtubule network — yet, once at the posterior pole, these mRNA molecules were anchored by an actin-dependent mechanism.
Further studies using single RNA techniques in these and in other cell systems58 should reveal new insights into the specific behaviours of RNA molecules. A fundamental step forward would be the ability to visualize the dynamics of nucleic acids in living tissues and animals with the use of two-photon microscopy59, 60. This imaging technique provides greater imaging depth, less photobleaching and little background, as fluorescence occurs only at the plane of focus. Combination of the in vivo nucleic-acid labelling systems described above with two-photon microscopy will be a powerful tool for the study of intracellular dynamics.
Imaging transcription in real time
Photobleaching techniques such as FRAP, i-FRAP and FLIP (Box 1) provide a direct estimation of the mobility of different complexes in living cells. This is an effective tool for studying enzymatic reactions as the mobilities for different complexes can be correlated with different steps of the reaction. This approach has been used to investigate the activity of RNA polymerase I in the nucleolus61. In this case, the elongating polymerase is seen as an immobile fraction that is trapped on the rDNA in the nucleolus, which gives a direct reading of the elongation time of this reaction. Moreover, it was possible to differentiate between soluble pools of RNA polymerase I and gain insight into the process of RNA-polymerase-I assembly on a gene.
In live mammalian cells, the lacO–lacI reporter system38 (Box 2) has allowed the direct observation of the unfolding of the chromatin structure following the onset of transcription62. This system41, combined with the MS2–GFP reporter system, has allowed the simultaneous observation of the production of an mRNA molecule at the transcription site, thereby providing the first real-time analysis of the onset of transcription in a live cell39 (supplementary information S3 (movie)). Similarly, the recruitment to chromatin of the lacI-tagged oestrogen receptor and its co-activators, was studied63. In another system, which used an integrated array of the mouse mammary tumour virus (MMTV) promoter, the dynamics of the binding of nuclear receptors and their co-activators to the promoter were studied64, 65. These techniques open the door to the analysis of transcriptional-network dynamics. Using different promoters, it will be possible to dissect the temporal responses of different genes, and thereby unravel the dynamics of the activation of specific genes.
Kinetic studies of most biological processes require computational approaches that can model the rapid transitions in molecular states66, 67. The techniques that are described in Box 1, which are based on fluorescent proteins, allow the visualization of the steady-state distribution of many components in a live cell or organism. Photoattenuation or photoactivation of these fluorescent markers transiently marks part of the population of molecules, allowing the kinetics of their redistribution to be monitored. These measurements address the mobility of only the particular fluorescent molecules that are being studied, and the interactions with other molecules, such as enzymes or cellular structures, remain unseen. Computer-assisted mathematical models can define the kinetic behaviour and detect the presence of some of the unseen components, by providing association constants, enzymatic rates or diffusion coefficients67, 68. For example, MS2 RNA tags offer direct fluorescent readouts of an enzymatic reaction (transcription), the processing of transcripts and their release into the nucleoplasm. The kinetic information that is obtained, combined with the power of computational analysis of each of these steps, will undoubtedly start a new era in the understanding of the biology of gene expression.
Implications and future directions
The era of genetically encoded and introduced biomarkers and their synergy with the emerging area of biophotonics has only just begun. For example, the use of two-photon microscopy will extend into cells within living tissues. Normal and pathological cells can now be defined by their single-cell gene-expression profiles, which will lead to a more effective prognosis. Living cells can now be interrogated to a degree of temporal and spatial resolution that is sufficient to reveal those rapid molecular events that were previously undetected. By studying individual living cells we can achieve a new perspective, which is different from the concepts that were derived from data where populations of cells have been averaged and their diversity merged into a median trait — a process that we have termed 'the myth of the average cell'19. For example, in the case of gene expression, we will be able to see the on and off 'flickering' of genes as cells respond to rapid fluxes in their microenvironment. Processes that seem random and probabilistic might reveal higher orders of organization when they are studied as networks of single events using the power of mathematical modelling. We will be able to 'turn on' genes using the directed energy of light from microscope lasers, and then follow the results of expression of a single gene product in a single cell within a tissue. The ability to encode small motifs in proteins will allow us to follow the proteins that are made from a single mRNA. The synthesis of caging groups on any protein of interest will allow us to functionally photoactivate any protein we wish in any region of a cell. The refinement of other imaging techniques such as fluorescence resonance energy transfer (FRET), possibly in combination with fluorescence lifetime imaging microscopy (FLIM) or fluorescence correlation spectroscopy (FCS), will allow the analysis of the spatial and temporal interactions of several proteins in a single cell. These and more developments to come will make biophotonics a field that will drive the discovery of new principles of cellular and molecular biology.
Supplementary Material
Acknowledgments
We would like to thank B. Ovryn for critical reading of the manuscript. R.H.S is supported by the National Institutes of Health.
Footnotes
Competing interests statement
The authors declare no competing financial interests.
References
- 1.Gerlich D, Ellenberg J. 4D imaging to assay complex dynamics in live specimens. Nature Cell Biol. 2003;5:S14–S19. [PubMed] [Google Scholar]
- 2.Zimmermann T, Rietdorf J, Pepperkok R. Spectral imaging and its applications in live cell microscopy. FEBS Lett. 2003;546:87–92. doi: 10.1016/s0014-5793(03)00521-0. [DOI] [PubMed] [Google Scholar]
- 3.Patterson G, Day RN, Piston D. Fluorescent protein spectra. J. Cell Sci. 2001;114:837–838. doi: 10.1242/jcs.114.5.837. [DOI] [PubMed] [Google Scholar]
- 4.Peercy PS. The drive to miniaturization. Nature. 2000;406:1023–1026. doi: 10.1038/35023223. [DOI] [PubMed] [Google Scholar]
- 5.Carrington WA, Fogarty K, Fay FS. In: 3D fluorescence imaging of single cells using image restoration. Foskett K, Grinstein S, editors. New York: Wiley–Liss Inc.; 1990. [Google Scholar]
- 6.Wallace W, Schaefer LH, Swedlow JR. A workingperson's guide to deconvolution in light microscopy. Biotechniques. 2001;31:1076–1097. doi: 10.2144/01315bi01. [DOI] [PubMed] [Google Scholar]
- 7.Carrington WA, et al. Superresolution three-dimensional images of fluorescence in cells with minimal light exposure. Science. 1995;268:1483–1487. doi: 10.1126/science.7770772. [DOI] [PubMed] [Google Scholar]
- 8.Hell SW. Toward fluorescence nanoscopy. Nature Biotechnol. 2003;21:1347–1355. doi: 10.1038/nbt895. [DOI] [PubMed] [Google Scholar]
- 9.Dyba M, Jakobs S, Hell SW. Immunofluorescence stimulated emission depletion microscopy. Nature Biotechnol. 2003;21:1303–1304. doi: 10.1038/nbt897. [DOI] [PubMed] [Google Scholar]
- 10.Zhang J, Campbell RE, Ting AY, Tsien RY. Creating new fluorescent probes for cell biology. Nature Rev. Mol. Cell Biol. 2002;3:906–918. doi: 10.1038/nrm976. [DOI] [PubMed] [Google Scholar]
- 11.Chan WC, et al. Luminescent quantum dots for multiplexed biological detection and imaging. Curr. Opin. Biotechnol. 2002;13:40–46. doi: 10.1016/s0958-1669(02)00282-3. [DOI] [PubMed] [Google Scholar]
- 12.Femino AM, Fay FS, Fogarty K, Singer RH. Visualization of single RNA transcripts in situ. Science. 1998;280:585–590. doi: 10.1126/science.280.5363.585. [DOI] [PubMed] [Google Scholar]
- 13.Levsky JM, Shenoy SM, Pezo RC, Singer RH. Single-cell gene expression profiling. Science. 2002;297:836–840. doi: 10.1126/science.1072241. [DOI] [PubMed] [Google Scholar]
- 14.de Krom M, van de Corput M, von Lindern M, Grosveld F, Strouboulis J. Stochastic patterns in globin gene expression are established prior to transcriptional activation and are clonally inherited. Mol. Cell. 2002;9:1319–1326. doi: 10.1016/s1097-2765(02)00558-0. [DOI] [PubMed] [Google Scholar]
- 15.Elowitz MB, Levine AJ, Siggia ED, Swain PS. Stochastic gene expression in a single cell. Science. 2002;297:1183–1186. doi: 10.1126/science.1070919. [DOI] [PubMed] [Google Scholar]
- 16.Raser JM, O'Shea EK. Control of stochasticity in eukaryotic gene expression. Science. 2004;304:1811–1814. doi: 10.1126/science.1098641. [DOI] [PMC free article] [PubMed] [Google Scholar]
- 17.Elowitz MB, Leibler S. A synthetic oscillatory network of transcriptional regulators. Nature. 2000;403:335–338. doi: 10.1038/35002125. [DOI] [PubMed] [Google Scholar]
- 18.Biggar SR, Crabtree GR. Cell signaling can direct either binary or graded transcriptional responses. EMBO J. 2001;20:3167–3176. doi: 10.1093/emboj/20.12.3167. [DOI] [PMC free article] [PubMed] [Google Scholar]
- 19.Levsky JM, Singer RH. Gene expression and the myth of the average cell. Trends Cell Biol. 2003;13:4–6. doi: 10.1016/s0962-8924(02)00002-8. [DOI] [PubMed] [Google Scholar]
- 20.Brown KE, et al. Expression of α- and β-globin genes occurs within different nuclear domains in haemopoietic cells. Nature Cell Biol. 2001;3:602–606. doi: 10.1038/35078577. [DOI] [PubMed] [Google Scholar]
- 21.Simpson JC, Neubrand VE, Wiemann S, Pepperkok R. Illuminating the human genome. Histochem. Cell Biol. 2001;115:23–29. doi: 10.1007/s004180000236. [DOI] [PubMed] [Google Scholar]
- 22.Patterson GH, Lippincott-Schwartz J. Selective photolabeling of proteins using photoactivatable GFP. Methods. 2004;32:445–450. doi: 10.1016/j.ymeth.2003.10.006. [DOI] [PubMed] [Google Scholar]
- 23.Politz JC, Tuft RA, Pederson T, Singer RH. Movement of nuclear poly(A) RNA throughout the interchromatin space in living cells. Curr. Biol. 1999;9:285–291. doi: 10.1016/s0960-9822(99)80136-5. [DOI] [PubMed] [Google Scholar]
- 24.Lippincott-Schwartz J, Snapp E, Kenworthy A. Studying protein dynamics in living cells. Nature Rev. Mol. Cell Biol. 2001;2:444–456. doi: 10.1038/35073068. [DOI] [PubMed] [Google Scholar]
- 25.Sako Y, Yanagida T. Single-molecule visualization in cell biology. Nature Rev. Mol. Cell Biol. 2003;4:SS1–SS5. [PubMed] [Google Scholar]
- 26.Dahan M, et al. Diffusion dynamics of glycine receptors revealed by single-quantum dot tracking. Science. 2003;302:442–445. doi: 10.1126/science.1088525. [DOI] [PubMed] [Google Scholar]
- 27.Seisenberger G, et al. Real-time single-molecule imaging of the infection pathway of an adeno-associated virus. Science. 2001;294:1929–1932. doi: 10.1126/science.1064103. [DOI] [PubMed] [Google Scholar]
- 28.Watanabe N, Mitchison TJ. Single-molecule speckle analysis of actin filament turnover in lamellipodia. Science. 2002;295:1083–1086. doi: 10.1126/science.1067470. [DOI] [PubMed] [Google Scholar]
- 29.Ueda M, Sako Y, Tanaka T, Devreotes P, Yanagida T. Single-molecule analysis of chemotactic signaling in Dictyostelium cells. Science. 2001;294:864–867. doi: 10.1126/science.1063951. [DOI] [PubMed] [Google Scholar]
- 30.Schutz GJ, Kada G, Pastushenko VP, Schindler H. Properties of lipid microdomains in a muscle cell membrane visualized by single molecule microscopy. EMBO J. 2000;19:892–901. doi: 10.1093/emboj/19.5.892. [DOI] [PMC free article] [PubMed] [Google Scholar]
- 31.Sako Y, Minoghchi S, Yanagida T. Single-molecule imaging of EGFR signalling on the surface of living cells. Nature Cell Biol. 2000;2:168–172. doi: 10.1038/35004044. [DOI] [PubMed] [Google Scholar]
- 32.Phair RD, Misteli T. High mobility of proteins in the mammalian cell nucleus. Nature. 2000;404:604–609. doi: 10.1038/35007077. [DOI] [PubMed] [Google Scholar]
- 33.Lever MA, Th'ng JP, Sun X, Hendzel MJ. Rapid exchange of histone H1.1 on chromatin in living human cells. Nature. 2000;408:873–876. doi: 10.1038/35048603. [DOI] [PubMed] [Google Scholar]
- 34.Kimura H, Cook PR. Kinetics of core histones in living human cells: little exchange of H3 and H4 and some rapid exchange of H2B. J. Cell Biol. 2001;153:1341–1353. doi: 10.1083/jcb.153.7.1341. [DOI] [PMC free article] [PubMed] [Google Scholar]
- 35.Gerlich D, et al. Global chromosome positions are transmitted through mitosis in mammalian cells. Cell. 2003;112:751–764. doi: 10.1016/s0092-8674(03)00189-2. [DOI] [PubMed] [Google Scholar]
- 36.Walter J, Schermelleh L, Cremer M, Tashiro S, Cremer T. Chromosome order in HeLa cells changes during mitosis and early G1, but is stably maintained during subsequent interphase stages. J. Cell Biol. 2003;160:685–697. doi: 10.1083/jcb.200211103. [DOI] [PMC free article] [PubMed] [Google Scholar]
- 37.Manders EM, et al. Four-dimensional imaging of chromatin dynamics during the assembly of the interphase nucleus. Chromosome Res. 2003;11:537–547. doi: 10.1023/a:1024995215340. [DOI] [PubMed] [Google Scholar]
- 38.Robinett CC, et al. In vivo localization of DNA sequences and visualization of large-scale chromatin organization using lac operator/repressor recognition. J. Cell Biol. 1996;135:1685–1700. doi: 10.1083/jcb.135.6.1685. [DOI] [PMC free article] [PubMed] [Google Scholar]
- 39.Janicki SM, et al. From silencing to gene expression: real-time analysis in single cells. Cell. 2004;116:683–698. doi: 10.1016/s0092-8674(04)00171-0. [DOI] [PMC free article] [PubMed] [Google Scholar]
- 40.Heun P, Laroche T, Shimada K, Furrer P, Gasser SM. Chromosome dynamics in the yeast interphase nucleus. Science. 2001;294:2181–2186. doi: 10.1126/science.1065366. [DOI] [PubMed] [Google Scholar]
- 41.Tsukamoto T, et al. Visualization of gene activity in living cells. Nature Cell Biol. 2000;2:871–878. doi: 10.1038/35046510. [DOI] [PubMed] [Google Scholar]
- 42.Chubb JR, Boyle S, Perry P, Bickmore WA. Chromatin motion is constrained by association with nuclear compartments in human cells. Curr. Biol. 2002;12:439–445. doi: 10.1016/s0960-9822(02)00695-4. [DOI] [PubMed] [Google Scholar]
- 43.Ainger K, et al. Transport and localization of exogenous myelin basic protein mRNA microinjected into oligodendrocytes. J. Cell Biol. 1993;123:431–441. doi: 10.1083/jcb.123.2.431. [DOI] [PMC free article] [PubMed] [Google Scholar]
- 44.Glotzer JB, Saffrich R, Glotzer M, Ephrussi A. Cytoplasmic flows localize injected oskar RNA in Drosophila oocytes. Curr. Biol. 1997;7:326–337. doi: 10.1016/s0960-9822(06)00156-4. [DOI] [PubMed] [Google Scholar]
- 45.Politz JC, Browne ES, Wolf DE, Pederson T. Intranuclear diffusion and hybridization state of oligonucleotides measured by fluorescence correlation spectroscopy in living cells. Proc. Natl Acad. Sci. USA. 1998;95:6043–6048. doi: 10.1073/pnas.95.11.6043. [DOI] [PMC free article] [PubMed] [Google Scholar]
- 46.Carmo-Fonseca M, et al. In vivo detection of snRNP-rich organelles in the nuclei of mammalian cells. EMBO J. 1991;10:1863–1873. doi: 10.1002/j.1460-2075.1991.tb07712.x. [DOI] [PMC free article] [PubMed] [Google Scholar]
- 47.Molenaar C, Abdulle A, Gena A, Tanke HJ, Dirks RW. Poly(A)+ RNAs roam the cell nucleus and pass through speckle domains in transcriptionally active and inactive cells. J. Cell Biol. 2004;165:191–202. doi: 10.1083/jcb.200310139. [DOI] [PMC free article] [PubMed] [Google Scholar]
- 48.Bratu DP, Cha BJ, Mhlanga MM, Kramer FR, Tyagi S. Visualizing the distribution and transport of mRNAs in living cells. Proc. Natl Acad. Sci. USA. 2003;100:13308–13313. doi: 10.1073/pnas.2233244100. [DOI] [PMC free article] [PubMed] [Google Scholar]
- 49.Calapez A, et al. The intranuclear mobility of messenger RNA binding proteins is ATP dependent and temperature sensitive. J. Cell Biol. 2002;159:795–805. doi: 10.1083/jcb.200203046. [DOI] [PMC free article] [PubMed] [Google Scholar]
- 50.Theurkauf WE, Hazelrigg TI. In vivo analyses of cytoplasmic transport and cytoskeletal organization during Drosophila oogenesis: characterization of a multi-step anterior localization pathway. Development. 1998;125:3655–3666. doi: 10.1242/dev.125.18.3655. [DOI] [PubMed] [Google Scholar]
- 51.Bertrand E, et al. Localization of ASH1 mRNA particles in living yeast. Mol. Cell. 1998;2:437–445. doi: 10.1016/s1097-2765(00)80143-4. [DOI] [PubMed] [Google Scholar]
- 52.Fusco D, et al. Single mRNA molecules demonstrate probabilistic movement in living mammalian cells. Curr. Biol. 2003;13:161–167. doi: 10.1016/s0960-9822(02)01436-7. [DOI] [PMC free article] [PubMed] [Google Scholar]
- 53.Shav-Tal Y, et al. Dynamics of single mRNPs in nuclei of living cells. Science. 2004;304:1797–1800. doi: 10.1126/science.1099754. [DOI] [PMC free article] [PubMed] [Google Scholar]
- 54.Platani M, Goldberg I, Lamond AI, Swedlow JR. Cajal body dynamics and association with chromatin are ATP-dependent. Nature Cell Biol. 2002;4:502–508. doi: 10.1038/ncb809. [DOI] [PubMed] [Google Scholar]
- 55.Singer RH. RNA localization: visualization in real-time. Curr. Biol. 2003;13:R673–R675. doi: 10.1016/s0960-9822(03)00605-5. [DOI] [PubMed] [Google Scholar]
- 56.Rook MS, Lu M, Kosik KS. CaMKIIα 3' untranslated region-directed mRNA translocation in living neurons: visualization by GFP linkage. J. Neurosci. 2000;20:6385–6393. doi: 10.1523/JNEUROSCI.20-17-06385.2000. [DOI] [PMC free article] [PubMed] [Google Scholar]
- 57.Forrest KM, Gavis ER. Live imaging of endogenous RNA reveals a diffusion and entrapment mechanism for nanos mRNA localization in Drosophila. Curr. Biol. 2003;13:1159–1168. doi: 10.1016/s0960-9822(03)00451-2. [DOI] [PubMed] [Google Scholar]
- 58.Basyuk E, et al. Retroviral genomic RNAs are transported to the plasma membrane by endosomal vesicles. Dev. Cell. 2003;5:161–174. doi: 10.1016/s1534-5807(03)00188-6. [DOI] [PubMed] [Google Scholar]
- 59.Cahalan MD, Parker I, Wei SH, Miller MJ. Two-photon tissue imaging: seeing the immune system in a fresh light. Nature Rev. Immunol. 2002;2:872–880. doi: 10.1038/nri935. [DOI] [PMC free article] [PubMed] [Google Scholar]
- 60.Condeelis J, Segall JE. Intravital imaging of cell movement in tumours. Nature Rev. Cancer. 2003;3:921–930. doi: 10.1038/nrc1231. [DOI] [PubMed] [Google Scholar]
- 61.Dundr M, et al. A kinetic framework for a mammalian RNA polymerase in vivo. Science. 2002;298:1623–1626. doi: 10.1126/science.1076164. [DOI] [PubMed] [Google Scholar]
- 62.Tumbar T, Belmont AS. Interphase movements of a DNA chromosome region modulated by VP16 transcriptional activator. Nature Cell Biol. 2001;3:134–139. doi: 10.1038/35055033. [DOI] [PubMed] [Google Scholar]
- 63.Stenoien DL, et al. Ligand-mediated assembly and real-time cellular dynamics of estrogen receptor α-coactivator complexes in living cells. Mol. Cell. Biol. 2001;21:4404–4412. doi: 10.1128/MCB.21.13.4404-4412.2001. [DOI] [PMC free article] [PubMed] [Google Scholar]
- 64.McNally JG, Muller WG, Walker D, Wolford R, Hager GL. The glucocorticoid receptor: rapid exchange with regulatory sites in living cells. Science. 2000;287:1262–1265. doi: 10.1126/science.287.5456.1262. [DOI] [PubMed] [Google Scholar]
- 65.Becker M, et al. Dynamic behavior of transcription factors on a natural promoter in living cells. EMBO Rep. 2002;3:1188–1194. doi: 10.1093/embo-reports/kvf244. [DOI] [PMC free article] [PubMed] [Google Scholar]
- 66.Phair RD, Gorski SA, Misteli T. Measurement of dynamic protein binding to chromatin in vivo, using photobleaching microscopy. Methods Enzymol. 2004;375:393–414. doi: 10.1016/s0076-6879(03)75025-3. [DOI] [PubMed] [Google Scholar]
- 67.Phair RD, Misteli T. Kinetic modelling approaches to in vivo imaging. Nature Rev. Mol. Cell Biol. 2001;2:898–907. doi: 10.1038/35103000. [DOI] [PubMed] [Google Scholar]
- 68.Carrero G, McDonald D, Crawford E, de Vries G, Hendzel MJ. Using FRAP and mathematical modeling to determine the in vivo kinetics of nuclear proteins. Methods. 2003;29:14–28. doi: 10.1016/s1046-2023(02)00288-8. [DOI] [PubMed] [Google Scholar]
- 69.Cole NB, et al. Diffusional mobility of Golgi proteins in membranes of living cells. Science. 1996;273:797–801. doi: 10.1126/science.273.5276.797. [DOI] [PubMed] [Google Scholar]
Associated Data
This section collects any data citations, data availability statements, or supplementary materials included in this article.