

Abstract
BACKGROUND
African–American men with prostate cancer (PCa) present with higher-grade and -stage tumors compared to Caucasians. While the disparity may result from multiple factors, a biological basis is often strongly suspected. Currently, few well-characterized experimental model systems are available to study the biological basis of racial disparity in PCa. We report a validated in vitro cell line model system that could be used for the purpose.
METHODS
We assembled a PCa cell line model that included currently available African–American PCa cell lines and LNCaP (androgen-dependent) and C4-2 (castration-resistant) Caucasian PCa cells. The utility of the cell lines in studying the biological basis of variance in a malignant phenotype was explored using a multiplex biomarker panel consisting of proteins that have been proven to play a role in the progression of PCa. The panel expression was evaluated by Western blot and RT-PCR in cell lines and validated in human PCa tissues by RT-PCR. As proof-of-principle to demonstrate the utility of our model in functional studies, we performed MTS viability assays and molecular studies.
RESULTS
The dysregulation of the multiplex biomarker panel in primary African–American cell line (E006AA) was similar to metastatic Caucasian cell lines, which would suggest that the cell line model could be used to study an inherent aggressive phenotype in African–American men with PCa. We had previously demonstrated that Protein kinase D1 (PKD1) is a novel kinase that is down regulated in advanced prostate cancer. We established the functional relevance by over expressing PKD1, which resulted in decreased proliferation and epithelial mesenchymal transition (EMT) in PCa cells. Moreover, we established the feasibility of studying the expression of the multiplex biomarker panel in archived human PCa tissue from African–Americans and Caucasians as a prelude to future translational studies.
CONCLUSION
We have characterized a novel in vitro cell line model that could be used to study the biological basis of disparity in PCa between African–Americans and Caucasians.
Keywords: protein kinase D1, racial disparity, Metallothionein, N-cadherin, MMPs, E006AA, T120 beta-catenin, S11 snail
INTRODUCTION
The incidence and mortality rate of prostate cancer (PCa) is 1.1 and 2.4 times (respectively) higher in African–Americans compared to Caucasians. In addition, African–Americans are diagnosed with PCa at a younger age, have higher Gleason scores, are more likely to have bilateral prostate involvement, and the prostate gland tends to be larger with greater tumor volume compared to Caucasians [1]. The reasons for these differences are likely multifactorial and may stem from modifiable factors like socioeconomic status, environmental exposure, lifestyle variations, and cultural beliefs [2,3], or from non-modifiable factors such as genetic [4] and other biologicalcauses that include variations in gene sequence, expression [5], or DNA methylation [6]. African–Americans and Caucasians have differentialexpression of genes involved in immune response, apoptosis, focal adhesion, and the Wnt signaling pathway in prostate epithelial and stromal tissue [5,7,8]. Our laboratory discovered and studied the role of protein kinase D1 (PKD1), a novel tumor and metastasis suppressor in prostate cancer [9]; furthermore, we have described several proteins that interact with PKD1 and contribute to PCa [9–18].
The loss of PKD1 is associated with epithelial mesenchymal transition (EMT) in prostate cancer [18,19]. EMT induces a mesenchymal and invasive phenotype to epithelial cancers by altered gene expression [20]. EMT is also associated with loss of epithelial markers expression [21]. PKD1 interacts and phosphorylates the classic epithelial marker E-cadherin and its interacting protein beta-catenin [15]. PKD1 also interacts with androgen receptor (AR), which is known to contribute to PCa development, progression, and resistance to treatment [22]. PKD1 facilitates nuclear translocation of AR by phosphorylation of heat shock protein 27 at serine 38 [16]. Moreover, PKD1 regulates other proteins involved in cancer progression, including matrix metalloproteinase MMP-2, and MMP-9 [17].
Based on work from our laboratory and others, we generated a multiplex biomarker panel (MBP) that could portend progression in men with PCa. We explored whether the MBP could be used to study the biological basis of aggressive phenotype in men with PCa. As a first step, we assembled and characterized a cell line model for comparative studies between African–Americans and Caucasians with PCa. Our study demonstrates that the MBP is characteristically dysregulated in primary African–American PCa cell line similar to metastatic Caucasian cells. Therefore, our model may be used for comparative studies of potentially aggressive tumors in African–American men with PCa.
MATERIALS AND METHODS
Cell Lines and Culture Conditions
We used two cell lines derived from Caucasians, LNCaP (androgen-dependent cells derived from lymph node metastasis) and C4-2 (castration-resistant cells derived from LNCaP cells), and two cell lines derived from African–Americans, E006AA (derived from primary PCa), and MDAPCa2b (derived from bone metastasis). E006AA was a generous gift from Dr. Shahriar Koochekpour (Roswell Park Institute, University at Buffalo, State University of New York) [23] and three additional cell lines were obtained from ATCC (Manassas, VA). Cell lines were authenticated during culture by STR DNA profiling using PowerPlex 16HS (Promega) (Supplementary Table SI). LNCaP, C4-2, and E006AA were cultured in RPMI (HyClone) supplemented with 10% fetal bovine serum (FBS) and 1% antibiotic/anti-fungal solution. MDAPCa2b cells were cultured in HPC1 (AthenaES) supplemented with 20% FBS. All cell lines were cultured in a 5% CO2 incubator at 37°C, and the growth medium was exchanged every 2–3 days.
Prostate Cancer Tissue Collection
Snap frozen PCa tissue from African–American and Caucasian men with matching Gleason scores were obtained from the tumor tissue bank of the Comprehensive Cancer Center of Wake Forest University School of Medicine following institutional approval (IRB# IRB00028125).
MTS Assays
Approximately 5×10³ cells per well were seeded into 96-well plates. Cell proliferation was evaluated after 72 hr by incubating cells in MTS/PMS mix (CellTiter 96 Aqueous MTS reagent, G1111, Promega, phenazine methosulfate, P9625, Sigma) for 1 hr at 37°C. Absorbance was detected at 490 nm with a microplate reader (SpectraMax M5, Molecular Devices). The culture medium was used as a blank. Experiments were performed in triplicate.
Real-Time PCR (RT-PCR)
RNA was extracted from PCa tissue samples and cultured PCa cells using the RNeasy Plus Mini kit (74134, Qiagen). For PCa tissue samples, 500 ng of RNA was used for cDNA synthesis using the Quantitect reverse transcription kit (205–311, Qiagen). For cultured cells, 2 μg of RNA was used for cDNA synthesis using Transcriptase III (18080-044, Invitrogen).
Primer sets were designed using the NCBI Primer-Pick tool (for Sybr green assay) or selected and ordered from ABI TaqMan assays (Applied Biosciences). A complete list of primers is shown in Table I. The specificity of the primers was confirmed by sequencing the PCR product. For TaqMan assays, the primers with best coverage and probes that spanned exons were selected. Genomic contamination possibility of samples was ruled out using related RNA samples in the same RT-PCR run. RT-PCR was performed using 7 ng cDNA from human prostate cancer tissue or 50–100 ng cDNA from cultured cells in the presence of 1 μl of primer set (10 μM) and 10 μl of Taqman Universal PCR Mastermix (4304437 Applied Biosystems) or Sybr Select Mastermix (4472908, Applied Biosystems, Life Technologies) in the 7,300 real-time PCR system (Applied Biosystems). RNA18S was used as a housekeeping gene for normalization with the ddCT method. All steps (cell culture, RNA isolation, cDNA synthesis, and RT-PCR) were repeated three times.
TABLE I.
Real-Time PCR Primer Set Information
| Gene ID | Accession No | Sequence | Product length (bp) |
|---|---|---|---|
| Snail 1 | NM_005985.3 | Fw: 5′-ACCACTATGCCGCGCTCTT-3′ | 115 |
| Rev: 5′-GGTCGTAGGGCTGCTGGAA-3′ | |||
| Heat shock protein 27 | NM_001540.3 | Fw: 5′-GGAGATCACCGGCAAGCAC-3′ | 115 |
| Rev: 5′-GGAGGAGGAAACTTGGGTGG-3′ | |||
| Matrix metalloproteinase 2 | NM_004530.4 | Fw: 5′-GGCTGCCCTCCCTTGTTTC-3′ | 100 |
| Rev: 5′-AGGTCCTGGCAATCCCTTTG-3′ | |||
| Matrix metalloproteinase 9 | NM_004994.2 | Fw: 5′-TTTGAGTCCGGTGGACGATG-3′ | 197 |
| Rev: 5′-GCTCCTCAAAGACCGAGTCC-3′ | |||
| E-cadherin | NM_004360 | Fw: 5′-GCTGGACCGAGAGAGTTTCC-3′ | 179 |
| Rev: 5′-CGACGTTAGCCTCGTTCTCA-3′ | |||
| N-cadherin | NM_001792.3 | Fw: 5′-TTGGACCATCACTCGGCTTA-3′ | 161 |
| Rev: 5′-AGTCACACTGGCAAACCTTCA-3′ | |||
| Methalothionin | NM_005946.2 | Fw: 5′-TTCCACGTGCGCCTTATAGC-3′ | 133 |
| Rev: 5′-TCTTTGCATTTGCAGGAGCC-3′ | |||
| β-catenin | NM_001904.3 | HS00355049-m1 | 67 |
| NM_001098209 & 210 | |||
| Androgen receptor | NM_001011645.2 | HS00171172-m1 | 72 |
| NM_000044.3 | |||
| Vimentin | NM_003380.3 | Hs00185584-m1 | 73 |
| Protein kinase D1 (PKD1) | NM_002742.2 | Hs00177037-m1 | 82 |
| RNA18S5 | NR_003286.2 | Hs03928990-g1 | 61 |
The last five primers were ordered for Taqman assays and the rest for SyBr Green assays.
Immunofluorescence (IF)
Cells were cultured on cover slides, fixed in 4% paraformaldehyde for 20 min on ice, and permeabilized with 0.1% Triton-X100 for 3 min at room temperature. Non-specific adhesion sites were blocked in Protein Block solution (X0909, Dako) for 30 min at room temperature. Visualization of protein signals in cells was performed by incubation with primary antibodies for 1 hr and followed by 45 min incubation with related secondary antibodies and stained with DAPI for 5 min at room temperature (Table II). Mouse or goat isotype IgG was used as the negative control for the primary antibody. Slides were examined using a Zeiss Axio M1 microscope. The intensity of the fluorescence and exposure time was the same for all cell lines. Each experiment was performed in duplicate.
TABLE II.
Antibody Information
| Primary antibody (Catalogue No., company) | Dilution | Secondary antibody | Dilution |
|---|---|---|---|
| PKD1 antibody (sc-639, Santa Cruz) | 1:100 | Alexa fluor 594 (A11012, Invitrogen) | 1:333 |
| AR antibody (sc-7305, Santa Cruz) | 1:100 | Alexa fluor 488 (A11001, Invitrogen) | 1:333 |
| N-Cadherin antibody (sc-7939, Santa cruz) | 1:100 | Alexa fluor 594 (A11012, Invitrogen) | 1:333 |
| E-Cadherin antibody (sc-21791, Santa Cruz) | 1:100 | Alexa fluor 488 (A11001, Invitrogen) | 1:333 |
| Vimentin antibody (sc-6260, Santa Cruz) | 1:100 | Alexa fluor 488 (A11001, Invitrogen) | 1:333 |
| Methallothionein antibody (sc-11377, Santa Cruz) | 1: 100 | Alexa fluor 594 (A11012, Invitrogen) | 1:333 |
| S11-Snail | 1:1,000 | Alexa fluor 488 (A11001, Invitrogen) | 1:333 |
| antiT120 phosphorylated β-Catenin (pT120, rabbit polyclonal)* | 1:1,000 | Alexa fluor 594 (A11012, Invitrogen) | 1:333 |
| anti-Hsp27 (ab39399, Abcam) | 1:100 | Alexa fluor 594 (A11012, Invitrogen) | 1:333 |
| anti-MMP2 (ab37150, Abcam) | 1:100 | Alexa fluor 594 (A11080, Invitrogen) | 1:333 |
| MMP-9 antibody (sc-6840, Santa Cruz) | 1:100 | Alexa fluor 594 (A11012, Invitrogen) | 1:333 |
| B-catenin antibody (H102, sc-7199, Santa Cruz | 1:100 | Alexa fluor 594 (A11012, Invitrogen) | 1:333 |
pT120 β-Catenin antibody was generated by commercial contractor Millipore20. All antibodies were used in Western blots as well. For all antibodies, dilution ratio of 1/200 was used for Western blots, except β-catenin antibody, for which a 1/300 dilution was used.
Western Blot Analysis
Cell-compartment proteins were extracted using a subcellular protein fractionation kit (78840, Thermo Scientific), and whole protein lysate was extracted using Pierce RIPA buffer (89900, Thermo Scientific) according to protocols provided by the manufacturer. Equal concentration of protein were loaded on 10% SDS-PAGE gels and transferred onto a PVDF membrane (Millipore, Billerica, MA). Primary antibodies for PKD1, AR, vimentin, E-cadherin, and N-cadherin were obtained from Santa Cruz Biotechnologies; and pT120 beta-catenin (whole protein) was generated in our laboratory [24]. Total protein loading was assessed using beta-actin (A5441, Sigma–Aldrich). Bands were visualized using horse-radish peroxidase (HRP) conjugated secondary anti-mouse or anti-rabbit antibody (Cell Signaling Technology) in conjunction with chemiluminescence substrate (34094, Thermo Scientific) via LAS 3,000 imaging system (Fuji Photo Film). ImageJ software was used to analyze the density of electrophoretic Western blot bands. The values were normalized to beta-actin expression. The experiments were performed in triplicate.
Transfection
Transfection was performed using PKD1 plasmid DNA. The vector containing PKD1 was kindly provided by Dr. F.J. Johannes (Fraunhofer Institute for Interfacial Engineering, Stuttgart, Germany) [10,24]. For transfection, E006AA cells were seeded in 6-well plates (1×10[5] cells/well). When cells reached 50–60% confluence, they were transfected with either PKD1-harboring or empty vector (pEGFP) using FuGENE® HD Transfection Reagent (E2311, Promega) according to the manufacturer’s protocol. Briefly, cells were incubated at a 3:1 ratio of transfection reagent: DNA for 12–16 hr. Cells were allowed to recover in the appropriate culture medium for 24 hr and selected using G418 antibiotic (400 μg/ml) for 1 week.
Statistics
MTS assays were performed to compare cell proliferation rates among different cell lines using two-way analysis of variance (ANOVA) with Bonferroni post-test correction. Results of RT-PCR gene expression were compared using a two-way ANOVA (tumor tissues) and one-way ANOVA (cell lines) with Bonferroni multiple comparisons posttest. P-values <0.05 were considered to be significant. To assess the relationship between the cell lines and the human tissue data, absolute Spearman correlations were calculated. Due to differences in sample size and unpaired individual points in the cell line and human tissue data, a random sample was substituted for the human tissue data. This sample was then used to calculate the absolute Spearman correlation between the human tissue samples and cell line data. After repeating this process 500 times, we calculated the average absolute Spearman correlation between human tissue samples and cell lines.
RESULTS
We developed a rationale based MBP consisting of genes that have demonstrated influence on the development of a malignant phenotype in PCa [10,13,15,17,18]. The MBP members included PKD1, N-cadherin, Snail, vimentin, MMP-2, MMP-9, Metallothionein (MT1), E-cadherin, beta-catenin, AR, and heat shock protein 27 (HSP27). We have characterized the MBP in two available cell lines of African–American origin (E006AA and MDAPCa2b) and compared them to well-studied androgen-dependent LNCaP cells (Caucasian background) and itscastration-resistant derivative, C4-2 cells.
Our previous work demonstrated that PKD1 is down-regulated in advanced PCa; therefore, we consider loss of PKD1 to be a marker of the aggressive phenotype [12,25]. First, we evaluated the transcriptional and protein expression of PKD1 in the cell lines. PKD1 mRNA expression was significantly lower in E006AA and MDAPCa2b cells compared to LNCaP cells (P < 0.0001) and similar to C4-2 cells (Fig. 1A); however, the protein expression of PKD1 in MDAPCa2b was elevated similar to LNCaP cells (Fig. 1C).
Fig. 1.
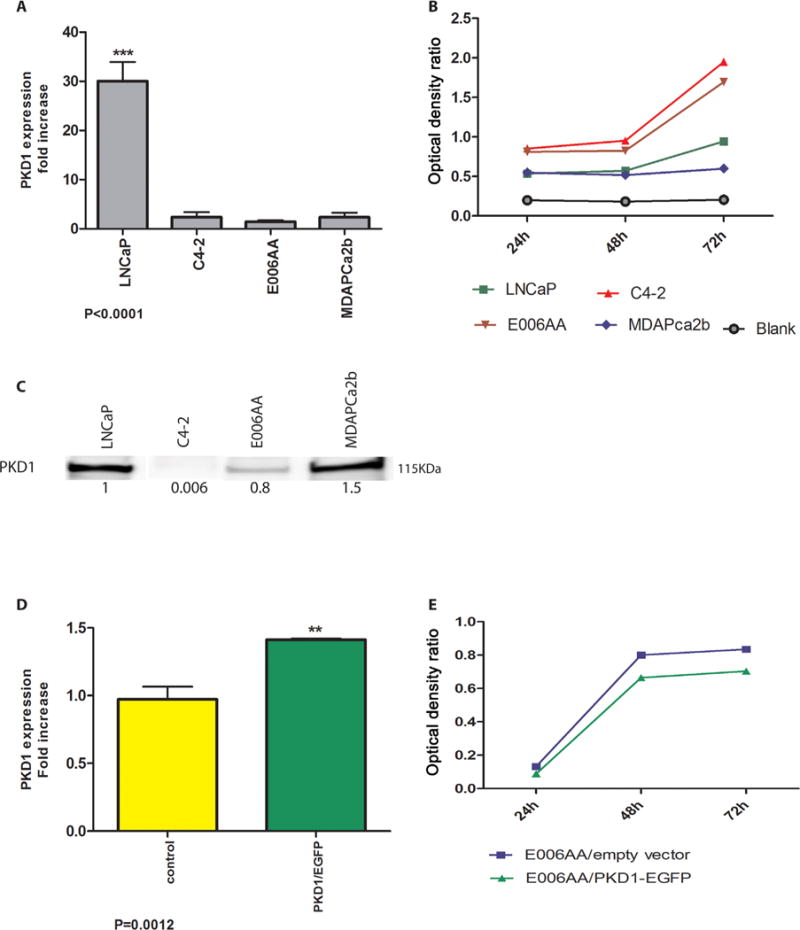
(A) PKD1 expression in African–American and Caucasian prostate cancer cell lines using real time PCR. RNA18S was used as a housekeeping gene for normalization. (B) Proliferation assay: Proliferation rate in the cell lines was evaluated by MTS assay. Over 72 hr, C4-2 and E006AA cells had significantly higher proliferation rates than LNCaP and MDAPCa2b cells. Proliferation rates of LNCaP cells were also significantly higher than in MDAPCa2b cells (P < 0.05). (C) PKD1 protein expression in cytoplasmic fraction of all four cell lines. The expression level was normalized against beta-actin. (D) PKD1 expression in transfected E006AA cells measured by real time PCR. E006AA cells were transfected by either PKD1-harboring EGFP (E006AA/PKD) or empty EGFP (E006AA/empty vector) plasmids. In real time PCR, expression RNA18S was used for normalization. (E) MTS assay in PKD1 transfected E006AA cells. E006AA/empty vector was used as control. E006AA/PKD1 (green line) was compared to E006AA/empty vector (blue line) over 72 hr. E006AA/empty vector and E006AA/PKD1 results were significantly different (P < 0.0001).
As PKD1 has an inhibitory effect on cell proliferation [14], we compared the proliferation rate of these cell lines with LNCaP cells, which highly express PKD1, and C4-2 cells, which express comparatively low levels of PKD1. The proliferation rate in E006AA cells was comparable to the aggressive C4-2 cells, and it was significantly higher than LNCaP cells (P < 0.0001). The proliferation rate of MDAPCa2b cells was not significantly different from LNCaP cells (Fig. 1B) and could be related to a higher level of PKD1 protein in these cells. To examine whether the higher proliferation rate of E006AA was related to a lower expression of PKD1, E006AA cells were transfected with PKD1 (Fig. 1D). Overexpression of PKD1 in E006AA caused a significant decrease in proliferation rate when compared to control (P < 0.001) (Fig. 1E).
We further categorized the MBP under three distinct and functional groups: (i) Mesenchymal markers (EMT), Metallothionein (MT), and matrix metalloproteinase markers (MMPs); (ii) Epithelial markers; and (iii) androgen-receptor signaling markers. We compared the transcriptional and protein expression of biomarkers for each of the African–American and Caucasian cell lines.
Mesenchymal, MMP, and MT Markers
This group consists of markers generally associated with aggressive phenotypes in cancers and includes three epithelial mesenchymal transition (EMT) markers (N-cadherin, Snail, and vimentin), two MMP markers (MMP-2 and MMP-9), and Metallothionein (MT), a free radical scavenging metal responsive small protein. The gene expression of N-cadherin, Snail, and vimentin was significantly higher in E006AA cells than other cell lines (P < 0.0001) (Fig. 2), which is considered characteristic of an aggressive phenotype. We further corroborated that the protein expression of these three EMT markers was higher in the E006AA cell line compared to the LNCaP cell line; moreover, this was consistent with the aggressive metastatic C4-2 cells (Figs. 3A and 4). PKD1 is known to phosphorylate Snail, a major transcriptional repressor of E-cadherin at Serine 11 (S11), and decrease the inhibitory effect of snail on E-cadherin expression. The loss of PKD1 decreases S11 phosphorylation [18]. E006AA showed lower level of PKD1 and phosphorylated S11 snail by IF staining (Fig. 3A). The transcriptional and protein expression of the EMT markers in MDAPCa2b was not significantly different from LNCaP cells. The same pattern was observed for MMP markers (Figs. 2 and 3). The protein expression of MT in both African–American cell lines (E006AA and MDAPCa2b) was higher compared to LNCaP. Interestingly, both African–American cell lines showed dominant cytoplasmic expression of MT whereas MT expression in LNCaP and C4-2 cells was mostly nuclear (Fig. 3B).
Fig. 2.
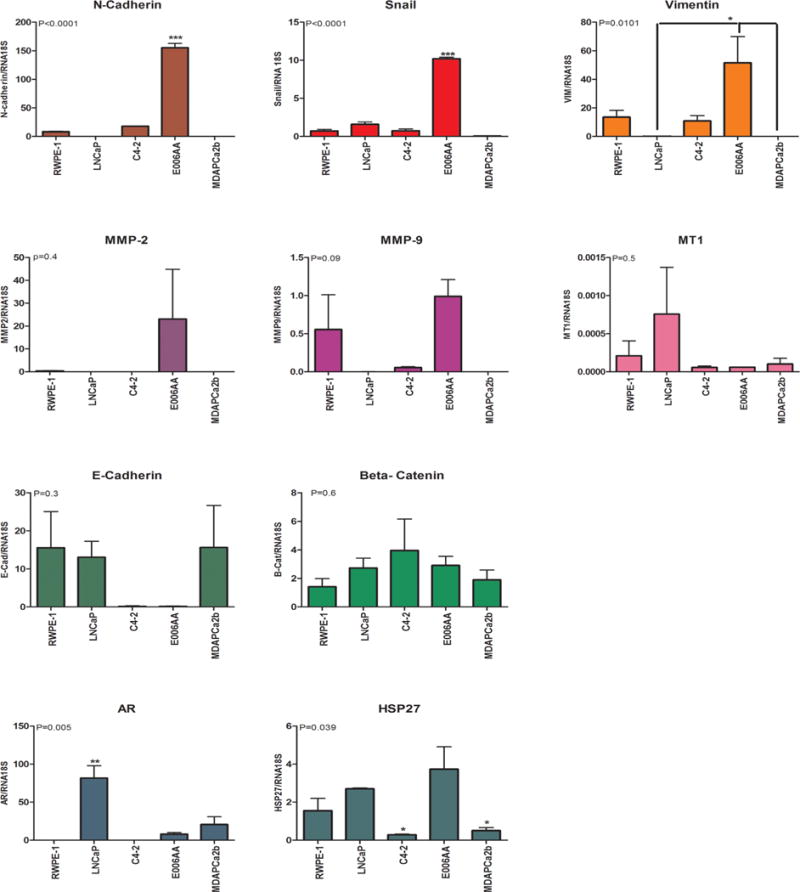
Quantification of gene expression by real-time PCR. Expression of Multiplex Biomarker Panel (MBP) in African–American and Caucasian prostate cancer cell lines. RNA18S was used as a housekeeping gene for normalization. Not detected expression was considered as Ct = 40 (the maximum amplification cycles). Y axis shows fold increase in gene expression. P ≤ 0.05 is considered as significant and indicated by an asterisk (*). P-value for each biomarker mentioned on the top left of each graph. Note that the expression levels of heat shock protein 27 in C4-2 cells and MDAPCa2b cells were significantly lower than in other cell lines.
Fig. 3.
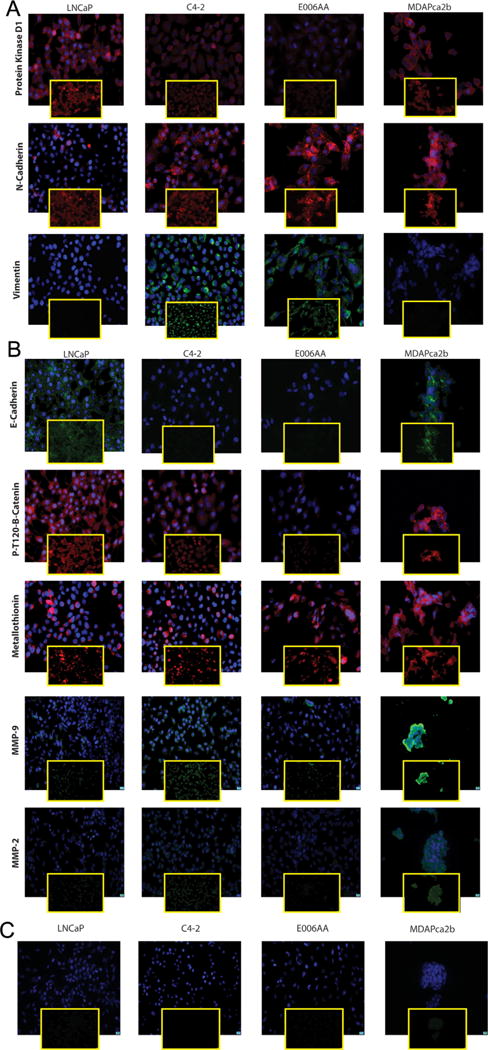
(A–C) Quantification of MBP by immunostaining. E006AA cells displayed a protein expression pattern similar to that in C4-2 cells. Small Square Panel: specific staining of the target protein. Large square panel: merged image. The scale bar is 10 μm. (C) IgG control in different cell lines.
Fig. 4.
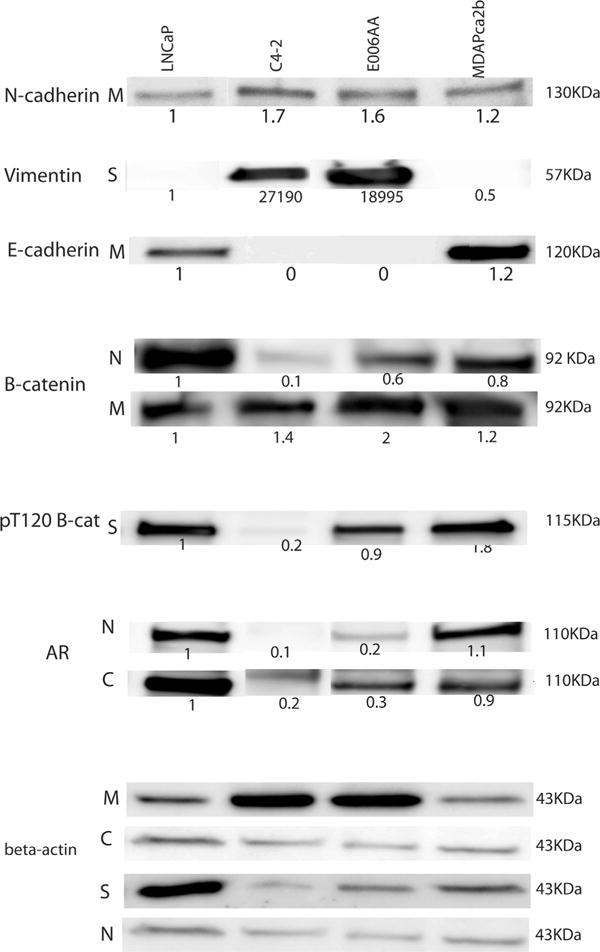
Subcellular localization of PKD1-related biomarker panel. Western blot immunoblot. Each subcellular fraction was run in a separate membrane and gel. Densitometry of electrophoretic Western blot bands for subcellular fractions was calculated using Image J software. The expression level of each target protein was compared among cell lines in each specific subcellular compartment. The mentioned value under each band show “peak percentage” that are obtained by dividing the area of each peak by the sum of all measured peaks from all lanes and normalized based on beta-actin expression. N: nucleus. C: cytoplasm. M: cell membrane. S: cytoskeleton.
Epithelial Markers
E-cadherin is a classic epithelial cell marker and functions in complex with beta-catenin. We have previously demonstrated that decreased E-cadherin expression is associated with an aggressive malignant phenotype in PCa [9,25]. We have also shown that PKD1 phosphorylates beta-catenin, specifically at threonine 120 residue (T120) and influences subcellular localization of beta-catenin [24]. In the current study, E006AA and C4-2 cells showed very low expression of E-cadherin, whereas the expression was higher in the MDAPCa2b and LNCaP cell lines (Figs. 3B and 4).
Because phosphorylation of beta-catenin at the threonine 120 position (T120) by PKD1 influences subcellular localization of PKD1 [24], we investigated the expression of phosphorylated beta-catenin-T120 in the four cell lines using the T120-phosphospecific antibody generated in our laboratory. Immunofluorescence (IF) was visualized for non-nuclear (cytoplasmic or cell adherens junction) expression of beta-catenin in E006AA, MDAPCa2b, and C4-2 cells with nuclear localization of beta-catenin seen in LNCaP cells. Because phosphorylation of beta-catenin at T120 can be detected in the trans-Golgi network, we further validated the IF results by Western blot using lysates from different subcellular compartments. Compared to LNCaP cells, E006AA cells had lower expression of phosphorylated beta-catenin at T120 in the cytoskeletal fraction, which includes the trans-Golgi network. These results are consistent with decreased PKD1 expression in E006AA cells (Fig. 4).
AR Signaling
AR and its chaperone proteins including Heat Shock Protein (HSP) 27 play a major role in PCa [26]. Moreover, distinct AR mutations and single nucleotide polymorphisms (SNPs) are described in African–American men with PCa. The expression of AR in E006AA and MDAPCa2b cells was significantly lower than in LNCaP cells (P < 0.01) (Fig. 2). IF studies revealed AR expression primarily in the nucleus of LNCaP and MDAPCa2b cells, whereas C4-2 and E006AA cells showed cytoplasmic expression of AR. We further validated the IF results by Western blot. Nuclear expression of AR was higher in LNCaP and MDAPCa2b cells and lower in E006AA cells; AR expression was not detectable by Western blot in C4-2 cells (Fig. 4).
Finally, we evaluated the cell line model for functional studies. As a proof-of-principle study, we altered expression of PKD1 in the cell lines. To evaluate the importance of decreased PKD1 expression in the E006AA cell line, we transfected E006AA cells with PKD1/pEGFP or pEGFP empty vector (as control). The efficiency of transfection was ~70%. Using G418 for 1 week, we selected for the pure transfected population. Overexpression of PKD1 in E006AA cells significantly decreased expression levels of Snail, N-cadherin, vimentin, and MMP-2 (P < 0.0001) and significantly increased expression level of E-cadherin (P < 0.0001) (Fig. 5A). Similar results were observed in C4-2 cells with PKD1 overexpression (data not shown).
Fig. 5.
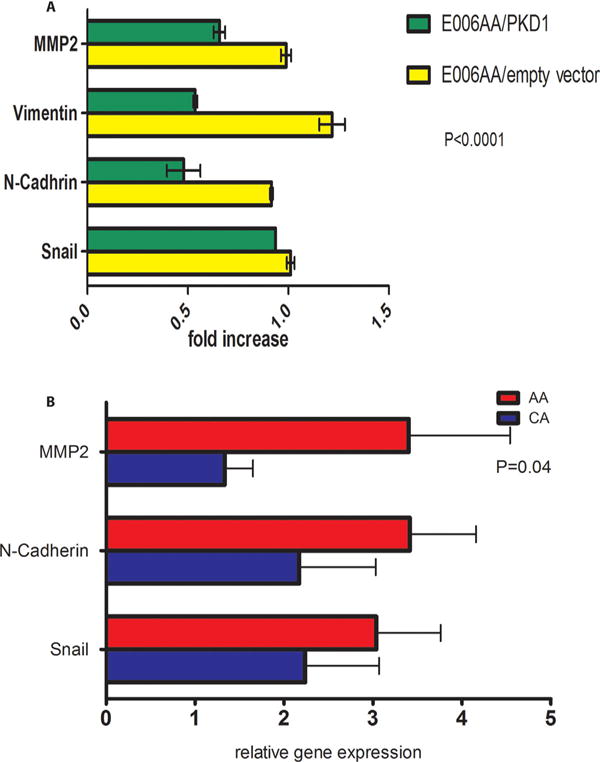
(A) Racial disparity in expression of EMT markers in human prostate cancer tissues. 15 African–American men with prostate cancer were compared to 15 Caucasian men with prostate cancer. Based on two-way ANOVA, race accounts for 4.83% of the total variance (F = 4.31, DFn = 1, DFd = 84, P-value = 0.0409). (B) The effect of PKD1 overexpression on E006AA cells Quantification of gene expression by real time PCR on transfected E006AA cell line. E006AA/PKD (E006AA cells stably transfected with PKD1 vector) was compared to E006AA/empty vector (E006AA cells stably transfected with empty vector).
To evaluate MBP in human PCa tissue, we compared the differential gene expression levels of the MBP members in human prostate cancer tissue from African–American and Caucasian men. We used 15 PCa tissue samples from African–Americans and compared them to an equal number of PCa tissue samples from Caucasians that were matched for Gleason score. The expression levels of N-cadherin, Snail, and MMP-2 in African–American PCa tissues were significantly higher compared to PCa tissues from Caucasians (Fig. 5B). No significant difference in expression was observed for PKD1, E-cadherin, beta-catenin, AR, vimentin, MMP-9, or MT in prostate cancer samples between the two races (data not shown). The correlation between tissue samples and cell line data ranged from 0.33 to 0.89, and the highest correlations observed noted for PKD1, N-Cadherin, and beta-Catenin expressions.
DISCUSSION
The results from our study suggest MBP is differentially expressed in two African–American cell lines compared to Caucasians. Our earlier studies demonstrated that PKD1 is characteristically down-regulated in advanced prostate cancer; furthermore, prostate-specific PKD1 knock-out in mice does not alter the normal prostate phenotype [27]. Therefore, we consider loss of PKD1 in the prostate to be a late event in PCa and a marker of an aggressive disease. The down-regulation of PKD1 in primary African–American E006AA cells suggests that these cells could be inherently aggressive. Alternatively, because the experiments are done in a cell line, the general limitations of cell line models such as clonal selection, artifactual changes due to in vitro passaging are among other possibilities that need to be addressed prior to definitively concluding the inherently aggressive nature of the African–American cell line. Therefore, it may not be appropriate to generalize the results found in cell line model to in vivo PCa tissue because cell lines are maintained for several generations in artificial condition and accumulated changes in their phenotype (including gene and protein expression) cannot be generalized to in vivo condition. However, the MBP could be a valuable tool in evaluating the biological basis for racial disparity among men with PCa.
Loss of PKD1 induces epithelial-to-mesenchymal transition (EMT), which is a key phenotype in neoplastic progression. During EMT, epithelial cells acquire mesenchymal cell properties, including morphologic changes, loss of epithelial markers, expression of mesenchymal markers and, most importantly, the ability to migrate and invade [21]. During EMT, E-cadherin is down-regulated and N-cadherin is up-regulated. This phenomenon is known as cadherin switching and is associated with increased motility [28]. We have previously demonstrated cadherin switching in high-grade human PCa [11]. In the present study, the E006AA cells (derived from a primary prostate tumor in an African–American male) showed cadherin switching, which is characteristic of high-grade prostate cancer in humans and commonly found in metastatic PCa cell lines. Furthermore, the expression level of vimentin, another important mesenchymal marker and essential regulator of mesenchymal cell migration is also up-regulated in E006AA cells [29]. The increased expression of mesenchymal markers and loss of epithelial markers in E006AA, suggest the aggressive nature of E006AA cell line.
PKD1 also regulates EMT through phosphorylation of Snail, a major transcriptional repressor of E-cadherin, at the serine 11 (S11) [18]. Microarray and immunohistochemistry studies have shown a direct correlation between increased Snail expression and high Gleason scores in prostate cancer [30]. In addition, Snail expression is higher in aggressive metastatic Caucasian cell lines compared to non-aggressive LNCaP cells [30]. In the current study, Snail expression in E006AA cells was significantly higher than other cell lines. Furthermore, expression of S11-phosphorylated Snail was lower in the E006AA PCa cell line and higher in MDAPCa2b cell line to LNCaP cells. Currently, PKD1 is the only known kinase to phosphorylate Snail at S11. We have previously shown that S11 phosphorylation increases the nuclear export of Snail, and thereby inhibits repression of E-cadherin and induces a benign epithelial phenotype [18]. As a corollary, loss of S11 phosphorylation could induce E-cadherin repression and contribute to an aggressive malignant phenotype. The cell line model developed in this study provides an invaluable opportunity to dissect the molecular mechanisms of aggressive PCa.
MMPs are involved in the degradation of the extracellular matrix and play an important role in tumor invasion and metastasis by breaking down connective tissue barriers [31]. MMP-2 and MMP-9 are overexpressed and are of significant prognostic and predictive markers of high-risk prostate cancer [32]. In the current study, the expression of MMP-2 and MMP-9 in E006AA cells was higher compared to other study cell lines (LNCaP, C4-2, and MDAPCa2b) [10]. While MMPs are generally considered markers of an aggressive phenotype in a variety of human cancers, our laboratory has demonstrated a novel anti-proliferative role for MMP-2 and MMP-9 in human PCa that is regulated by PKD1. Therefore, the dysregulation of MMP-2 and MMP-9 in the cell line model characterized in this study allows for a valid assessment of the complex and divergent roles of MMP-2 and MMP-9 in cancer development and progression. In addition, the model provides another opportunity to discriminate the often variable and opposing roles played by same genes in PCa.
Metallothionein (MT), a metal scavenger biomarker, plays an important role in metal detoxification and homeostasis; furthermore, MT is expressed in advanced prostate cancer and positively correlates with increasing Gleason score [33]. In the current study, the transcriptional level of MT was not different among study cell lines; however, the protein expression of MT in E006AA and MDAPCa2b was higher than LNCaP and might suggest a more aggressive phenotype for these two African–American cell lines compared to LNCaP. In addition, subcellular localization of MT in both African–American cell lines was localized primarily in the cytoplasm while MT expression was localized primarily in the nucleus for both LNCaP and its derivative C4-2 cells. MT subcellular distribution is specific for cell type; moreover, MT is functionally important for cellular protection against anticancer agents in human prostatic cancer cells [34]. The current cell line model might be useful to determine the mechanisms that control subcellular localization and function of MT marker.
We have previously shown that down-regulation of PKD1 and/or E-cadherin significantly increased cell proliferation, and this effect was currently mediated by beta-catenin [14]. PKD1 is the only known kinase to phosphorylate beta-catenin at T120 residue. The T120 phosphorylation causes accumulation of beta-catenin in the trans-Golgi network and decreases nuclear beta-catenin involvement in Wnt signaling [24]. The role of beta-catenin in PCa is only beginning to be understood; however, it has been well established that the mutation of adenopolyposis protein (APC), which prevents the degradation of cytoplasmic beta-catenin [35], promotes nuclear translocation of beta-catenin and cell proliferation in colon cancer [36]. The study cell line model could be used to improve our understanding of the role of beta-catenin in prostate cancer. Our previous study has shown that subcellular localization of beta-catenin by IF can serve as a biomarker to predict the clinical course of PCa [15].
PKD1 is known to influence AR expression through phosphorylation and nuclear translocation of heat shock protein 27 [16]. Subcellular localization of AR is an indicator for AR activity; furthermore, AR localization in cytoplasm suggests that in the E006AA prostate cancer cell line, like the aggressive metastatic C4-2 cell line, AR is largely inactive [37] which could be explained with the loss-of-function mutation in AR in E006AA cells [38]. As prostate cancer progresses to a castration-resistant phenotype in humans, the cancer cells are able to survive despite low levels of androgen in the serum and tissue [39]. Therefore, the African–American-derived E006AA and C4-2 cells may have an innate ability to remain aggressive in the presence or absence of androgens. Previously E006AA cells have been shown to exhibit castrate-resistant growth characteristics although they were derived from a hormonally naïve patient [38]. In contrast, MDAPCa2b cells that were derived from a castrated patient expressed AR and remained sensitive to androgen. Elevated levels of PKD1 protein in these cells might be responsible for nuclear translocation of AR. The cell line model provides a robust system to study the progression to castration resistance in PCa.
Low expression of mesenchymal markers (N-cadherin, vimentin, and Snail) and high expression of E-cadherin in the African–American-derived MDAPCa2b cell line (derived from bone metastasis) was similar to the expression level of these biomarkers in the non-aggressive LNCaP cells, which exemplifies mesenchymal-to-epithelial transition (MET) in seeded tumor cells of bone metastasis [40,41]. Although the transcriptional expression of PKD1 in MDAPCa2b cells was lower than LNCaP, the subcellular protein analysis showed high expression of PKD1. The observed benign phenotype in MDAPCa2b cells can be explained by high PKD1 expression in protein level. The discrepancy in PKD1 expression between RNA and protein level in MDAPCa2b might be the result of the dysregulation of PKD1 degradation mechanisms in these cells and merits further investigation.
In this study, we established the feasibility of studying MBP in human PCa tissue. We demonstrated a correlation (in gene expression) ranging from 0.33 to 0.89, and the highest observed correlations between human and cell line data were noted for PKD1, N-cadherin, and beta-catenin expressions. A significant differential expression of genes between African–American and Caucasian men with PCa was observed for N-cadherin, Snail, and MMP-2. The lack of a significant difference in the remaining members of MBP (PKD1, beta-catenin, E-cadherin, vimentin, MMP-9, and MT) may be related to the small sample size and inadequate power. The goal of this experiment was to establish the feasibility of studying MBP in human tissue. Further large-scale biomarker development and validation studies are required to establish the utility of MBP in clinical practice.
Due to the limited availability of prostate cancer cell lines derived from African–American men, we studied the two available cell lines. The process of generating a stable cell line from the African–American patient with prostate cancer in E006AA may have selected for aggressive clones and may not be representative of the entire disease. Nevertheless, our results suggest that at least one clone was inherently aggressive in the original African–American patient from which the E006AA cell line was derived. Previous clonal studies evaluating sources of metastasis in prostate cancer patients have indicated that metastases often have an identifiable clonal origin and arise from small, indolent-appearing areas of Gleason score 3 disease [42].
In summary, we have assembled and characterized a unique and novel cell line model that can be used perform a variety of molecular studies focused on PKD1-centered signaling, EMT, dual role of MMPs in PCa, AR transport, cell scavengers such as MTs, and specific phosphorylation events of Snail and beta-catenin. Moreover, the cell line model could be used for related cell biology experiments including proliferation, migration, and invasion assays. As the molecular aspects of the model are characterized, the model could be used for in vivo xenograft animal experiments including orthotopic and heterotopic models. As future biomarker development and validation studies establish the utility of the MBP in clinical practice, “back from bed to bench” functional studies could be performed using the cell line model to address potential complications or concerns. In particular, the model provides a unique resource to specifically address research questions focused on African–American men with PCa.
Supplementary Material
Acknowledgments
The authors would like to thank Dr. Shahriar Koochekpour (Roswell Park Institute, University at Buffalo, State University of New York) for providing E006AA cells and Dr. Heather Hatcher for editorial review.
Grant sponsor: Wake Forest Institute for Regenerative medicine; Grant sponsor: VA-ORD; Grant number: 5 I01 BX001536-03; Grant sponsor: NIH; Grant number: CA079448.
Footnotes
SUPPORTING INFORMATION
Additional supporting information may be found in the online version of this article at the publisher’s web-site.
Conflicts of interest: Authors do not have any conflict of interest.
References
- 1.Bock CH, Powell I, Kittles RA, Hsing AW, Carpten J. Racial disparities in prostate cancer incidence, biochemical recurrence, and mortality. Prostate Cancer. 2011;2011:716178. doi: 10.1155/2011/716178. [DOI] [PMC free article] [PubMed] [Google Scholar]
- 2.Chornokur G, Dalton K, Borysova ME, Kumar NB. Disparities at presentation, diagnosis, treatment, and survival in African American men, affected by prostate cancer. Prostate. 2010;71(9):985–997. doi: 10.1002/pros.21314. [DOI] [PMC free article] [PubMed] [Google Scholar]
- 3.Moore AD, Hamilton JB, Knafl GJ, Godley PA, Carpenter WR, Bensen JT, Mohler JL, Mishel M. The influence of mistrust, racism, religious participation, and access to care on patient satisfaction for African American men: The North Carolina-Louisiana prostate cancer project. J Natl Med Assoc. 2013;105(1):59–68. doi: 10.1016/s0027-9684(15)30086-9. [DOI] [PubMed] [Google Scholar]
- 4.Bock CH, Schwartz AG, Ruterbusch JJ, Levin AM, Neslund-Dudas C, Land SJ, Wenzlaff AS, Reich D, McKeigue P, Chen W, Heath EI, Powell IJ, Kittles RA, Rybicki BA. Results from a prostate cancer admixture mapping study in African–American men. Hum Genet. 2009;126(5):637–642. doi: 10.1007/s00439-009-0712-z. [DOI] [PMC free article] [PubMed] [Google Scholar]
- 5.Kinseth MA, Jia Z, Rahmatpanah F, Sawyers A, Sutton M, Wang-Rodriguez J, Mercola D, McGuire KL. Expression differences between African American and Caucasian prostate cancer tissue reveals that stroma is the site of aggressive changes. Int J Cancer. 2013;134(1):81–91. doi: 10.1002/ijc.28326. [DOI] [PMC free article] [PubMed] [Google Scholar]
- 6.Kwabi-Addo B, Wang S, Chung W, Jelinek J, Patierno SR, Wang BD, Andrawis R, Lee NH, Apprey V, Issa JP, Ittmann M. Identification of differentially methylated genes in normal prostate tissues from African American and Caucasian men. Clin Cancer Res. 2010;16(14):3539–3547. doi: 10.1158/1078-0432.CCR-09-3342. [DOI] [PubMed] [Google Scholar]
- 7.Wallace TA, Prueitt RL, Yi M, Howe TM, Gillespie JW, Yfantis HG, Stephens RM, Caporaso NE, Loffredo CA, Ambs S. Tumor immunobiological differences in prostate cancer between African-American and European-American men. Cancer Res. 2008;68(3):927–936. doi: 10.1158/0008-5472.CAN-07-2608. [DOI] [PubMed] [Google Scholar]
- 8.Timofeeva OA, Zhang X, Ressom HW, Varghese RS, Kallakury BV, Wang K, Ji Y, Cheema A, Jung M, Brown ML, Rhim JS, Dritschilo A. Enhanced expression of SOS1 is detected in prostate cancer epithelial cells from African-American men. Int J Oncol. 2009;35(4):751–760. [PMC free article] [PubMed] [Google Scholar]
- 9.Balaji KC, Rao PS, Smith DJ, Louis S, Smith LM, Sherman S, Bacich D, O’Keefe D. Microarray analysis of differential gene expression in androgen independent prostate cancer using a metastatic human prostate cancer cell line model. Urol Oncol. 2004;22(4):313–320. doi: 10.1016/S1078-1439(03)00238-2. [DOI] [PubMed] [Google Scholar]
- 10.Jaggi M, Rao PS, Smith DJ, Wheelock MJ, Johnson KR, Hemstreet GP, Balaji KC. E-cadherin phosphorylation by protein kinase D1/protein kinase C{mu} is associated with altered cellular aggregation and motility in prostate cancer. Cancer Res. 2005;65(2):483–492. [PubMed] [Google Scholar]
- 11.Jaggi M, Nazemi T, Abrahams NA, Baker JJ, Galich A, Smith LM, Balaji KC. N-cadherin switching occurs in high Gleason grade prostate cancer. Prostate. 2006;66(2):193–199. doi: 10.1002/pros.20334. [DOI] [PubMed] [Google Scholar]
- 12.Jaggi M, Du C, Zhang W, Balaji KC. Protein kinase D1: A protein of emerging translational interest. Front Biosci. 2007;12:3757–3767. doi: 10.2741/2349. [DOI] [PubMed] [Google Scholar]
- 13.Mak P, Jaggi M, Syed V, Chauhan SC, Hassan S, Biswas H, Balaji KC. Protein kinase D1 (PKD1) influences androgen receptor (AR) function in prostate cancer cells. Biochem Biophys Res Commun. 2008;373(4):618–623. doi: 10.1016/j.bbrc.2008.06.097. [DOI] [PMC free article] [PubMed] [Google Scholar]
- 14.Syed V, Mak P, Du C, Balaji KC. Beta-catenin mediates alteration in cell proliferation, motility and invasion of prostate cancer cells by differential expression of E-cadherin and protein kinase D1. J Cell Biochem. 2008;104(1):82–95. doi: 10.1002/jcb.21603. [DOI] [PMC free article] [PubMed] [Google Scholar]
- 15.Du C, Jaggi M, Zhang C, Balaji KC. Protein kinase D1-mediated phosphorylation and subcellular localization of beta-catenin. Cancer Res. 2009;69(3):1117–1124. doi: 10.1158/0008-5472.CAN-07-6270. [DOI] [PubMed] [Google Scholar]
- 16.Hassan S, Biswas MH, Zhang C, Du C, Balaji KC. Heat shock protein 27 mediates repression of androgen receptor function by protein kinase D1 in prostate cancer cells. Oncogene. 2009;28(49):4386–4396. doi: 10.1038/onc.2009.291. [DOI] [PubMed] [Google Scholar]
- 17.Biswas MH, Du C, Zhang C, Straubhaar J, Languino LR, Balaji KC. Protein kinase D1 inhibits cell proliferation through matrix metalloproteinase-2 and matrix metalloproteinase-9 secretion in prostate cancer. Cancer Res. 2010;70(5):2095–2104. doi: 10.1158/0008-5472.CAN-09-4155. [DOI] [PMC free article] [PubMed] [Google Scholar]
- 18.Du C, Zhang C, Hassan S, Biswas MH, Balaji KC. Protein kinase D1 suppresses epithelial-to-mesenchymal transition through phosphorylation of snail. Cancer Res. 2010;70(20):7810–7819. doi: 10.1158/0008-5472.CAN-09-4481. [DOI] [PubMed] [Google Scholar]
- 19.Zhau HE, Odero-Marah V, Lue HW, Nomura T, Wang R, Chu G, Liu ZR, Zhou BP, Huang WC, Chung LW. Epithelial to mesenchymal transition (EMT) in human prostate cancer: lessons learned from ARCaP model. Clin Exp Metastasis. 2008;25(6):601–610. doi: 10.1007/s10585-008-9183-1. [DOI] [PMC free article] [PubMed] [Google Scholar]
- 20.Hanahan D, Weinberg RA. Hallmarks of cancer: The next generation. Cell. 2011;144(5):646–674. doi: 10.1016/j.cell.2011.02.013. [DOI] [PubMed] [Google Scholar]
- 21.Hugo H, Ackland ML, Blick T, Lawrence MG, Clements JA, Williams ED, Thompson EW. Epithelial-mesenchymal and mesenchymal-epithelial transitions in carcinoma progression. J Cell Physiol. 2007;213(2):374–383. doi: 10.1002/jcp.21223. [DOI] [PubMed] [Google Scholar]
- 22.Egan A, Dong Y, Zhang H, Qi Y, Balk SP, Sartor O. Castration-resistant prostate cancer: Adaptive responses in the androgen axis. Cancer Treat Rev. 2014;40(3):426–433. doi: 10.1016/j.ctrv.2013.09.011. [DOI] [PubMed] [Google Scholar]
- 23.Koochekpour S, Maresh GA, Katner A, Parker-Johnson K, Lee TJ, Hebert FE, Kao YS, Skinner J, Rayford W. Establishment and characterization of a primary androgen-responsive African–American prostate cancer cell line, E006AA. Prostate. 2004;60(2):141–152. doi: 10.1002/pros.20053. [DOI] [PubMed] [Google Scholar]
- 24.Du C, Zhang C, Li Z, Biswas MH, Balaji KC. Beta-catenin phosphorylated at threonine 120 antagonizes generation of active beta-catenin by spatial localization in trans-Golgi network. PLoS ONE. 2012;7(4):e33830. doi: 10.1371/journal.pone.0033830. [DOI] [PMC free article] [PubMed] [Google Scholar]
- 25.Jaggi M, Rao PS, Smith DJ, Hemstreet GP, Balaji KC. Protein kinase C mu is down-regulated in androgen-independent prostate cancer. Biochem Biophys Res Commun. 2003;307(2):254–260. doi: 10.1016/s0006-291x(03)01161-6. [DOI] [PubMed] [Google Scholar]
- 26.Zoubeidi A, Zardan A, Beraldi E, Fazli L, Sowery R, Rennie P, Nelson C, Gleave M. Cooperative interactions between androgen receptor (AR) and heat-shock protein 27 facilitate AR transcriptional activity. Cancer Res. 2007;67(21):10455–10465. doi: 10.1158/0008-5472.CAN-07-2057. [DOI] [PubMed] [Google Scholar]
- 27.Fang X, Gyabaah K, Nickkholgh B, Cline JM, Balaji KC. Novel in vivo model for combinatorial fluorescence labeling in mouse prostate. Prostate. 2015;75(9):988–1000. doi: 10.1002/pros.22984. [DOI] [PMC free article] [PubMed] [Google Scholar]
- 28.Tomita K, van Bokhoven A, van Leenders GJ, Ruijter ET, Jansen CF, Bussemakers MJ, Schalken JA. Cadherin switching in human prostate cancer progression. Cancer Res. 2000;60(13):3650–3654. [PubMed] [Google Scholar]
- 29.Vuoriluoto K, Haugen H, Kiviluoto S, Mpindi JP, Nevo J, Gjerdrum C, Tiron C, Lorens JB, Ivaska J. Vimentin regulates EMT induction by Slug and oncogenic H-Ras and migration by governing Axl expression in breast cancer. Oncogene. 2011;30(12):1436–1448. doi: 10.1038/onc.2010.509. [DOI] [PubMed] [Google Scholar]
- 30.Whiteland H, Spencer-Harty S, Thomas DH, Davies C, Morgan C, Kynaston H, Bose P, Fenn N, Lewis PD, Bodger O, Jenkins S, Doak SH. Putative prognostic epithelial-to-mesenchymal transition biomarkers for aggressive prostate cancer. Exp Mol Pathol. 2013;95(2):220–226. doi: 10.1016/j.yexmp.2013.07.010. [DOI] [PubMed] [Google Scholar]
- 31.Kessenbrock K, Plaks V, Werb Z. Matrix metalloproteinases: Regulators of the tumor microenvironment. Cell. 2010;141(1):52–67. doi: 10.1016/j.cell.2010.03.015. [DOI] [PMC free article] [PubMed] [Google Scholar]
- 32.Gong Y, Chippada-Venkata UD, Oh WK. Roles of matrix metalloproteinases and their natural inhibitors in prostate cancer progression. Cancers (Basel) 2014;6(3):1298–1327. doi: 10.3390/cancers6031298. [DOI] [PMC free article] [PubMed] [Google Scholar]
- 33.Moussa M, Kloth D, Peers G, Cherian MG, Frei JV, Chin JL. Metallothionein expression in prostatic carcinoma: Correlation with Gleason grade, pathologic stage, DNA content and serum level of prostate-specific antigen. Clin Invest Med. 1997;20(6):371–380. [PubMed] [Google Scholar]
- 34.Kondo Y, Kuo SM, Watkins SC, Lazo JS. Metallothionein localization and cisplatin resistance in human hormone-independent prostatic tumor cell lines. Cancer Res. 1995;55(3):474–477. [PubMed] [Google Scholar]
- 35.Faux MC, Coates JL, Catimel B, Cody S, Clayton AH, Layton MJ, Burgess AW. Recruitment of adenomatous polyposis coli and beta-catenin to axin-puncta. Oncogene. 2008;27(44):5808–5820. doi: 10.1038/onc.2008.205. [DOI] [PubMed] [Google Scholar]
- 36.Phelps RA, Broadbent TJ, Stafforini DM, Jones DA. New perspectives on APC control of cell fate and proliferation in colorectal cancer. Cell Cycle. 2009;8(16):2549–2556. doi: 10.4161/cc.8.16.9278. [DOI] [PubMed] [Google Scholar]
- 37.Georget V, Lobaccaro JM, Terouanne B, Mangeat P, Nicolas JC, Sultan C. Trafficking of the androgen receptor in living cells with fused green fluorescent protein-androgen receptor. Mol Cell Endocrinol. 1997;129(1):17–26. doi: 10.1016/s0303-7207(97)04034-3. [DOI] [PubMed] [Google Scholar]
- 38.D’Antonio JM, Vander Griend DJ, Antony L, Ndikuyeze G, Dalrymple SL, Koochekpour S, Isaacs JT. Loss of androgen receptor-dependent growth suppression by prostate cancer cells can occur independently from acquiring oncogenic addiction to androgen receptor signaling. PLoS ONE. 2010;5(7):e11475. doi: 10.1371/journal.pone.0011475. [DOI] [PMC free article] [PubMed] [Google Scholar]
- 39.Eikenberry SE, Nagy JD, Kuang Y. The evolutionary impact of androgen levels on prostate cancer in a multi-scale mathematical model. Biol Direct. 2010;5:24. doi: 10.1186/1745-6150-5-24. [DOI] [PMC free article] [PubMed] [Google Scholar]
- 40.Armstrong AJ, Marengo MS, Oltean S, Kemeny G, Bitting RL, Turnbull JD, Herold CI, Marcom PK, George DJ, Garcia-Blanco MA. Circulating tumor cells from patients with advanced prostate and breast cancer display both epithelial and mesenchymal markers. Mol Cancer Res. 2011;9(8):997–1007. doi: 10.1158/1541-7786.MCR-10-0490. [DOI] [PMC free article] [PubMed] [Google Scholar]
- 41.Nieto MA. Epithelial plasticity: A common theme in embryonic and cancer cells. Science. 2013;342(6159):1234850. doi: 10.1126/science.1234850. [DOI] [PubMed] [Google Scholar]
- 42.Haffner MC, Mosbruger T, Esopi DM, Fedor H, Heaphy CM, Walker DA, Adejola N, Gurel M, Hicks J, Meeker AK, Halushka MK, Simons JW, Isaacs WB, De Marzo AM, Nelson WG, Yegnasubramanian S. Tracking the clonal origin of lethal prostate cancer. J Clin Invest. 2013;123(11):4918–4922. doi: 10.1172/JCI70354. [DOI] [PMC free article] [PubMed] [Google Scholar]
Associated Data
This section collects any data citations, data availability statements, or supplementary materials included in this article.