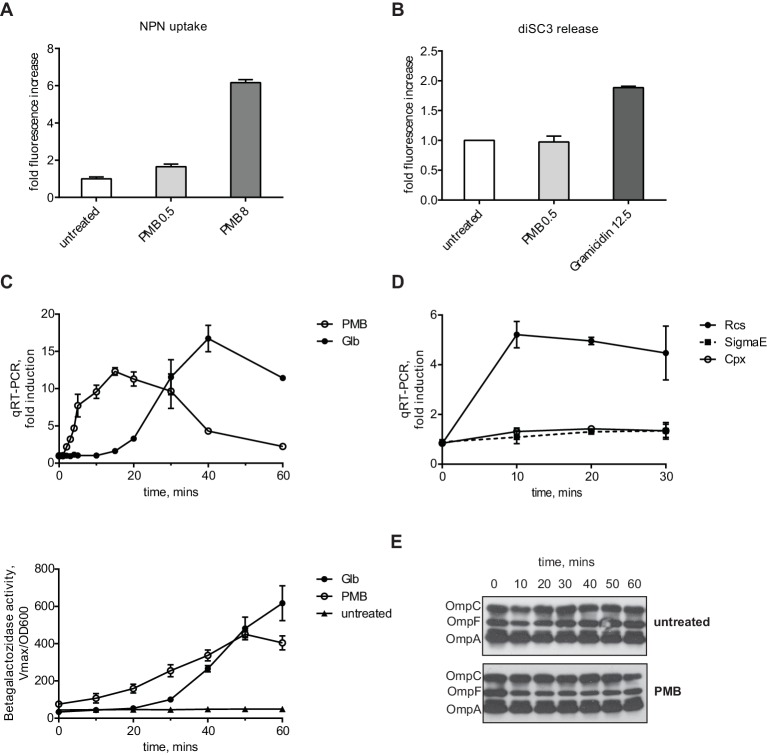
Figure 1. PMB causes a specific OM defect.
(A) PMB at 0.5 µg/ml causes a slight OM permeability defect based on increased uptake and fluorescence of NPN dye. Graphs represent mean normalized end-point fluorescence +/-SD, n=3. (B) This concentration of PMB does not cause depolarization of the IM. Unlike gramicidin, PMB is unable to release PMF-dependent DiSC3(5) dye. Graphs represent mean normalized end-point fluorescence +/-SD, n=3. (C) Kinetics of Rcs induction upon PMB and Glb treatment at the mRNA (upper panel) and protein level (lower panel). Induction was monitored using a chromosomal PrprA-lacZ reporter by qRT-PCR or β-galactosidase assays. For mRNA quantification, graphs represent relative expression values normalized to a no treatment control for each time point +/- SD. β-galactosidase activity represent mean Vmax normalized to OD600, +/- SEM, n=3. (D) PMB induces Rcs but not the Cpx or SigmaE stress responses. Induction was monitored by following the relative expression of PrprA-lacZ (Rcs), cpxP (Cpx) or rpoE (SigmaE) by qRT-PCR. Graphs represent mean +/- SEM, n=3. (E) PMB does not cause OMP assembly defects based on immunoblot analysis.
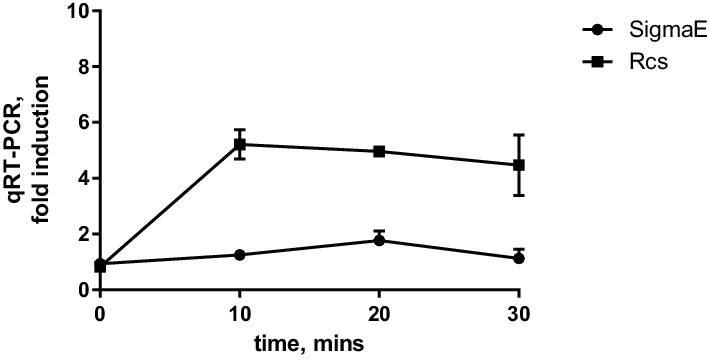
Figure 1—figure supplement 1. Glb induces Rcs but not the SigmaE stress response.


