

Abstract
Traumatic brain injury is a leading cause of disability and injury-related death. To enhance our ability to prevent such injuries, brain response can be studied using validated finite element (FE) models. In the current study, a high-resolution, anatomically accurate FE model was developed from the International Consortium for Brain Mapping brain atlas. Due to wide variation in published brain material parameters, optimal brain properties were identified using a technique called Latin hypercube sampling, which optimized material properties against three experimental cadaver tests to achieve ideal biomechanics. Additionally, falx pretension and thickness were varied in a lateral impact variation. The atlas-based brain model (ABM) was subjected to the boundary conditions from three high-rate experimental cadaver tests with different material parameter combinations. Local displacements, determined experimentally using neutral density targets, were compared to displacements predicted by the ABM at the same locations. Error between the observed and predicted displacements was quantified using CORrelation and Analysis (CORA), an objective signal rating method that evaluates the correlation of two curves. An average CORA score was computed for each variation and maximized to identify the optimal combination of parameters. The strongest relationships between CORA and material parameters were observed for the shear parameters. Using properties obtained through the described multiobjective optimization, the ABM was validated in three impact configurations and shows good agreement with experimental data. The final model developed in this study consists of optimized brain material properties and was validated in three cadaver impacts against local brain displacement data.
Keywords: Brain atlas, Head injury, Validation, Optimization, Finite element model, CORA
1 Introduction
Each year, approximately 1.7 million people in the USA suffer from traumatic brain injury (TBI) (Faul et al. 2010). TBI is a major public health concern as it is a leading cause of disability and injury-related death—accounting for nearly one-third of all injury-related deaths. To predict and mitigate or prevent these types of injuries, fundamental injury mechanisms need to be well characterized and understood. While there are many theories about the underlying injury mechanisms of various brain injuries, the biomechanical basis for many of these injuries is not fully understood. Various methods have been used over the years to investigate and gain a deeper understanding of brain injury, including experimental testing of animal models, postmortem human subjects (PMHSs), anthropomorphic test devices (ATDs), as well as computational models of the brain (Stalnaker et al. 1977; Abel et al. 1978; Gennarelli et al. 1982; Meaney et al. 1993; Takhounts et al. 2003; Greenwald et al. 2008). Finite element (FE) models are powerful tools for investigating injury mechanisms because they provide spatial and temporal distributions of stresses and strains over the problem domain. The quality of a model’s predictions, however, is dependent on the accuracy of the modeled geometry and the model’s ability to describe complex mechanical behavior and material response.
Many FE brain models with varying degrees of anatomical accuracy, element size and material properties have been developed to study brain injury over the last few decades. The earliest models represented the brain–skull structure with a simple fluid-filled spherical shell; model complexity subsequently increased, and the most advanced models now include the major anatomical brain structures and different material properties for each component in the brain (Kenner and Goldsmith 1972; Chan 1974; Khalil and Hubbard 1977). Among these are the Royal Institute of Technology Kungliga Tekniska Högskolan (KTH) brain model, the Simulated Injury Monitor (SIMon), the Dartmouth Head Injury Model (DHIM), the Wayne State University Brain Injury Model (WSUBIM) as well as the head models of full-body FE models such as the Total Human Model for Safety (THUMS) and the Global Human Body Models Consortium (GHBMC) (Kleiven and Holst 2002; Takhounts et al. 2003; Ji et al. 2014, 2015; King et al. 2003; Kimpara et al. 2006; Mao et al. 2013). The geometry of various structures within these head models was derived from medical images, such as computed tomography (CT) and magnetic resonance imaging (MRI). The model development process typically involves image segmentation to define three-dimensional (3D) surfaces of desired structures followed by a surface-based mesh generation process. During this process, complex anatomical features are frequently simplified and ‘smoothed’ to enable faster development and simple interaction at model interfaces. One feature of particular importance that is oversimplified in many brain FE models is the surface of the brain. The brain surface is typically modeled as a smooth surface surrounded by a uniform layer of cerebrospinal fluid (CSF), which ignores the intricate folds throughout the brain, called gyri and sulci. This simplification and reduction in anatomical accuracy may significantly impact the model’s local brain response and subsequent prediction of injury. Various efforts to study the influence of sulci have been conducted in recent years (Cloots et al. 2008; Ho and Kleiven 2009; Lauret et al. 2009). Cloots et al. (2008) compared several two-dimensional models with varying sulci geometries to a homogeneous model with no sulci and found that the stress fields between the models differed. Another limitation of previous models is the substantial amount of time required for the surface-based mesh generation process, which hinders production of patient-specific models. Patient-specific and population-specific models are desirable for studying head injury due to significant variations in brain morphology between individuals (Kleiven and Holst 2002; Urban et al. 2012; Pfefferbaum et al. 1994; Good et al. 2001a,b).
The objective of this study was twofold. The first objective was to create a high-resolution, anatomically accurate brain finite element model from the International Consortium for Brain Mapping (ICBM) brain atlas using a voxel-based mesh generation approach. The second objective was to optimize the brain and falx material properties using cadaveric experimental data in three distinct impact configurations. This atlas-based brain model (ABM) is proposed as a new tool for studying brain injury that can accurately predict local stresses and strains in brain tissue by providing a high level of anatomical accuracy.
2 Methods
The ABM was developed from the geometry of the ICBM brain template, a high-resolution structural average of T1-weighted MRI scans of normal young adult brains. The ICBM average brain template is a probabilistic atlas in Montreal Neurologic Institute (MNI) space that represents the average anatomy of a normal adult brain (Mazziotta et al. 1995, 2001). Cortical gyri, subcortical structures and large brain structures have been manually segmented to create independently labeled regions of the brain including white matter, gray matter and CSF. An FE model was created from this image set by converting each 1-mm isotropic voxel into a single element of the same size using a custom code developed in MATLAB (The MathWorks, Natick, MA). While the high level of detail provided by the atlas allows the opportunity to represent many detailed brain structures, initial model development combined the label maps to include only four distinct parts: cerebrum (combined white and gray matter), cerebellum, CSF and ventricles. Because the model was developed from a skull-stripped image set, there were places on the outer surface of the brain that were not completely covered by CSF initially. Since this is not a realistic representation of the brain–skull interface, a single, uniform layer of CSF was added around the entire model to ensure that there was at least one CSF element between the brain and skull at all points. This additional layer of CSF was 74mL and increased the CSF volume from 192.3 to 266.3mL, which is reasonable when compared to real-world CSF volumes (Matsumae et al. 1996). The falx cerebri and tentorium cerebelli are important structures in the cranium which were not represented in the ICBM atlas, so they were manually implemented into the model. The falx was defined as a layer of shell elements along the midsagittal plane and the tentorium as a layer of shell elements on the superior surface of the cerebellum, separating the cerebrum and cerebellum (Fig. 1b). Lastly, a layer of rigid shells surrounding the external surface of the CSF was generated in LS-PrePost to completely enclose the model. The current model, shown in Fig. 1, has approximately 2 million nodes and elements.
Fig. 1.

Isometric view of the ABM showing detail of sulci and gyri (a), view inside the skull showing the falx, tentorium and ventricles (b), and axial (c), sagittal (b), and coronal (c) cross sections
The treatment of interface conditions and the selection of material models and parameters are very important aspects of any FE model. The boundary condition at the brain–skull interface is particularly important because relative motion between the brain and skull is necessary to accurately model the response of the brain. In general, there are three accepted methods of modeling the brain–skull interface: common nodes between the brain and skull, modeling the CSF with a low shear modulus or using various contact algorithms. Some studies may use a combination of these three accepted methods. The second approach was selected in the current model, with all interfaces modeled with merged nodes. This approach preserves relative motion at the brain–skull interface by modeling the CSF as a fluid-like material which allows large element deformations to simulate relative motion. This implementation was motivated by the results of an investigation conducted by Chafi et al. (2009) that evaluated the effects of three different CSF constitutive models: elastic fluid, viscoelastic and nearly incompressible elastic. This study found that the most comparable results to experimental data resulted from modeling the CSF as a fluid-like material (Chafi et al. 2009). Material parameter values for all parts excluding the brain, which will be discussed separately, were derived from SIMon (Table 1; Takhounts et al. 2003, 2008). Examining the skull properties in Table 1, note that the value used for density is so large because the skull is modeled with two-dimensional (2D) shell elements and using a realistic density value would result in a skull mass much lower than expected. The ABM also uses shell elements to model the skull, so to achieve an appropriate mass, skull density was specified to produce a realistic skull mass of approximately 3kg (ρ = 22, 311 kg/m3).
Table 1.
Material properties of the ABM
| Part | LS-DYNA material model | Material properties |
|---|---|---|
| CSF/ventricles | Elastic fluid | ρ = 1000 kg/m3, E=0MPa, ν = 0.3, K=2100MPa |
| Falx*/tentorium | Elastic | ρ = 1130 kg/m3, E=31.5MPa, ν = 0.45, K=2100MPa |
| Skull | Rigid | ρ = 22311 kg/m3, E=6900MPa, ν = 0.3 |
| Brain | Kelvin–Maxwell linear viscoelastic | Optimized |
Falx material properties optimized in lateral impact condition
2.1 Brain material optimization
The values of brain material parameters vary greatly throughout the literature, which motivates the current optimization study (Table 2). Brain tissue is often modeled using a linear viscoelastic material formulation (Takhounts et al. 2003; Kimpara et al. 2006; Mao et al. 2013; Zhang et al. 2001a,b; Al-Bsharat et al. 1999; Horgan and Gilchrist 2004; Jiroušek et al. 2005). The shear relaxation behavior is described by:
| (1) |
where G∞ is the infinite shear modulus, G0 is the initial shear modulus, and β is the decay constant. Therefore, this material model was selected for material optimization. Brain density (ρ), bulk modulus (K) and the three shear parameters (G∞, G0, β) were varied using Latin hypercube sampling (LHS) to generate 100 combinations of material parameters or 100 distinct brain material models. Because of the relationship between G∞ and G0 in defining shear relaxation, G∞ must be less than G0 for every material model generated by the LHS. To accomplish this, instead of varying G∞ and G0 independently, G0 and the ratio G∞/G0 were varied. In LHS, each parameter is varied over a predefined range (Table 2) independent of the values of other variables and orthogonal sampling is employed over the multidimensional sample space to generate samples that are representative of total variability. The parameter ranges displayed in Table 2 were obtained from literature values and other published finite element models. Because the reported ranges for bulk modulus, shear modulus and the decay constant span orders of magnitude, logarithmic sampling was employed for these variables in order to appropriately sample the lower range of values. To evaluate the effect of each parameter and determine the optimal values for each, the performance of the ABM with each material model was compared to experimental data.
Table 2.
Parameter ranges for Latin hypercube sample
| Min/max | Reference | |
|---|---|---|
| ρ kg/m3 | 1000 | Kimpara et al. (2006) |
| 1140 | Willinger et al. (1999) | |
| K GPa | 0.002 | Ji et al. (2014, 2015) |
| 2.19 | Al-Bsharat et al. (1999), Willinger et al. (1999), Zhang et al. (2001a,b), Kimpara et al. (2006), Chafi et al. (2009), McAllister et al. (2012), Kangarlou (2013), Mao et al. (2013), Post et al. (2014) | |
| G0 kPa | 0.772 | Kleiven and Hardy (2002) |
| 49 | Pinnoji et al. (2010), Tinard et al. (2012) | |
| G∞ kPa | 0.185 | Jiroušek et al. (2005) |
| 16.7 | Pinnoji et al. (2010), Tinard et al. (2012) | |
| G∞/G0 | 0.1 | Ji et al. (2014, 2015) |
| 0.5584 | Takhounts et al. (2003) | |
| β s−1 | 0.06 | Kimpara et al. (2006) |
| 400 | Kangarlou (2013) |
2.2 Experimental tests
Three experimental tests were investigated in this study: C755-T2 (occipital impact), C383-T1 (frontal impact) and C291-T1 (parietal impact; Hardy et al. 2001; Hardy 2007). These three tests were chosen for optimization purposes because they cover a range of impact velocities and directions. In these cadaveric tests, local displacements at various locations throughout the brain were analyzed following impacts of varying severity and direction (Hardy 2007). In each experiment, vertical columns of 5–6 radio-opaque neutral density targets (NDTs) were implanted in the brain, and a high-speed biplanar X-ray system was used to track their relative motion during the impact. Three-dimensional skull kinematics were evaluated with an accelerometer array affixed to the cadaver skull to determine linear and angular velocities at the head center of gravity (CG), which were used as boundary conditions to drive the ABM simulations. In the ABM, nodes closest to the physical location of each NDT were identified with respect to the Frankfurt plane (Fig. 2) and their displacements were calculated throughout each simulation (Table 3). Summary characteristics for the three tests are shown in Table 4.
Fig. 2.

Approximate cross-sectional planes where NDT columns are located for each experimental test (a), locations of NDTs in the XZ plane on the right side of the brain (b) and locations of NDTs in the XZ plane on the left side of the brain (c)
Table 3.
Summary of experimental test conditions
| Hardy C755-T2 | Hardy C383-T1 | Hardy C291-T1 | |
|---|---|---|---|

|

|

|
|
| Impact location | Occipital | Frontal | Parietal (R) |
| Impact type | Acceleration | Deceleration | Deceleration |
| Relative severity | Low | Medium | High |
| Peak G(g) | 22 | 63 | 162 |
| Delta V (m/s) | 1.90 | 3.91 | 4.47 |
| Impact duration (ms) | 59 | 118 | 98 |
| NDTs | Two columns of five | Two columns of six | Three columns of five* |
Results for all NDTs in this experimental test were not reported due to NDT tracking difficulties in the original source paper (Hardy 2007)
Table 4.
Material properties from each experimental configuration optimization
| Optimization condition | ρ (kg/m)3 | K (GPa) | G0 (kPa) | G∞ (kPa) | β (s−1) | CORA |
|---|---|---|---|---|---|---|
| C755* | 1061 | 0.2539 | 4.121 | 2.160 | 33.48 | 0.453 |
| C383* | 1036 | 0.5326 | 4.634 | 1.321 | 64.75 | 0.424 |
| C291* (original) | 1021 | 0.1066 | 19.20 | 10.80 | 283.2 | 0.491 |
| C291* (optimized falx) | 1113 | 0.2706 | 17.26 | 5.099 | 247.4 | 0.473 |
| ALL* | 1123 | 0.1069 | 5.161 | 1.859 | 67.58 | 0.426 |
Simulation with best CORA score for given configuration
2.3 Model performance
To evaluate the effect of varying each material parameter and identify the optimal material properties, the accuracy of the ABM’s response for each combination of material parameters was quantified. The metric used to quantify the difference between model response and experimental data was CORA (CORrelation and Analysis), a relatively new metric developed to assess FE model performance (Gehre et al. 2009). Traditionally, evaluation of an FE model’s performance compared to experimental data has been achieved through comparison of peak values, by qualitative evaluation of signal shape, or point-by-point error analysis (Yu et al. 2004). In contrast, CORA is an objective rating method that combines two independent submethods, a corridor rating and a cross-correlation rating. These two ratings range from 0 to 1 and are averaged to determine the CORA rating (one indicates a perfect match). The corridor method computes a rating based on where the simulation curve falls in relation to corridors around the experimental curve. The cross-correlation method is based on ratings for the phase shift, size and shape of time-shifted curves. Vavalle et al. (2013) found CORA to be the most comprehensive metric of the three objective rating methods studied (Sprague and Geers, Cumulative Standard Deviation and CORA). Previous methods used to assess model performance are not as strong as CORA because they typically either only look at peak values or use a point-by-point comparison, such as root mean square (RMS), to quantify error. In addition to incorporating both point-by-point and peak value comparisons for assessing model performance, CORA is also able to evaluate the cross-correlation of two curves.
The ABM was subjected to the boundary conditions from the three experimental tests implemented with each of the 100 brain material models, resulting in a total of 300 simulations. Average CORA values computed from all NDTs were calculated for all 300 simulations to identify the model with the best response and the combination of properties that best correlated with experimental data. It was hypothesized that this would result in similar material parameters for each experimental condition. During the optimization process, however, ideal shear properties for the C291-T1 case were approximately five times larger than for the C755-T2 and C383-T1 cases (Table 4). Given the lateral configuration of the C291-T1 case, one would anticipate the falx to play a major role in brain response. Additionally, the high shear properties that resulted from the C291-T1 optimization indicated that there was too much lateral motion, or in other words, that the falx was not constraining lateral motion sufficiently.
2.4 Falx material optimization
The observation that the shear stiffness of the brain was unusually high to achieve good agreement with experimental data in the lateral impact case motivated investigation and optimization of the falx model. An additional LHS was conducted that varied falx pretension from 0 to 10% and falx thickness from 0.41 to 7mm. These ranges were adapted from Golman et al. (2013). Pretension was implemented using an optional material card in LS-DYNA that pre-strains the material by a desired factor. The resulting values for pretension and thickness of the falx were then implemented into the ABM with each of the original 100 brain material models, and the C291-T1 optimization was rerun. The tentorium retained its original formulation and material parameters (Table 1). The frontal and occipital cases were not rerun because the motion was in the sagittal plane for both cases and not greatly affected by the falx properties.
2.5 Data analysis
To quantify ABM performance, a CORA score was computed for all 300 simulations—the three impact conditions with each combination of material parameters incorporated into the model. The single CORA score for each simulation was calculated by first averaging the X- and Z-CORA (or Y- and Z-CORA for the C291-T1 case) scores for each NDT to get individual NDT CORA scores and then averaging all NDT scores to determine an average CORA score for a given simulation. The relationship between CORA scores and material parameters was evaluated by computing the strength of the piecewise linear regression for each parameter. Material parameters were optimized under each impact condition using CORA as the optimization parameter, and the combination of material properties that produced the best result was identified for each of the three impact configurations. Additionally, we can concurrently optimize the material properties against the three impact conditions simultaneously. We do this by averaging the CORA scores for the C755-T2, C383-T1 and C291-T1 cases for the ABM with each combination of material parameters. The model with the highest average CORA between all three impact conditions (using the optimized falx model) was identified, and its material parameters were determined to be the optimal material properties.
3 Results
The ABM has been developed from the ICBM brain atlas and currently contains 7 parts and about 2 million nodes and elements. The brain and CSF volumes are 1639.4 and 277.1mL, respectively, the total model mass is 5.07kg, and the intracranial mass (cerebrum, cerebellum and lateral ventricles) is 1.85kg. The ratio of hourglass energy to internal energy in the brain was computed for the optimized model and was below the recommended value of 10% (Zhang et al. 2001a). A typical simulation of the occipital impact (64.5ms) took 1h and 56min on 48 processors; however, model run time is dependent on d3plot output frequency.
ABM response was compared with experimental data for all 100 variations for each of the three test configurations, and average CORA values for each simulation were computed. Relationships between CORA scores and material parameters for each of the test conditions are shown in Fig. 3. The results for the lateral case shown in Fig. 3 represent the ABM before the falx model was optimized. Also displayed in these plots are piecewise linear regressions for CORA regressed against each parameter. The material properties for the variation with the highest CORA score from each experimental configuration are shown in Table 4.
Fig. 3.

Relationships between CORA and brain material parameters from brain parameter variations in three experimental configurations (using the original falx model in all variations). The simulation with the highest CORA value for each individual impact condition is highlighted
Figure 4 shows the relationships between CORA and the falx pretension and thickness varied in the falx optimization using the lateral experimental configuration. The parameter sample space and model performance throughout these ranges are represented in Fig. 4c. The results from this variation indicate that the optimal falx pretension is 6.52% and the optimal thickness is 2.86mm. Using these values in the falx model, the brain material optimization in the C291-T1 parietal impact was rerun. The results of this updated optimization are displayed in Table 4 and Fig. 5 (‘C291*’). Finally, the material properties that result from concurrently optimizing the CORA values of the three impact conditions were determined (Table 4). The concurrent optimization identifies the combination of material properties that has the highest average CORA score between the three impact configurations. These material properties are marked in Fig. 5 with a star (‘ALL*’).
Fig. 4.

CORA relationships with falx pretension (a) and falx thickness (b) for the C291-T1 impact and model performance throughout the parameter space (c) for the falx optimization
Fig. 5.

Relationship between CORA and shear modulus, G0, for material optimizations in occipital (a), frontal (b) and parietal (using optimized falx model) (c) impact configurations. The simulation rep resenting the optimal material model for each condition optimized individually is shown (C755*, C383* and C291*), as well as optimized concurrently (ALL*)
From Fig. 3, it can be observed that the shear parameter, G0, has the largest influence on CORA. Considering the results from the frontal, occipital and updated lateral (with optimized falx model) optimizations, the relationship between G0 and CORA for each experimental configuration can be examined (Fig. 5).
3.1 C755-T2
The local displacements of each NDT for each experimental impact are presented in Figs. 6, 7, 8 using the material model obtained through concurrent optimization of all three experimental conditions. Relative displacement results for the NDTs in the C755-T2 are shown in Fig. 6. The average CORA score for all NDTs (in x- and z-directions) is 0.445. The average CORA score in the x-direction is 0.383 and in the z-direction is 0.508. The NDT with the highest CORA rating in the x-direction was A2 and in the z-direction was P3 with ratings 0.653 and 0.713, respectively. When considering combined x- and z-direction CORA scores, P2 had the highest score of 0.539 and A4 had the lowest with 0.275.
Fig. 6.
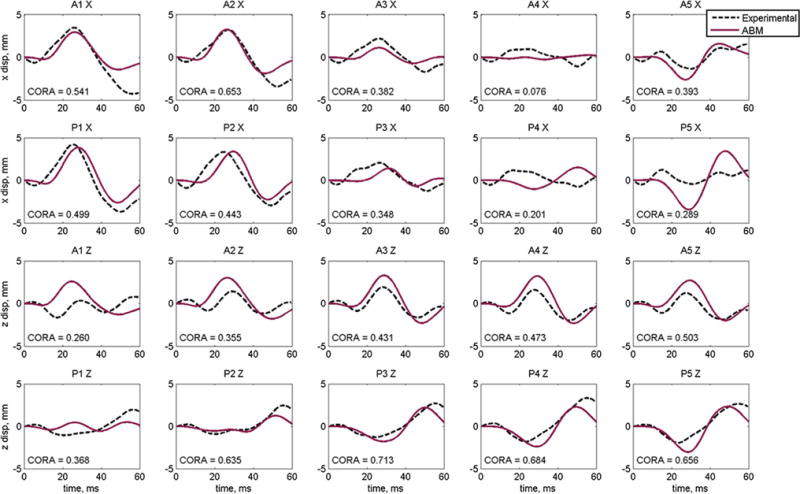
Displacement results and individual CORA scores for the optimized material properties for Hardy C755-T2 occipital impact for anterior (A) and posterior (P) NDT columns
Fig. 7.

Displacement results and individual CORA scores for the optimized material properties for Hardy C383-T1 frontal impact for anterior (A) and posterior (P) NDT columns
Fig. 8.
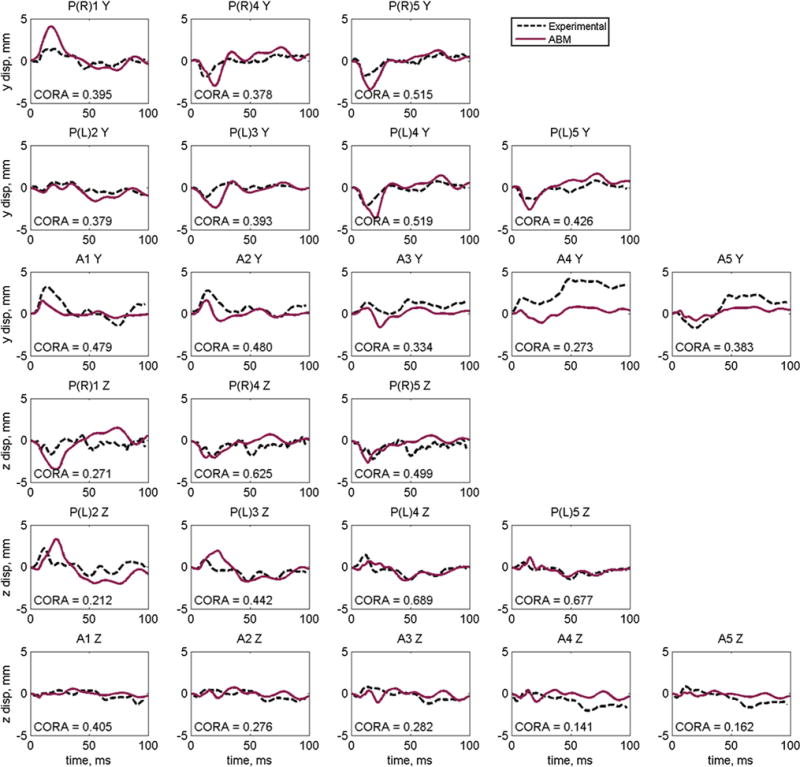
Displacement results and individual CORA scores for the optimized material properties for Hardy C291-T1 lateral impact for the anterior (A) and posterior (P) right (R) and left (L) columns
3.2 C383-T1
The results for the NDT relative displacements for the C383-T1 impact are shown in Fig. 7. The average CORA score for all NDTs for the frontal case is 0.421. The average CORA score in the x-direction is 0.391 and in the z-direction is 0.452. The NDT with the highest CORA rating in the x-direction and the z-direction was P6 with ratings 0.564 and 0.675, respectively. The NDT with the highest average x- and z-direction CORA rating was P6 with a score of 0.620, and the NDT with the lowest average CORA score was P1 with a score of 0.261.
3.3 C291-T1
The results for the relative displacements of the NDTs in the C291-T1 case are shown in Fig. 8. The average CORA score for all NDTs for this case is 0.412. The average CORA score in the y-direction is 0.416 and in the z-direction is 0.408. The NDT with the highest CORA rating in the y-direction and the z-direction was PL4 with ratings 0.519 and 0.689, respectively. The NDT with the highest average y- and z-direction CORA rating was PL4 with a score of 0.604, and the NDT with the lowest average CORA score was A4 with a score of 0.207. Refer to Fig.2 for anatomical reference of NDT locations.
4 Discussion
An FE model of the human brain was developed in the current study using a voxel-based mesh generation approach. A novel method to determine the material properties of the brain was employed using Latin hypercube sampling and CORA to quantify error and optimize response. During this process, brain and falx material properties were concurrently optimized against three cadaver experiments using localized displacement data. The three experiments considered (C755-T2, C383-T1 and C291-T1) were chosen because they are dynamic impacts, varying in impact direction as well as severity of impact which allows for evaluation of the ABM in a wide range of loading conditions.
Figure 3 demonstrates the regression strengths between CORA and each material parameter. The parameter with the strongest relationship with CORA is the shear modulus, G0 with piecewise regression coefficients of 0.755, 0.686 and 0.887 for the occipital, frontal and lateral impacts, respectively. The next largest coefficients result from regressing the shear ratio, G∞/G0 and CORA, and the strongest of these achieves only 0.101, which signifies a much weaker relationship than was observed for G0. This supports that G0 is the most important parameter in determining the localized displacement response of the brain in the set of experimental conditions for which the model was optimized. The general trend between G0 and CORA is that increasing the shear stiffness improves the CORA rating up until a critical value—after which continued increase in stiffness causes the CORA score to decrease. For the occipital and frontal cases, Fig. 4 indicates this critical shear modulus value occurs around 4.5kPa (log(4.5kPa) = 1.50). The critical value for the lateral case, however, is almost 20kPa (log(20kPa) = 3.00). In other words, during this original material optimization process the frontal and occipital cases optimized to shear properties similar to each other, while the optimal shear properties for the lateral case were about five times stiffer.
The similarity in results between the two cases with motion in the sagittal plane (C755-T2 and C383-T1), which is parallel to the falx, coupled with the divergence of parameters in the lateral case motivated an additional LHS varying falx properties (pretension and thickness). The results of this variation (Fig. 4) show an increase in model performance with increasing pretension up to about 4%, and then a plateau in CORA score to around 8%. With increasing falx thickness, there is an increase in the CORA score up to the critical thickness of 2.86mm followed by a relatively con stant CORA score following this maximum. This plateau in CORA scores between 2 and 3mm supports falx thickness measurements reported in literature, as opposed to the larger values investigated which were not derived from physiological measurements. This plateau behavior indicates that optimized material properties may be achieved without the need to use an unrealistically large falx thickness. The upper value for the thickness range was derived from Takhounts et al. (2003), who stated that this thickness value is larger than physiologically observed, but was used anyway in an effort to avoid sharp contact along edges of the falx and to ease the numerical contact interaction (Takhounts et al. 2003).
At first glance, there does not appear to be much improvement in the optimized properties for the lateral case after incorporating the optimized falx model (Table 4), considering the shear modulus only decreases from 19.20 to 17.26kPa. Looking closer at the relationships between CORA and G0 (Fig. 5), however, an interesting characteristic of the relationship in the lateral variation becomes apparent (Fig. 5c)—a local maximum, which was not present when using the original falx model. While the global maximum value of CORA for this variation occurs at 17.26kPa, there is a local maximum at 5.6kPa, which is much more comparable to the shear modulus values obtained from the occipital and frontal optimizations. Furthermore, the result of concurrently optimizing the CORA scores from the three impact conditions produces a shear modulus value very near this local maximum of 5.2kPa (‘ALL*’ in Fig. 5). The shear properties that result from the current optimization study are G0 = 5.16 kPa, G∞ = 1.86 kPa and β = 67.6 s−1 (Table 4). Examining values reported for the initial shear modulus throughout literature, despite an overall range spanning two orders of magnitude, there are a large number of references to values between 5 and 15kPa, which agrees with the value identified in the current study (G0 = 5.2 kPa). The experimentally derived shear properties of Galford and McElhaney (1970) (G0 = 6.7 kPa, G∞ = 3 kPa) and Bilston et al. (1997, 2001) (G0 = 5.5 kPa, G∞ = 1 kPa) agree most closely with those derived in the current study.
Accounting for all three impact configurations, the best model response is achieved by using the brain material parameters determined by concurrent optimization of the C755-T2, C383-T1 and C291-T1 cases. Implementing these properties (‘ALL*’ in Table 4) into the ABM, we can evaluate model performance in each of the impact configurations. Examining the experimental NDT motion following the C755-T2 occipital impact, the response is generally characterized by a figure-eight or looping pattern. Each NDT displays a small (∼1 mm) initial displacement followed by a larger displacement in the opposite direction. In general, ABM validation against C755-T2 local displacements shows good agreement with experimental data for nearly all NDTs. In the x-direction, we observe a magnitude discrepancy in A4 and P5 and a phase error in P4. In the z-direction, there is very good shape and magnitude agreement overall; however, there is a slight magnitude difference in A1 and a minor shape difference in P1.
As seen in Fig. 7, C383-T1 is a longer impact (118ms) with a more complex response than the occipital case (59ms). However, even with this added complexity, the ABM predicts local brain displacements with comparable shape to the experimental data. In the x-direction, the ABM predicts response with very similar shape to the experimental data for A1, A2, A5, A6, P1, P2, P5 and P6. While the overall shape is similar, the ABM under-predicts displacement in the inferior NDTs and over-predicts displacement for more superior NDTs. In the z-direction, the ABM follows the overall trend of the experimental data in most cases (A1–A5, P2–P6), although in the case of the ABM we see more pronounced local minimums and maximums when compared to the experimental curves.
For the parietal experimental condition, there were three columns of five NDTs, one column in the right hemisphere of the brain (site of impact) and two columns in the left hemisphere. For the right NDT column, displacement results were reported for only 3 of the 5 NDTs (1, 4 and 5), and for the posterior column on the left side, results were reported for 4 of the 5 NDTs (2–5). Examining the results of the right NDT column (Fig. 8), the ABM predicts response very well in overall shape as well as magnitude. In the y-direction, the ABM tends to over-predict displacement in the right NDT column and under-predict in the NDTs in the left column. In the z-direction, Fig. 8 indicates that the ABM over-estimates displacement for PR1, PL2 and PL3 but shows good agreement in magnitude with the remaining NDTs.
4.1 Limitations
Limitations of this study include various simplifications and assumptions in the model itself, as well as limitations of the experimental methods considered and their application to FE models. Geometric simplifications of the ABM include the combined gray and while matter in the cerebrum, as well as the omission of some other functionally important brain structures, such as the corpus callosum. Also, while the cerebellum is separate from the cerebrum, it does not have distinct material properties. Even with such simplified geometry, however, the ABM was still able to achieve good overall response and perform well in validation tests. Additional limitations are introduced by the assumption that the brain is homogeneous and isotropic. Previous studies have shown that the material properties of gray and white matter differ from each other and that tissue response is anisotropic; in particular, white matter, which consists of highly oriented bundles of axons, exhibits this behavior (Prange and Margulies 2002). Recently, models such as the DHIM and the KTH model have implemented fiber orientation and shown changes in strain patterns and magnitudes (Ji et al. 2015; Giordano and Kleiven 2013). Although the exclusion of fiber orientation is a limitation of the current model, Golman et al. 2013 reported that the inclusion of anisotropy does not significantly improve the model’s ability to predict local displacements, so this simplification is accepted in the current model and will be addressed in future model versions. The assumptions of homogeneity and isotropy were used in the current study as a first step in model development to understand the effective response of the brain in a simplified setting. The brain–skull interface is also simplified in the ABM. It is modeled with shared nodes, which does not allow relative motion at the interface of the CSF and skull. While this is a simplification of the brain–skull interface, we investigated other boundary conditions, such as surface to surface and sliding contacts, and determined its formulation had little effect on the results of interest (internal brain displacements) in the current investigation. However, further investigation of improved modeling of this interface is warranted for evaluating localized stress distribution at the surface of the brain. We concluded that the separation of the brain and skull with the CSF material at all boundary locations was sufficient to model relative motion between the brain and skull and resulted in a good response. Another characteristic of the ABM that may introduce error is the ‘stair-stepped’ nature of the elements. Since the ABM was developed using a voxel-based approach, all interfaces in the model possess cubic elements interacting with one another. While this feature of the ABM is not ideal, we did not observe any unusual strains in the edge elements at the boundary between the brain and CSF, probably owing to small element size and the compliant boundary condition created by surrounding CSF. Limitations of the experimental methods include the lack of physiological response when using cadavers. These effects were mitigated by Hardy et al. (2001) by perfusing the specimens with artificial cerebrospinal fluid (aCSF) and conducting the tests in an inverted configuration, which allowed the evacuation of gasses from the intracranial space (Hardy et al. 2001). Additionally, there is an inherent limitation on the cadavers, considering most specimens are in the elderly population. This is an accepted shortcoming/weakness, however, because it is the best available method to characterize brain response across a range of loading rates. Brain response in living subjects can be quantified using magnetic resonance elastography (MRE), but this method cannot be used to study high-rate loading (Green et al. 2008; Zhang et al. 2011). Limitations of the application of the experimental conditions include errors introduced by the difference in head geometry between the ABM and cadaveric specimens. The three experimental configurations considered all used different cadavers with slightly different head size and shape, which were all compared to the ABM, which represents the average brain. However, the average brain dimensions for the three cadavers tested experimentally did not differ greatly from the ABM. Additionally, there is error associated with the location of the head CG since it was estimated with respect to the Frankfurt plane using medical images.
4.2 Future work
Future development of this model will involve a distinction between gray and white matter, which will allow differentiated material models for both. Additional improvements to these material models will include the incorporation of directional anisotropy (white matter), regional differences and age dependence. Additional brain structures will also be distinguished in the model, including the corpus callosum, brainstem and meningeal layers. A more detailed skull model is another area of interest that will allow a wider variety of impacts to be simulated, such as blunt impact. Improvement to the model will also include enhancement of the brain–skull interface, involving smoothing of the surface elements along contact interfaces. Additionally, the voxel-based approach presented in the current study facilitates the production of patient or population-specific models in the future due to the automated method of model generation, which is an improvement over current models because it does not include a surface-meshing step. This process also provides a consistent model formulation (part definitions, contacts, material properties, etc.) that has been validated, in contrast to various other patient-specific models that have been generated for the purpose of studying relative differences between models and have not necessarily been well validated biomechanically. Furthermore, since the current model was developed from an atlas, it will be possible to use image registration techniques developed for neuroradiology research to warp the atlas to specific subjects to generate subject-specific atlas-based brain models. A detailed comparison of the ABM’s performance with other computational models from the literature was beyond the scope and space limitations of the current study but will be explored separately. Overall, the ABM CORA analysis demonstrated improvement over the capabilities of existing, validated brain FE models, and is the first FE model to determine brain material parameters through multiobjective optimization. The detailed anatomical accuracy of the ABM will allow future modeling of injuries like concussion, whose occurrence and severity are dependent on deformation of specific areas of the brain (Meaney and Smith 2011). An area of growing interest that is not well understood and could benefit from FE modeling is chronic traumatic encephalopathy (CTE). The pathology of this disease has been extensively studied and is characterized by the deposition of tau proteins at the depths of the sulci (Baugh et al. 2014). Although the focal nature of CTE pathology has been well characterized, there is relatively little known about the underlying injury mechanisms. If finite element models are to be employed in studying CTE, the inclusion of gyral folds in brain FE models is crucial to gaining a better understanding of the disease, given the focal nature of CTE pathology.
5 Conclusion
The model developed in the current study from the ICBM atlas is an anatomically accurate brain model developed through voxel-based mesh generation. It is the first dynamic biomechanical finite element brain model to include detailed three-dimensional gyral folds for studying detailed brain deformation that has been validated in multiple cadaver experiments against brain displacement data. It is also the first to utilize multiobjective, multidirectional optimization with quantitative comparison between brain deformations and experimental findings. Since there is substantial variation in reported values of brain material properties throughout the literature, the parameters governing the viscoelastic response of the brain were examined in great detail in this study. Material optimization was performed using a novel method which simultaneously optimized model response in three distinct experimental configurations to establish appropriate values for brain material parameters. The use of multiple experimental conditions in this optimization process allows researchers to verify that the identified properties approach the true properties of the brain, as opposed to creating a model that is highly optimized to one impact configuration of a single severity and direction or developed based on inconsistent material testing methods. Additionally, CORA is applied to the results of each simulation and used to quantify the error between experimental and predicted displacements. CORA is demonstrated to be a powerful metric for evaluating model performance, due to its ability to capture multiple aspects of curve similarities, such as phase and progression.
Even with known simplifications, the ABM is able to predict local brain displacements with considerable accuracy when compared to experimental cadaver data, which supports the model’s use in the study and simulation of brain injury. Initial validation of the ABM shows competitive results when compared with existing FE models, and the anatomical accuracy permits enhanced representations of local stress and strain. Investigation of stress and strain distributions from FE models may help characterize injury mechanisms in brain injuries such as concussion. Also, the enhanced detail and accuracy provided by the ABM may allow greater insight into region-dependent injuries, such as CTE and other severe brain injuries including diffuse axonal injury (DAI) and intracerebral hemorrhage (ICH). Further development of the ABM will lead to improved ability to model brain response and predict injury, which aid in a deeper understanding of the biomechanics of head injury. Ultimately, the investigation of injury mechanisms and thresholds through the use of finite element models can be used to predict and prevent traumatic brain injuries.
Acknowledgments
Funding for this project is provided by the National Institutes of Health (R01 NS082453). All simulations were run on the DEAC Cluster at Wake Forest University. The authors would like to thank the ANSIR Lab for providing the ICBM label maps and Elizabeth Lillie for her work on the MATLAB code to produce the ABM from the label maps.
Contributor Information
Logan E. Miller, Email: logmille@wakehealth.edu.
Joel D. Stitzel, Email: jdstitzel@gmail.com.
References
- Abel J, Gennarelli T, Segawa H. Incidence and severity of cerebral concussion in the rhesus monkey following sagittal plane angular acceleration. SAE Technical Papers 1978 [Google Scholar]
- Al-Bsharat AS, Hardy WN, Yang KH, Khalil TB, Tashman S, King AI. Brain/skull relative displacement magnitude due to blunt head impacts: new experimental data and model. Stapp Car Crash J. 1999;43:321–332. [Google Scholar]
- Baugh CM, Robbins CA, Stern RA, McKee AC. Current understanding of chronic traumatic encephalopathy. Curr Treat Options Neurol. 2014;16:1–13. doi: 10.1007/s11940-014-0306-5. [DOI] [PMC free article] [PubMed] [Google Scholar]
- Bilston LE, Liu Z, Phan-Thien N. Large strain behaviour of brain tissue in shear: some experimental data and differential constitutive model. Biorheology. 2001;38:335–345. [PubMed] [Google Scholar]
- Bilston LE, Liu Z, et al. Linear viscoelastic properties of bovine brain tissue in shear. Biorheology. 1997;34:377–385. doi: 10.1016/s0006-355x(98)00022-5. [DOI] [PubMed] [Google Scholar]
- Chafi MS, Dirisala V, Karami G, Ziejewski M. A finite element method parametric study of the dynamic response of the human brain with different cerebrospinal fluid constitutive properties. Proc Inst Mech Eng [H] 2009;223:1003–1019. doi: 10.1243/09544119JEIM631. [DOI] [PubMed] [Google Scholar]
- Chan HS. Mathematical model for closed head impact. SAE Technical Paper 1974 [Google Scholar]
- Cloots R, Gervaise H, van Dommelen J, Geers M. Biomechanics of traumatic brain injury: influences of the morphologic heterogeneities of the cerebral cortex. Ann Biomed Eng. 2008;36:1203–1215. doi: 10.1007/s10439-008-9510-3. [DOI] [PMC free article] [PubMed] [Google Scholar]
- Faul M, Xu L, Wald MM, Coronado VG. Traumatic brain injury in the United States: emergency department visits, hospitalizations and deaths 2002–2006. Centers for Disease Control and Prevention, National Center for Injury Prevention and Control; 2010. [Google Scholar]
- Galford JE, McElhaney JH. A viscoelastic study of scalp, brain, and dura. J Biomech. 1970;3:211–221. doi: 10.1016/0021-9290(70)90007-2. [DOI] [PubMed] [Google Scholar]
- Gehre C, Gades H, Wernicke P. Objective rating of signals using test and simulation responses. Paper presented at: 21st ESV Conference; June 15–18, 2009; Stuttgart. 2009. [Google Scholar]
- Gennarelli TA, Thibault LE, Adams JH, et al. Diffuse axonal injury and traumatic coma in the primate. Ann Neurol. 1982;12:564–574. doi: 10.1002/ana.410120611. [DOI] [PubMed] [Google Scholar]
- Giordano C, Kleiven S. Connecting fractional anisotropy from medical images with mechanical anisotropy of a hyperviscoelastic fibre-reinforced constitutive model for brain tissue. J R Soc Interface. 2013;11:20130914. doi: 10.1098/rsif.2013.0914. [DOI] [PMC free article] [PubMed] [Google Scholar]
- Golman AJ, Wickwire AC, Harrigan TP, et al. Hierarchical model validation of the falx cerebri and tentorium cerebelli. Proceedings of the forty first international workshop 2013 [Google Scholar]
- Good CD, Johnsrude I, Ashburner J, Henson RNA, Friston KJ, Frackowiak RSJ. Cerebral asymmetry and the effects of sex and handedness on brain structure: a voxel-based morphometric analysis of 465 normal adult human brains. NeuroImage. 2001;14:685–700. doi: 10.1006/nimg.2001.0857. [DOI] [PubMed] [Google Scholar]
- Good CD, Johnsrude IS, Ashburner J, Henson RNA, Friston KJ, Frackowiak RSJ. A voxel-based morphometric study of ageing in 465 normal adult human brains. NeuroImage. 2001b;14:21–36. doi: 10.1006/nimg.2001.0786. [DOI] [PubMed] [Google Scholar]
- Green MA, Bilston LE, Sinkus R. In vivo brain viscoelastic properties measured by magnetic resonance elastography. NMR Biomed. 2008;21:755–764. doi: 10.1002/nbm.1254. [DOI] [PubMed] [Google Scholar]
- Greenwald RM, Gwin JT, Chu JJ, Crisco JJ. Head impact severity measures for evaluating mild traumatic brain injury risk exposure. Neurosurgery. 2008;62:789–798. doi: 10.1227/01.neu.0000318162.67472.ad. [DOI] [PMC free article] [PubMed] [Google Scholar]
- Hardy WN. Dissertation, Wayne State University. 2007. Response of the human cadaver head to impact. [Google Scholar]
- Hardy WN, Foster CD, Mason MJ, Yang KH, King AI, Tashman S. Investigation of head injury mechanisms using neutral density technology and high-speed biplanar X-ray. Stapp Car Crash J. 2001;45:337–368. doi: 10.4271/2001-22-0016. [DOI] [PubMed] [Google Scholar]
- Ho J, Kleiven S. Can sulci protect the brain from traumatic injury? J Biomech. 2009;42:2074–2080. doi: 10.1016/j.jbiomech.2009.06.051. [DOI] [PubMed] [Google Scholar]
- Horgan TJ, Gilchrist MD. Influence of FE model variability in predicting brain motion and intracranial pressure changes in head impact simulations. Int J Crashworth. 2004;9:401–418. [Google Scholar]
- Ji S, Zhao W, Li Z, McAllister TW. Head impact accelerations for brain strain-related responses in contact sports: a model-based investigation. Biomech Model Mechanobiol. 2014;13:1121–1136. doi: 10.1007/s10237-014-0562-z. [DOI] [PMC free article] [PubMed] [Google Scholar]
- Ji S, Zhao W, Ford JC, et al. Group-wise evaluation and comparison of white matter fiber strain and maximum principal strainsports-related concussion. Neurotrauma. 2015;32:441–454. doi: 10.1089/neu.2013.3268. [DOI] [PMC free article] [PubMed] [Google Scholar]
- Jiroušek O, Jíra J, Jírová J, Micka M. Finite element model of human skull used for head injury criteria assessment. In: Gilchrist MD, editor. IUTAM symposium on impact biomechanics: from fundamental insights to applications. Springer; Netherlands: 2005. pp. 459–467. [Google Scholar]
- Kangarlou K. Mechanics of blast loading on the head models in the study of traumatic brain injury. Switz Res Park J. 2013;102:1571–1581. [Google Scholar]
- Kenner V, Goldsmith W. Dynamic loading of a fluid-filled spherical shell. Int J Mech Sci. 1972;14:557–568. [Google Scholar]
- Khalil TB, Hubbard RP. Parametric study of head response by finite element modeling. J Biomech. 1977;10:119–132. doi: 10.1016/0021-9290(77)90075-6. [DOI] [PubMed] [Google Scholar]
- Kimpara H, Nakahira Y, Iwamoto M, et al. Investigation of anteroposterior head-neck responses during severe frontal impacts using a brain-spinal cord complex FE model. Stapp Car Crash J. 2006;50:509–544. doi: 10.4271/2006-22-0019. [DOI] [PubMed] [Google Scholar]
- King AI, Yang KH, Zhang L, Hardy W, Viano DC. Proceedings of the IRCOBI conference. Lisbon: 2003. Is head injury caused by linear or angular acceleration? [Google Scholar]
- Kleiven S, Hardy WN. Correlation of an FE model of the human head with local brain motion–consequences for injury prediction. Stapp Car Crash J. 2002;46:123–144. doi: 10.4271/2002-22-0007. [DOI] [PubMed] [Google Scholar]
- Kleiven S, von Holst H. Consequences of head size following trauma to the human head. J Biomech. 2002;35:153–160. doi: 10.1016/s0021-9290(01)00202-0. [DOI] [PubMed] [Google Scholar]
- Lauret C, Hrapko M, van Dommelen JAW, Peters GWM, Wismans JSHM. Optical characterization of acceleration-induced strain fields in inhomogeneous brain slices. Med Eng Phys. 2009;31:392–399. doi: 10.1016/j.medengphy.2008.05.004. [DOI] [PubMed] [Google Scholar]
- Mao H, Zhang L, Jiang B, et al. Development of a finite element human head model partially validated with thirty five experimental cases. J Biomech Eng. 2013;135:111002. doi: 10.1115/1.4025101. [DOI] [PubMed] [Google Scholar]
- Matsumae M, Kikinis R, Morocz IA, et al. Age-related changes in intracranial compartment volumes in normal adults assessed by magnetic resonance imaging. J Neurosurg. 1996;84:982–991. doi: 10.3171/jns.1996.84.6.0982. [DOI] [PubMed] [Google Scholar]
- Mazziotta JC, Toga AW, Evans A, et al. A probabilistic atlas of the human brain: theory and rationale for its development. The international consortium for brain mapping (ICBM) NeuroImage. 1995;2:89–101. doi: 10.1006/nimg.1995.1012. [DOI] [PubMed] [Google Scholar]
- Mazziotta J, Toga A, Evans A, et al. A probabilistic atlas and reference system for the human brain: international consortium for brain mapping (ICBM) Philos Trans R Soc Lond B Biol Sci. 2001;356:1293–1322. doi: 10.1098/rstb.2001.0915. [DOI] [PMC free article] [PubMed] [Google Scholar]
- McAllister TW, Ford JC, Ji S, Beckwith JG, Flashman LA, Paulsen K, Greenwald RM. Maximum principal strain and strain rate associated with concussion diagnosis correlates with changes in corpus callosum white matter indices. Ann Biomed Eng. 2012;40:127–140. doi: 10.1007/s10439-011-0402-6. [DOI] [PMC free article] [PubMed] [Google Scholar]
- Meaney D, Smith D, Ross D, Gennarelli T. Diffuse axonal injury in the miniature pig: biomechanical development and injury threshold. ASME Appl Mech Div-Publ-AMD. 1993;169:169–169. [Google Scholar]
- Meaney DF, Smith DH. Biomechanics of concussion. Clin Sports Med. 2011;30:19–31. doi: 10.1016/j.csm.2010.08.009. [DOI] [PMC free article] [PubMed] [Google Scholar]
- Pfefferbaum A, Mathalon DH, Sullivan EV, Rawles JM, Zipursky RB, Lim KO. A quantitative magnetic resonance imaging study of changes in brain morphology from infancy to late adulthood. Arch Neurol. 1994;51:874–887. doi: 10.1001/archneur.1994.00540210046012. [DOI] [PubMed] [Google Scholar]
- Pinnoji PK, Mahajan P, Bourdet N, Deck C, Willinger R. Impact dynamics of metal foam shells for motorcycle helmets: experiments & numerical modeling. Int J Impact Eng. 2010;37:274–284. [Google Scholar]
- Post A, Oeur A, Walsh E, Hoshizaki B, Gilchrist MD. A centric/non-centric impact protocol and finite element model methodology for the evaluation of American football helmets to evaluate risk of concussion. Comput Methods Biomech Biomed Engin. 2014;17:1785–1800. doi: 10.1080/10255842.2013.766724. [DOI] [PubMed] [Google Scholar]
- Prange MT, Margulies SS. Regional, directional, and age-dependent properties of the brain undergoing large deformation. J Biomech Eng. 2002;124:244–252. doi: 10.1115/1.1449907. [DOI] [PubMed] [Google Scholar]
- Stalnaker RL, Alem NM, Benson JB, Melvin JW. Validation studies for head impact injury model. National Highway Traffic Safety Administration; Washington, DC: 1977. [Google Scholar]
- Takhounts EG, Eppinger RH, Campbell JQ, Tannous RE, Power ED, Shook LS. On the development of the SIMon finite element head model. Stapp Car Crash J. 2003;47:107–133. doi: 10.4271/2003-22-0007. [DOI] [PubMed] [Google Scholar]
- Takhounts EG, Ridella SA, Hasija V, et al. Investigation of traumatic brain injuries using the next generation of simulated injury monitor (SIMon) finite element head model. Stapp Car Crash J. 2008;52:1–31. doi: 10.4271/2008-22-0001. [DOI] [PubMed] [Google Scholar]
- Tinard V, Deck C, Willinger R. New methodology for improvement of helmet performances during impacts with regards to biomechanical criteria. Mater Des. 2012;37:79–88. [Google Scholar]
- Urban JE, Maldjian JA, Whitlow CT, Stitzel JD. A method to investigate the size and shape variation of the lateral ventricles with age. Biomed Sci Instrum. 2012;48:447–453. [PubMed] [Google Scholar]
- Vavalle NA, Jelen BC, Moreno DP, et al. An evaluation of objective rating methods for full-body finite element model comparison to PMHS tests. Traffic Inj Prev. 2013;14:S87–S94. doi: 10.1080/15389588.2013.802777. [DOI] [PubMed] [Google Scholar]
- Willinger R, Kang HS, Diaw B. Three-dimensional human head finite-element model validation against two experimental impacts. Ann Biomed Eng. 1999;27:403–410. doi: 10.1114/1.165. [DOI] [PubMed] [Google Scholar]
- Yu H, Medri M, Zhou Q, et al. Head-neck finite element model of the crash test dummy THOR. Int J Crashworth. 2004;9:175–186. [Google Scholar]
- Zhang L, Yang KH, Dwarampudi R, et al. Recent advances in brain injury research: a new human head model development and validation. Stapp Car Crash J. 2001a;45:369–394. doi: 10.4271/2001-22-0017. [DOI] [PubMed] [Google Scholar]
- Zhang L, Yang KH, King AI. Comparison of brain responses between frontal and lateral impacts by finite element modeling. J Neurotrauma. 2001b;18:21–30. doi: 10.1089/089771501750055749. [DOI] [PubMed] [Google Scholar]
- Zhang J, Green MA, Sinkus R, Bilston LE. Viscoelastic properties of human cerebellum using magnetic resonance elastography. J Biomech. 2011;44:1909–1913. doi: 10.1016/j.jbiomech.2011.04.034. [DOI] [PubMed] [Google Scholar]