Abstract
Medical imaging is of particular interest in the field of translational myology, as extant literature describes the utilization of a wide variety of techniques to non-invasively recapitulate and quantity various internal and external tissue morphologies. In the clinical context, medical imaging remains a vital tool for diagnostics and investigative assessment. This review outlines the results from several investigations on the use of computed tomography (CT) and image analysis techniques to assess muscle conditions and degenerative process due to aging or pathological conditions. Herein, we detail the acquisition of spiral CT images and the use of advanced image analysis tools to characterize muscles in 2D and 3D. Results from these studies recapitulate changes in tissue composition within muscles, as visualized by the association of tissue types to specified Hounsfield Unit (HU) values for fat, loose connective tissue or atrophic muscle, and normal muscle, including fascia and tendon. We show how results from these analyses can be presented as both average HU values and compositions with respect to total muscle volumes, demonstrating the reliability of these tools to monitor, assess and characterize muscle degeneration.
Key Words: Quantitative Computed Tomography, image analysis, advanced muscle assessment, FES
The growing field of translational myology continually seeks to define and promote the generalizability of muscle research to clinical practice via optimizing the transition of a wide variety of investigative muscle assessment modalities. It is thereby crucial for researchers in this complex field to identify, compare, and exploit the relative strengths of extant morphological assessment literature. Medical imaging is of particular interest in this regard, as extant literature focuses on the utilization of a wide variety of techniques to non-invasively recapitulate and quantify various internal and external tissue morphologies. In the clinical context, medical imaging remains a vital tool for diagnostic and investigative assessment. Of the many facets of the field, most current research aims to improve aspects of instrumentation design, image processing software, data acquisition methodology, and computational modeling. Indeed, three-dimensional (3D) visualization of internal anatomy elicits invaluable information for optimizing the treatment of many pathologies, but every modality has its inherent limitations.1,2 For the purposes of clinical assessment, in particular, visually simplistic imaging methods that outline noninvasive, high-resolution methodologies for assessing diseased or damaged tissues have been identified as a strategic priority in clinical research, and extant modalities have been identified as preferential to respective applications.3-11 However, their employment via standard methodology may not be optimal for various avenues of translational myology research. The implementation of traditional imaging modalities, in the context of relevant case studies, can significantly impact this process of methodology optimization. Likewise, discerning the optimum metric for imaging data analysis and defining changes in skeletal muscle remains crucial. Continuing to propose, assess, and modify quantitative methods for muscle imaging assessment in this regard will be pivotal in discerning their utility in serving the complex and challenging field of translational myology, and further optimization of these systems will ultimately aid in the indication of compensatory methods for clinical intervention. This review outlines the use of advanced techniques for computed tomography (CT) image acquisition and assessment, as evidenced by three case studies involving partial and advanced muscle degeneration and denervation.
Muscle Segmentation, Visualization, and Analysis
The discrimination of tissue types, densities, and volumes from 2D and 3D images is of particular interest in the medical imaging research community. The post-processing of 3D CT images via colorization of these morphologies holds particular utility with regards to the segmentation of skeletal muscle. Specific attenuation values are assigned to individual volumetric elements (voxels), based upon the degree to which CT X-rays of given energies transmit through the volume element. The degree of attenuation depends on the energy spectrum of the incident X-rays, as well as the average atomic number of the tissues of the patients. Since most computers utilize hardware that requires integer values, linear attenuation coefficients are rescaled to an integer range that encompasses 4096 values, between -1000 and +3095. This scale is known as the CT number, which may likewise be readily converted to Hounsfield units (HU). Comparatively dense tissues, such as bone, have large attenuation coefficients and thereby large, positive CT numbers; conversely, large, negative CT numbers are typical for low-density tissues, such as lung and adipose tissue.12-22
Muscles are normally displayed with CT number between 50 and 100 Hounsfield units, although within a normal muscle belly, other tissue elements are typically present, such as loose connective tissue and fat, which have much lower CT numbers. If a singular tissue type occupies a particular voxel, that element will possess a readily-identifiable CT number corresponding singularly to that tissue type; however, typical voxels simultaneously contain several tissue types and thereby express an average CT number whose value is proportional to the ratio of the tissue types. This phenomenon explains the wide range of values present within a particular dataset and suggests the necessity for increased voxel resolution and the development of novel intervoxel segmentation methods to optimize the study of muscle structural changes, in particular for 3D Color Muscle CT.23-39.
Muscle Degeneration: Sarcopenia, Neuromuscular Pathology, or Sequela of Trauma
Muscular degeneration is typically characterized by the progressive loss of muscle function and mass, and has been readily identified as an independent risk factor for high mortality in aging populations and patients suffering from neuromuscular pathology or injury.12-18 In aging, this phenomenon is typically defined as sarcopenia, and while its prevalence has been consistently detrimental to an individual’s physical vitality, defining its diagnosis and etiology remains debated8-10. Despite the absence of a universally accepted definition, extant clinical literature commonly correlates sarcopenia with the loss of both skeletal muscle function and structure, and a variety of mechanisms have been implicated to dictate these phenomena. Aging skeletal muscle has significantly diminished myofibril contractility dues to a progressive reduction of the proportion of glycolytic type II muscle fibers.11,12 Additionally, these myofibers elicit a significant reduction in triglyceride processing capability, resulting in excessive lipid droplet storage along myocyte cell membranes.13 In general, the concordant loss of muscle mass and infiltration of non-contractile tissue confers an increased risk for frailty, disability, and eventual mortality.16-18 In an increasingly aging world, it is clear that optimizing extant assessment methodologies and identifying a normative clinical definition for sarcopenia is of growing importance.18 The mechanisms that may govern muscular degeneration in sarcopenia have likewise been indicated within the context of neuromuscular pathology and sequela of trauma. Indeed, the dramatic deleterious changes in muscle exhibited in these patients have been implicated as analogous to the changes evidenced in sarcopenia. This “accelerated aging” of muscle can occur as the result of many chronic diseases or traumatic events, and as such, there exist many clinical definitions that may be potentially obfuscated by their coincidence. For example, as in sarcopenia, skeletal muscle degeneration due to illness, known as cachexia, has been analogously associated with increases in relative muscle adiposity, which has likewise been correlated to increased rates of cachectic patient morbidity and mortality.20-22 However, these phenomena are particularly evident in patients with spinal cord injury (SCI), as paralysis from lower motor neuron denervation drastically reduces skeletal muscle mass and increases local muscle fibrosis and adiposity.19-24 One extreme case of a SCI sequela is irreversible Conus and Cauda Equina syndrome – a condition in which leg muscles may be completely and permanently disconnected from the nervous system.30 When these innervated connections between the spinal cord and the leg muscles are severed, volitional leg muscle contractility disappears downstream from the SCI lesion. Without this contractility, muscle fibers are gradually replaced by loose and fibrous connective tissues – a phenomenon that typically occurs within three to five years post-SCI.
To emphasize the utility of the advanced muscle imaging analysis techniques described herein, this review focuses on reported literature regarding the assessment of muscle degeneration and regeneration, via home-based Functional Electrical Stimulation (h-b FES) of SCI patients.
Monitoring Trophism Decay of LMN-Denervated Muscle and its Restoration by h-b FES Compliance
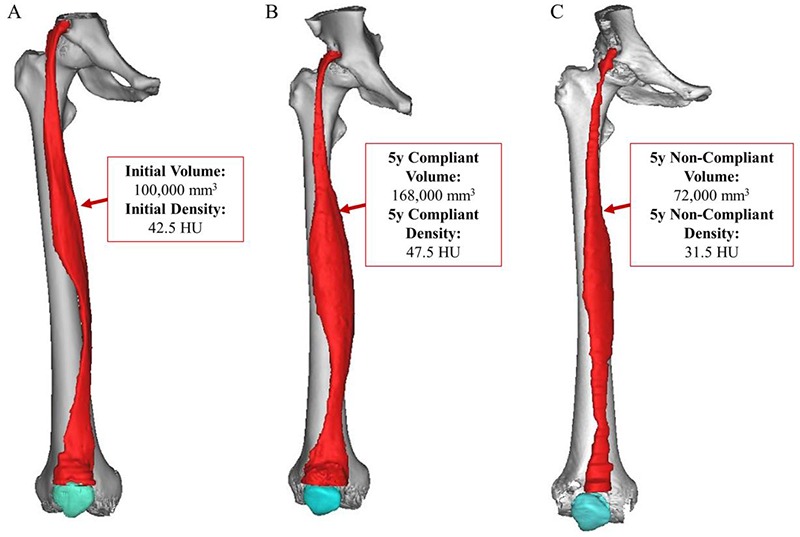
Many of the tissue analyses employed to study structural changes occurring in Lower Motor Neuron (LMN) denervated muscle are usually performed with biopsies – i.e., the analysis of only a few milligrams of muscle. Complementary imaging techniques, such as CT scans, are also employed to assess and validate histological information and to study macroscopic changes. The combinatorial value of CT imaging methods, post-processing techniques, and segmentation can be demonstrated by studying the effect of h-bFES training entire muscle volumes.23,24 An excellent example of such a case study involved the assessment of a patient with irreversible Conus and Cauda Equina syndrome (Patient A) who underwent five years of this stimulation treatment, followed by five years of non-compliance to h-Bfes.21,33 The main novelty introduced in this work was the morphological analysis of the whole quadriceps in different pathological conditions and the quantification of the tissue compositions within the muscle volumes. Figure 2 presents the results for Patient A. The 3D model and voxel assessment of the Rectus femoris shows a clear increase in muscle volume and density during the h-bFES compliant period, and likewise shows a clear decline in these muscle characteristics after five years of non-compliance.
Fig 2.

Patient A – an example of irreversible Conus and Cauda Equina syndrome who underwent five years of compliance with h-b FES treatment, followed by another five years of non-compliance to h-b FES. As is evident above, the 3D volume and density analyses readily identify changes in Rectus femoris volume and density (average HU value) over the timespan of the study.
Utility of 3D Muscle Segmentation in Monitoring Incomplete Denervation from SCI
In the second and third of these reported case studies, analogous soft tissue analyses and segmentation methods were used on CT images of two patients with different degrees of partial denervation. The first of these patients (Patient B), was a female, 53 years. During the last 5 years progressive difficulties of walking with muscle fatigue especially of those involved in ankle flexion-extension (tibialis anterior, peroneals and tricep surae). During recent 3-month hospitalization the patient underwent electric muscle stimulation sessions with Schuhfried Stimulette den2x, by current for denervated muscles at the lodge side of the leg, bilaterally.
Pre-treatment clinical and functional assessment
The patient walks using two sticks. The gait is neuropathic, with foot drop especially on the right side, for deficit of peroneal muscles and dorsiflexors. She has complete autonomy in ADL, but presents difficulties in supine-sitting and sitting-standing position changes, that are possible only with the aid of the upper limbs.
Post-Treatment motor evaluation
The patient walks with two sticks for long distances and without aids for short distances. Waddling gait due to medium and large gluteal muscles deficit and foot drop remains. Remain also other muscular deficits detected in pre-treatment evaluation. Improved resistance to fatigue and balance, both static and dynamic. Improved awareness of the present deficit and strategies for dealing with them. Improved the strength of the upper limbs and abdominal muscles (transversus abdominis, internal oblique, external oblique).34
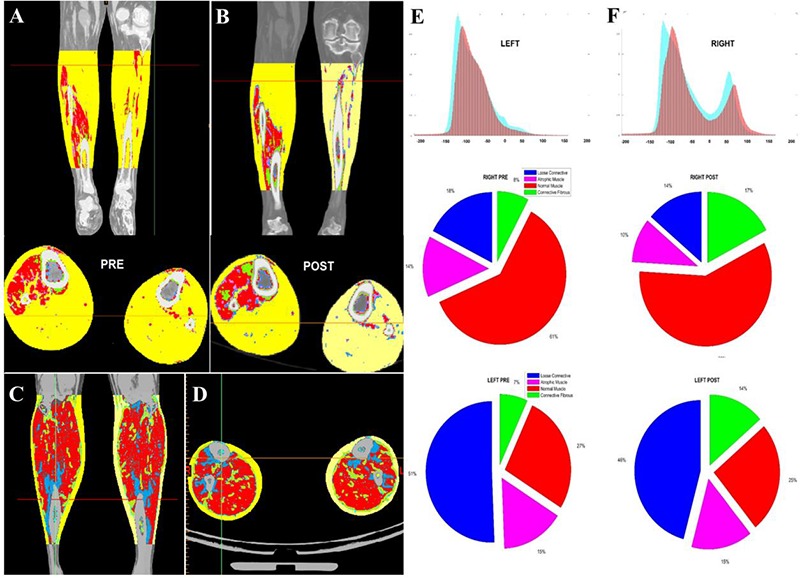
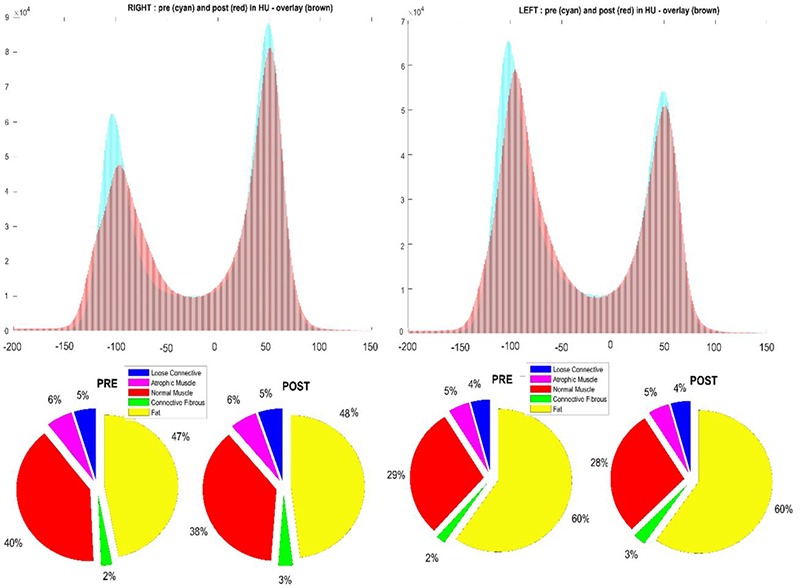
The second study reports the results of Patient C – a 53 year old male patient 15 years post SCI before and after h-bFES.34 Figure 3 depicts the comparison between Patient B’s soft tissues before and after six weeks of h-bFES rehabilitation using the soft tissue segmentation method detailed herein. The subject was treated each day for 30 minutes with electrical stimulation for denervated calf muscles – bilaterally on the anterior and lateral side of the leg. Additionally, the Histograms containing HU distributions show that fat is the dominant tissue type within the volume, especially on the left side where muscle content is almost absent. However, the distribution after the rehabilitation period (red) shows an increase in muscle density and a reduction in fat within the right leg. Furthermore, it is possible to analyze the specific soft tissue compositional changes within these muscles. The pie charts in Figure 3 depict these particular changes; indeed, it is evident that there was an increase of dense connective or fibrous tissue in both legs, to the detriment of loose connective tissue. Figure 4 contains the results from Patient C’s analyses, detailing HU histograms that show, once again, the differences between the left and right sides, both pre and post h-bFES. Analogous segmentation analyses were performed on the middle of the rectus femoris thigh muscles to compare whether there were significant changes in the muscular composition outside of the h-bFES rehabilitation volume. It is evident that there are no remarkable changes between these time points. However, intriguingly, there was a slight shift towards higher density HU values on both legs. Indeed, Patient C’s residual asymmetric innervation of the leg muscles and the effects of six weeks of h-bFES rehabilitation regime allowed the patient to perform short walks without crutches – a monumental improvement in function and quality of life after years of only heavily-supported walking and many daily hours of bed rest.
Fig 3.

3D soft tissue segmentation of Patient B to compare the compositional changes between the calf muscles in both legs (A, before and B, after h-bFES rehabilitation). Note that soft tissue segmentation colorizations are defined thus: subcutaneous fat (yellow HU), Intramuscular fat (orange), low density muscle (cyan), muscle (red) and fibrous connective tissue (gray). E and F depict the HU distributions and changes within both legs (cyan: pre-rehabilitation, red; post-rehabilitation), and the pie charts contain corresponding compositional data changes. It is important to notice the qualitative muscle volume and quality differences between the SCI patient and a healthy subject (C+D).
Fig 4.

HU distribution comparison between left and right legs of Patient C, as assessed at the mid-thigh. Note that compositions in the left and right rectus femoris muscles changed very little in the same time span, which is to be expected due to h-bFES being withheld in this region.
Conclusions and perspectives
The results from these analyses are presented as the average HU values within the muscle reconstruction, as well as the percentage of these tissues with respect to the total muscle volume. The methods outlined for these assessments demonstrate the reliability of these tools to monitor, quantify, and characterize muscle degeneration. 3D CT image segmentation captures the minimal, but clinically significant extent to which muscle may change in size and/or quality in such studies, which was utilized to highlight the importance of rehabilitation trainings for SCI-induced and disuse atrophy. In general, these studies altogether suggest the criticality of continuing to identify and exploit the strengths of imaging modalities the context of muscle research. Further optimization of these methods will be pivotal in discerning their respective utility in serving the complex and challenging field of translational myology.
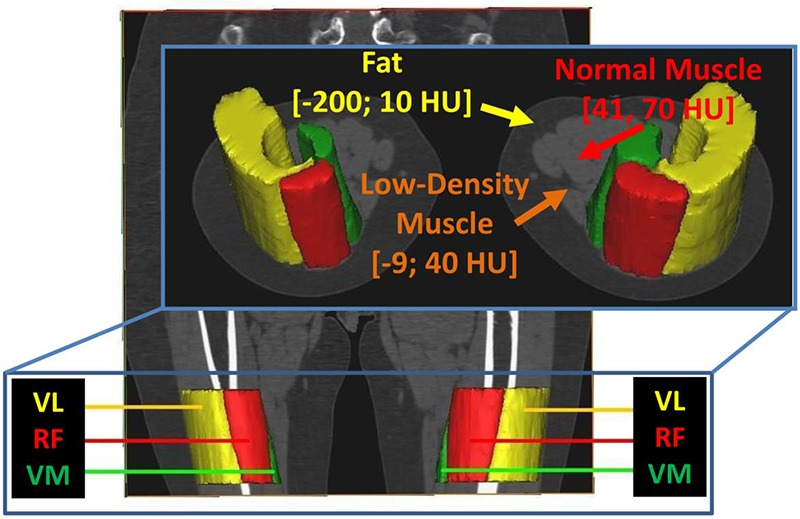
Fig 1.

Example segmentation of the Vastus lateralis, Rectus femoris, and Vastus medialis muscles in a representative subject. Note that soft tissue segmentation thresholds are defined thus: subcutaneous fat (HU -200; -10), Intramuscular fat (HU -200; -10), low density muscle (HU -9; 40), muscle (HU 41; 70) and fibrous connective (HU 71; 150).
Acknowledgment
This research has been supported by the University Hospital Landspitali Scientific fund.
Contributor Information
Kyle Joseph Edmunds, Email: kyle14@ru.is.
Magnus K. Gíslason, Email: mkgislason@ru.is.
Iris D. Arnadottir, Email: irisa10@ru.is.
Andrea Marcante, Email: andrea.marcante@ospedalesancamillo.net.
Francesco Piccione, Email: francesco.piccione@ospedalesancamillo.net.
References
- 1.Agatston AS, Janowitz WR, Hildner FJ, et al. Quantification of coronary artery calcium using ultrafast computed tomography. J Am Coll Cardiol 1990;15:827-32. doi:10.1016/0735-1097(90)90282-T. [DOI] [PubMed] [Google Scholar]
- 2.Ameli-Renani S, Rahman F, Nair A, et al. Dual-energy CT for imaging of pulmonary hypertension: challenges and opportunities. Radiographics 2014;34:1769-90. doi: 10.1148/rg.347130085. [DOI] [PubMed] [Google Scholar]
- 3.Stringari C, Cinquin A, Cinquin O, et al. Phasor approach to fluorescence lifetime microscopy distinguishes different metabolic states of germ cells in a live tissue. Proc Natl Acad Sci USA 2011;108:13582-7. [DOI] [PMC free article] [PubMed] [Google Scholar]
- 4.Kasischke KA, Vishwasrao HD, Fisher PJ, et al. Neural activity triggers neuronal oxidative metabolism followed by astrocytic glycolysis. Science 2004;305(5680):99–103. [DOI] [PubMed] [Google Scholar]
- 5.Skala MC, Riching KM, Gendron-Fitzpatrick A, et al. In vivo multiphoton microscopy of NADH and FAD redox states, fluorescence lifetimes, and cellular morphology in precancerous epithelia. Proc Natl Acad Sci USA 2007;104:19494–19499. Epub 2007 Nov 27. [DOI] [PMC free article] [PubMed] [Google Scholar]
- 6.König K, Uchugonova A, Gorjup E. Multiphoton fluorescence lifetime imaging of 3D-stem cell spheroids during differentiation. Microsc Res Tech 2011;74:9–17. [DOI] [PubMed] [Google Scholar]
- 7.Bird DK, Vrotsos KM, Eliceiri KW, et al. Metabolic mapping of MCF10A human breast cells via multiphoton fluorescence lifetime imaging of the coenzyme NADH. Cancer Res 2005;65:8766-73. [DOI] [PubMed] [Google Scholar]
- 8.Uchugonova A, König K. Two-photon autofluorescence and second-harmonic imaging of adult stem cells. J Biomed Opt 2008;13:054068. doi: 10.1117/1.3002370. [DOI] [PubMed] [Google Scholar]
- 9.Guo HW, Chen CT, Wei YH, et al. Reduced nicotinamide adenine dinucleotide fluorescence lifetime separates human mesenchymal stem cells from differentiated progenies. J Biomed Opt 2008;13:050505. doi: 10.1117/1.2990752. [DOI] [PubMed] [Google Scholar]
- 10.Rice WL, Kaplan DL, Georgakoudi I. Two-photon microscopy for non-invasive, quantitative monitoring of stem cell differentiation. PLoS ONE 2010;5:e10075. doi: 10.1371/journal.pone.0010075. [DOI] [PMC free article] [PubMed] [Google Scholar]
- 11.Kantelhardt SR, Leppert J, Krajewski J, et al. Imaging of brain and brain tumor specimens by time-resolved multiphoton excitation microscopy ex vivo. Neuro-oncol 2007;9:103-12. . Epub 2007 Feb 26. [DOI] [PMC free article] [PubMed] [Google Scholar]
- 12.Metter EJ, Talbot L, Schrager M, Conwit R. Skeletal muscle strength as a predictor of all-cause mortality in healthy men. J Gerontol A Biol Sci Med Sci 2002;57:B359–65. [DOI] [PubMed] [Google Scholar]
- 13.Rantanen T. Muscle strength and body mass index as long-term predictors of mortality in healthy men. J Gerontol 2000;55A:168–73. [DOI] [PubMed] [Google Scholar]
- 14.Newman AB, Kupelian V, Visser M., et al. Strength, but not muscle mass, is associated with mortality in the health, aging and body composition study cohort. J Gerontol A Biol Sci Med Sci 2006;61:72–7. [DOI] [PubMed] [Google Scholar]
- 15.Goodpaster BH, Carlson CL, Visser M, et al. Attenuation of skeletal muscle and strength in the elderly: The Health ABC Study. Journal of Applied Physiology (Bethesda, Md) 2001;1985;90:2157–65. [DOI] [PubMed] [Google Scholar]
- 16.Volpi E, Nazemi R, Fujita S. Muscle tissue changes with aging. Current Opinion in Clinical Nutrition and Metabolic Care 2004;7:405-10. [DOI] [PMC free article] [PubMed] [Google Scholar]
- 17.Lynch GS. Therapies for improving muscle function in neuromuscular disorders. Exercise and Sport Sciences Reviews 2001;29:141–8. [DOI] [PubMed] [Google Scholar]
- 18.Kalyani RR, Corriere M, Ferrucci L. Age-related and disease-related muscle loss: the effect of diabetes, obesity, and other diseases. The Lancet. Diabetes & Endocrinology 2014;2:819–29. [DOI] [PMC free article] [PubMed] [Google Scholar]
- 19.Rossini K, Zanin ME, Carraro U. To stage and quantify regenerative myogenesis in human long-term permanent denervated muscle. Basic Appl Myol 2002;12:277-86. [Google Scholar]
- 20.Kern H, Carraro U, Biral D, et al. Severely atrophic muscle fibers with nuclear clumps survive many years in permanently denervated human muscle. The Open Pathology Journal 2009;3:106-10. [Google Scholar]
- 21.Kern H, Boncompagni S, Rossini K, et al. Long-term denervation in humans causes degeneration of both contractile and excitation-contraction coupling apparatus that can be reversed by functional electrical stimulation (FES). A role for myofiber regeneration? J Neuropath Exp Neurol 2004;63:919-31. [DOI] [PubMed] [Google Scholar]
- 22.Boncompagni S, Kern H, Rossini K, et al. Structural differentiation of skeletal muscle fibers in the absence of innervation in humans. Proc Natl Acad Sci U S A 2007;104:19339-44. [DOI] [PMC free article] [PubMed] [Google Scholar]
- 23.Kern H, Carraro U, Adami N, et al. Home-based Functional Electrical Stimulation (h-bFES) recovers permanently denervated muscles in paraplegic patients with complete lower motor neuron lesion. Neurorehab Neur Rep 2010;24:709-21. [DOI] [PubMed] [Google Scholar]
- 24.Kern H, Carraro U. Home-based Functional Electrical Stimulation (h-b FES) for long-term denervated human muscle: History, basics, results and perspectives of the Vienna Rehabilitation Strategy. Eur J Transl Myol – Basic Appl Myol 2014;24:27-40. [DOI] [PMC free article] [PubMed] [Google Scholar]
- 25.Borisov AB, Dedkov EI, Carlson BM. Interrelations of myogenic response, progressive atrophy of muscle fibers, and cell death in denervated skeletal muscle. Anat Rec 2001;264:203–18. [DOI] [PubMed] [Google Scholar]
- 26.Cohen S, Nathan JA, Goldberg AL. Muscle wasting in disease: molecular mechanisms and promising therapies. Nature Reviews Drug Discovery 2014;14,58–74. [DOI] [PubMed] [Google Scholar]
- 27.Evans WJ. Skeletal muscle loss: Cachexia, sarcopenia, and inactivity. Am J Clin Nutr 2010;91,1123–7. [DOI] [PubMed] [Google Scholar]
- 28.Puthucheary Z, Hart N. Skeletal muscle mass and mortality – but what about functional outcome? Critical Care (London, England) 2014;18:110. [DOI] [PMC free article] [PubMed] [Google Scholar]
- 29.Helgason T, Gargiulo P, Johannesdotir F, et al. Monitoring muscle growth and tissue changes induced by electrical stimulation of denervated degenerated muscles with CT and stereolithographic 3D modeling. Artif Organs 2005;29:440-3. [DOI] [PubMed] [Google Scholar]
- 30.Gargiulo P, Helgason T, Ingvarsson P, et al. Morphological changes in denervated muscle treated with FES. Basic Appl Myol 2007;17:133-6. [Google Scholar]
- 31.Gargiulo P, Vatnsdal B, Ingvarsson P, et al. Restoration of muscle volume and shape induced by electrical stimulation of denervated degenerated muscles: qualitative and quantitative measurement of changes in rectus femoris using computer tomography and image segmentation. Artif Organs 2008;32:609-13. [DOI] [PubMed] [Google Scholar]
- 32.Gargiulo P, Carraro U, Mandl T, et al. Anthropometry of human muscle using segmentation techniques and 3D modelling: applications to lower motor neuron denervated muscle in Spinal Cord Injury. In Handbook of Anthropometry 2012. (pp. 323-354). Springer; New York. [Google Scholar]
- 33.Gargiulo P, Vatnsdal B, Ingvarsson P, et al. Computational methods to analyse tissue composition and structural changes in denervated muscle undergoing therapeutic electrical stimulation. Basic Appl Myol/ Eur J Transl Myol 2009;19:157-62. [Google Scholar]
- 34.Gargiulo P, Kern H, Carraro U, et al. Quantitative colour 3D CT imaging of human long-term denervated muscle. Progression to fibrosis of perimysium and a case report of FES recovery. Neurol Res 2010;32:13-9. [DOI] [PubMed] [Google Scholar]
- 35.Gargiulo P. 3D Modelling and monitoring of denervated muscle under Functional Electrical Stimulation treatment and associated bone structural change. Eur J Transl Myol – Basic Appl Myol 2011;21:31-94. [Google Scholar]
- 36.Carraro U, Boncompagni S, Gobbo V, et al. Marcante, Persistent muscle fiber regeneration in long term denervation. Past, present, future. Eur J Transl Myol – Basic Appl Myol 2015;25:77-92. [DOI] [PMC free article] [PubMed] [Google Scholar]
- 37.Edmunds KJ, Hermannsson Þ, Barbato M, et al. XIV Mediterranean Conference on Medical and Biological Engineering and Computing 2016: MEDICON. 2016, March 31st--April 2nd 2016, Paphos, Cyprus, Kyriacou E., Christofides S., Pattichis C.S. (Eds.) Springer International Publishing, Cham, 2016. 703-708. doi:10.1007/978-3-319-32703-7_135. [Google Scholar]
- 38.Pétursson Þ, Edmunds KJ, Gíslason MK, et al. Bone Mineral Density and Fracture Risk Assessment to Optimize Prosthesis Selection in Total Hip Replacement. Comput Math Methods Med 2015;2015:162481. [DOI] [PMC free article] [PubMed] [Google Scholar]
- 39.Carraro U, Edmunds KJ, Gargiulo P. 3D False Color Computed Tomography for Diagnosis and Follow-Up of Permanent Denervated Human Muscles Submitted to Home-Based Functional Electrical Stimulation. Eur J Transl Myol 2015;25:5133. [DOI] [PMC free article] [PubMed] [Google Scholar]


