In normal lamellar layers of the meniscus, thickness is highly and positively correlated with surface indentation stiffness.
Abstract
Purpose
To determine the relationship between lamellar layer thickness on ultrashort echo time (UTE) magnetic resonance (MR) images and indentation stiffness of human menisci and to compare quantitative MR imaging values between two groups with normal and abnormally thick lamellar layers.
Materials and Methods
This was a HIPAA-compliant, institutional review board–approved study. Nine meniscal pieces were obtained from seven donors without gross meniscal pathologic results (mean age, 57.4 years ± 14.5 [standard deviation]). UTE MR imaging and T2, UTE T2*, and UTE T1ρ mapping were performed. The presence of abnormal lamellar layer thickening was determined and thicknesses were measured. Indentation testing was performed. Correlation between the thickness and indentation stiffness was assessed, and mean quantitative MR imaging values were compared between the groups.
Results
Thirteen normal lamellar layers had mean thickness of 232 μm ± 85 and indentation peak force of 1.37 g ± 0.87. Four abnormally thick lamellar layers showed mean thickness of 353.14 μm ± 98.36 and peak force 0.72 g ± 0.31. In most cases, normal thicknesses showed highly positive correlation with the indentation peak force (r = 0.493–0.912; P < .001 to .05). However, the thickness in two abnormal lamellar layers showed highly negative correlation (r = −0.90, P < .001; and r = −0.23, P = .042) and no significant correlation in the others. T2, UTE T2*, and UTE T1ρ values in abnormally thick lamellar layers were increased compared with values in normal lamellar layers, although only the UTE T2* value showed significant difference (P = .010).
Conclusion
Variation of lamellar layer thickness in normal human menisci was evident on two-dimensional UTE images. In normal lamellar layers, thickness is highly and positively correlated with surface indentation stiffness. UTE T2* values may be used to differentiate between normal and abnormally thickened lamellar layers.
© RSNA, 2016
Introduction
The meniscus is a crucial structure that preserves articular cartilage integrity in the knee and contributes to healthy knee function (1–3). Given the important roles of the menisci, it is not surprising that torn menisci and/or surgical removal of the menisci are well known to result in early articular cartilage damage, and, eventually, early osteoarthritis. Early detection of subclinical meniscal abnormalities with the development and implementation of strategies to protect against progression to meniscal tear would be a valuable initial step for prevention of knee osteoarthritis, one of the most important burdens in the current health care system.
The healthy menisci are considered to be tissues that have short T2 (T2 values around 4 msec), which makes them “invisible” (ie, they have low signal intensity on conventional magnetic resonance [MR] images). However, the advent of ultrashort echo time (UTE) MR imaging enabled the selective imaging of tissues with short T2, which allows for acquisition of signal from these tissues and further provides high spatial and contrast resolution. This combination of imaging features allowed the anatomic structure of the menisci to be viewed in a noninvasive fashion (4–8). Additionally, quantitative MR imaging relaxation measurements have been used to interrogate changes in collagen matrix and water content and early proteoglycan depletion, including T2 and T2*, and T1ρ (6,9). When acquired with a UTE sequence, these techniques can be applied to tissues with short T2, such as the menisci (9–13).
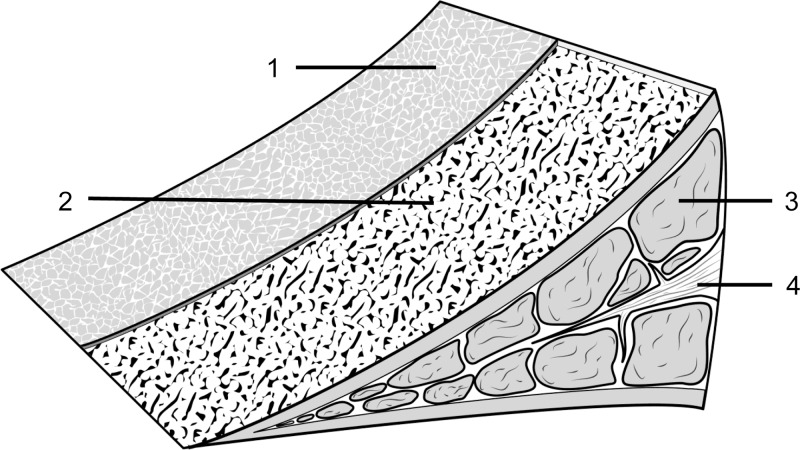
Electron microscopy imaging studies (14) revealed three distinct layers in meniscal cross section (Fig 1): a superficial network that covers the femoral and tibial surfaces by a meshwork of very thin fibrils (30 nm); a lamellar layer beneath the superficial network, represented by a layer of lamellae of collagen fibrils (150–200 μm); and a central main portion, composed of predominantly circular-oriented bundles of collagen fibrils with occasional radial-tie fibers (15). By using UTE MR images, the anatomic structure of the menisci, including the lamellar layers and radial-tie fibers, were made visible (4). Because, to our knowledge, this degree of structural characterization is not possible by using conventional MR imaging, variations in structure can be explored by emphasizing potential clinical importance. Furthermore, little information is currently available regarding the relationship between lamellar layer thickness and local biomechanical properties in the human meniscus. Clearly, the lamellar layer becomes of paramount importance in the MR and arthroscopic diagnostic criteria of meniscal tearing because this layer must be violated in the setting of a tear.
Figure 1:
Drawing of the microanatomy of the meniscus. 1, A superficial network; 2, a lamellar layer beneath the superficial network; 3, predominantly circular-oriented bundles of collagen fibrils; and 4, radial-tie fibers.
We hypothesize that (a) the thickness of normal lamellar layer positively correlates with the biomechanical stiffness or the resistance to the compressive load and (b) an abnormally thickened lamellar layer will show changes in previously established multiparametric quantitative MR imaging relaxation measurements (T2, UTE T2*, and UTE T1ρ) compared with the values in normal lamellar layers. The purpose of our study was to determine the relationship between lamellar layer thickness on UTE MR images and indentation stiffness of human menisci and to compare T2, UTE T2*, and UTE T1ρ values between two groups with normal and abnormally thick lamellar layers.
Materials and Methods
Our Health Insurance Portability and Accountability Act–compliant cadaveric study was exempted by the institutional review board, and informed consent was not required. Our study was performed between July 2012 and June 2014.
Specimen Preparation
Nine menisci were removed from eight fresh-frozen cadaveric human knees (five men, two women; mean age, 57.4 years ± 14.5 [standard deviation], and two samples with unknown age and sex) without gross meniscal tear and were included. Seven menisci were not included because of grossly visible meniscal tears. They were cut in a sagittal manner into 5-mm-thick triangular pieces.
MR Imaging
MR hardware.—A 3-T MR imager (Signa HDx; GE Healthcare, Milwaukee, Wis) with gradient capabilities of 150 (T · m−1)/sec slew rate and 40 mT/m amplitude on each axis was used in conjunction with a home-built 1.5-cm solenoid transmit-receiver coil. The tissue samples were placed in a plastic sample container filled with perfluorooctyl bromide solution (Solvay America, Houston, Tex) to minimize susceptibility artifacts from air-tissue interface during MR imaging, which was performed at room temperature (16). The container was positioned inside the solenoid coil where the main circumferential collagen fibers of the meniscus were oriented perpendicular to B0 to minimize so-called magic angle effects. All the images were acquired in the coronal plane.
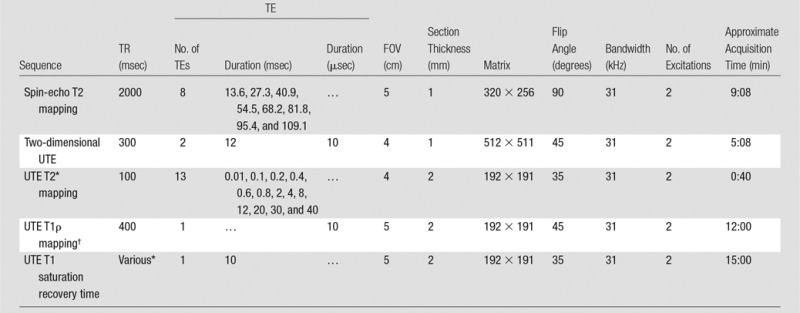
MR pulse sequences.—The two-dimensional UTE sequence used half-pulse radiofrequency excitation together with radial ramp sampling and fast transmit and receive switching to allow a minimal nominal echo time (TE) of 8 μsec (5,9,17–19). The approach to measurement of T2* was similar to the conventional strategy of varying the TE while keeping the repetition time (TR) constant. T1ρ of the meniscus was measured with spin-lock–prepared UTE T1ρ acquisitions at progressively increasing spin-locking times (5). T1, which was required to calculate T1ρ, was measured for each meniscus sample with a saturation recovery sequence by using a short hard 90° pulse followed by a UTE acquisition with a series of saturation recovery times (10,17). T2 of the meniscus was measured with a conventional Carr-Purcell-Meiboon-Gill spin-echo sequence. Typical acquisition parameters are summarized in Table 1.
Table 1.
MR Imaging Sequence Parameters
Note.—FOV = field of view.
*10, 20, 50, 100, 200, 400, 800, and 1200 msec.
†Spin-locking times (saturation recovery times) = 0.02, 2, 5, 10, and 20 msec.
Indentation Stiffness Assessment
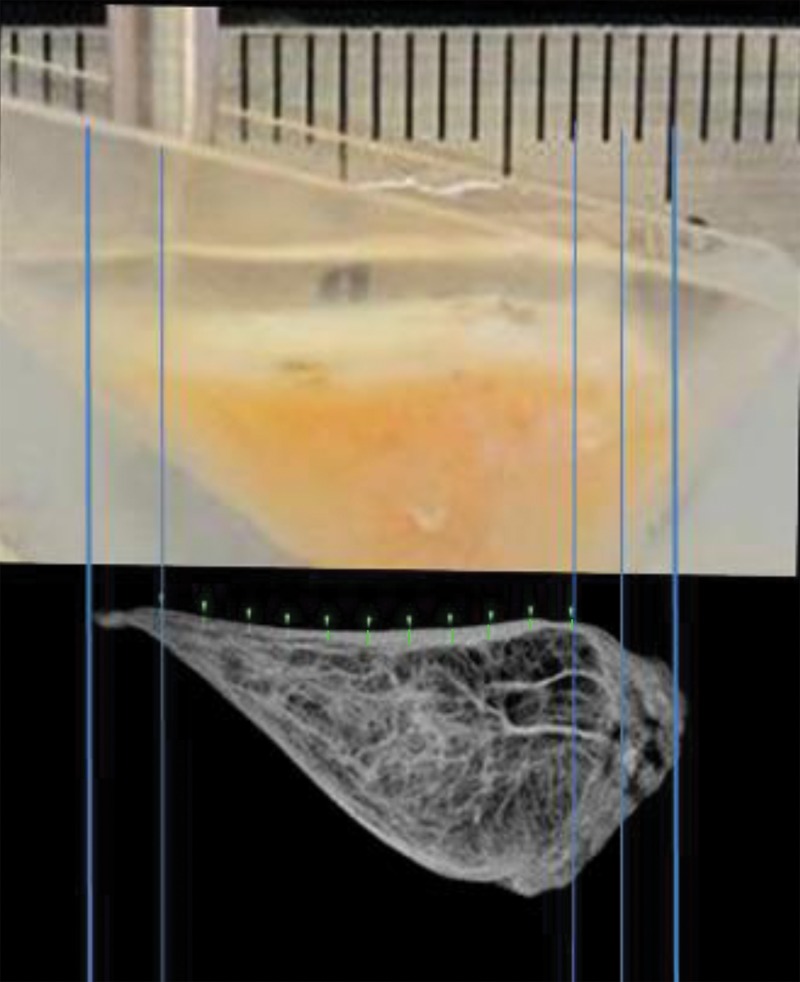
Indentation stiffness testing was performed by using a biomechanical testing system (MACH-1; Biomomentum, Quebec, Canada). The samples were placed into a custom mold that served to inhibit sample movement and lateral expansion and to hydrate during indentation testing. The samples were positioned so that either femoral or tibial surface faced up, to expose an articular surface for indentation measurement. A 1.0-mm diameter plane-ended cylinder indenter (Fig 2) was positioned orthogonal to lamellar surface, and it was lowered down until it touched the sample by using a load threshold criteria of 0.1 g. Indentation protocol consisted of 100-μm compressive displacement over 1 second, a hold for 1 second, then release at the same rate. The peak force (in grams) was determined from measured force-time data. Indentation was performed at multiple sites 1.0-mm apart along the entire length of the sample surface. Photographs were taken and compared with MR images to spatially register indentation sites to location of lamellar thickness measurement.
Figure 2:
Photograph taken for registration during indentation testing. On the basis of the photograph, for each site the stiffness was measured and is marked on UTE MR image (TR [msec]/TE [μsec–msec], 300/10–12) by one-to-one correspondence. The thickness (in micrometers) was measured by using software (Osirix version 5.6; Pixmeo, Geneva, Switzerland).
MR Image Analysis
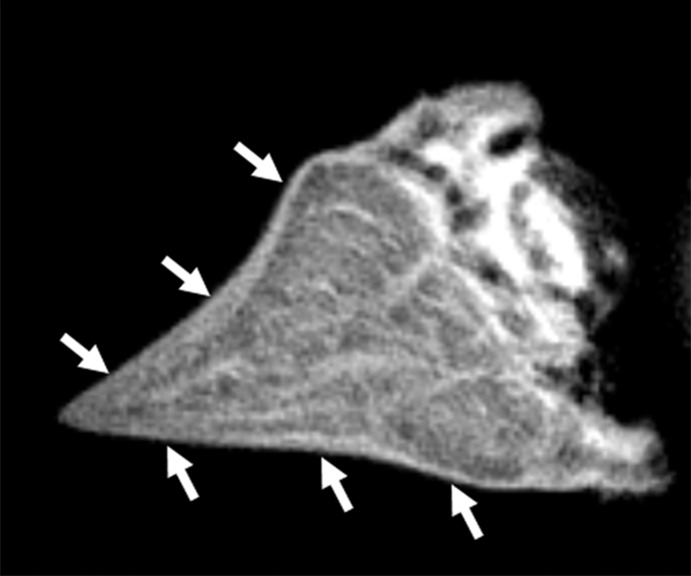
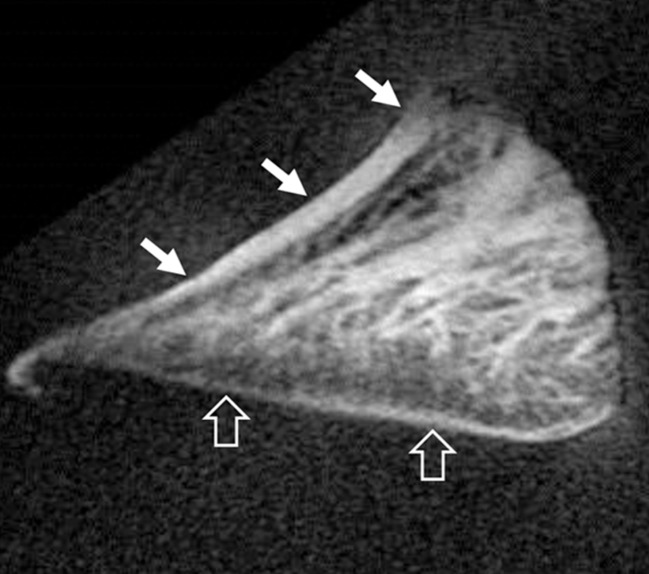
Morphologic assessment.—The images of all samples obtained with all pulse sequences were reviewed in consensus by two board-certified radiologists (J.Y.C. and M.I., with 11 and 1 years of experience of musculoskeletal radiology, respectively). Samples were divided into two groups: the normal lamellar layer group and abnormally thickened lamellar layer group according to MR findings on UTE images. Normal lamellar layer was defined as a linear or mild crescent-shaped thickening pattern of the lamellar layer with smooth tapering both inward and outward (Fig 3a), and abnormally thickened lamellar layer was defined as a localized thickening of the lamellar layer with uneven articular surface or abrupt transition and without normal smooth tapering pattern (Fig 3b). A total of 17 lamellar layers including 13 normal and four abnormally thick layers were analyzed. One femoral surface with marked susceptibility artifacts was excluded. There was no other gross abnormality such as tear, signal intensity, or morphologic alteration in other meniscal structures including deep circumferential fibers and radial-tie fibers in all samples except one, which showed localized hyperintensity in the central main portion on UTE MR images.
Figure 3a:
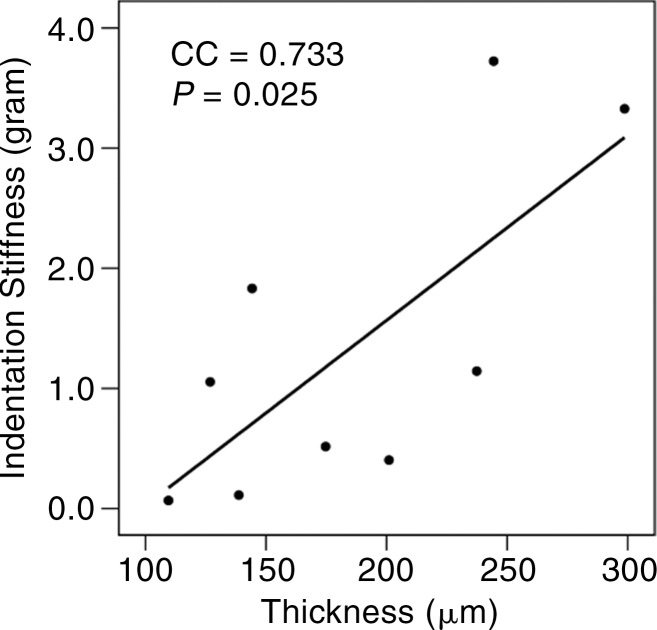
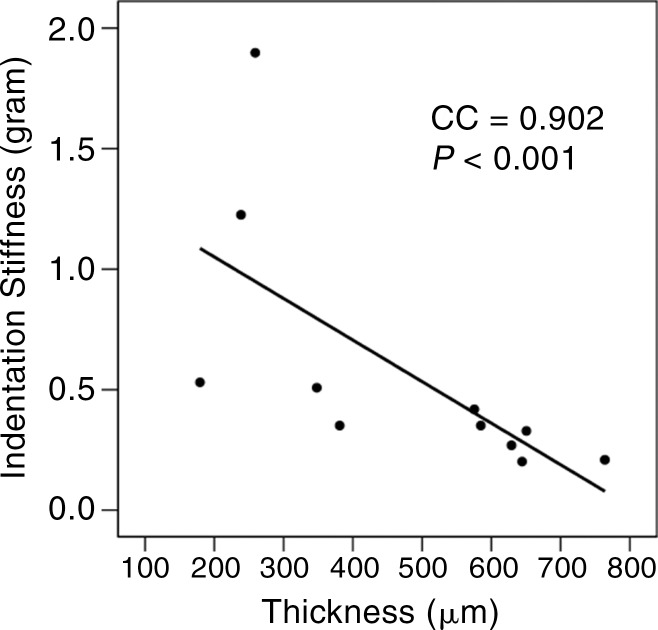
Representative UTE MR images of (a) normal lamellar layer and (b) abnormally thick one and corresponding graphic relationship between the lamellar layer thickness and indentation stiffness in (c) normal lamellar layer and (d) an abnormally thick one, respectively. (a) MR image (TR msec/TE μsec , 300/10): Normal lamellar layers (arrows) are seen as crescent-shaped hyperintense lines with smooth tapering. (b) MR image (TR msec/TR msec, 300/12): Abnormally thick lamellar layer on the femoral surface shows marked thickening of the layer with loss of normal tapering (solid arrows). Note the normal thin linear lamellar layer on the tibial surface (open arrows). (c) Normal lamellar layer shows highly positive correlation between lamellar layer thickness and indentation peak force with one-to-one correlation at each site on femoral surface. (d) Abnormally thick lamellar layer reveals highly negative correlation between lamellar layer thickness and indentation peak force. CC = correlation coefficient.
Figure 3b:
Representative UTE MR images of (a) normal lamellar layer and (b) abnormally thick one and corresponding graphic relationship between the lamellar layer thickness and indentation stiffness in (c) normal lamellar layer and (d) an abnormally thick one, respectively. (a) MR image (TR msec/TE μsec , 300/10): Normal lamellar layers (arrows) are seen as crescent-shaped hyperintense lines with smooth tapering. (b) MR image (TR msec/TR msec, 300/12): Abnormally thick lamellar layer on the femoral surface shows marked thickening of the layer with loss of normal tapering (solid arrows). Note the normal thin linear lamellar layer on the tibial surface (open arrows). (c) Normal lamellar layer shows highly positive correlation between lamellar layer thickness and indentation peak force with one-to-one correlation at each site on femoral surface. (d) Abnormally thick lamellar layer reveals highly negative correlation between lamellar layer thickness and indentation peak force. CC = correlation coefficient.
Thickness of the lamellar layer.—Lamellar layer thicknesses were measured at sites that were one-to-one correspondence with the sites at which indentation stiffness testing was performed by using the open-source software (Osirix) (Fig 2). Measurements for all samples were performed independently by two radiologists.
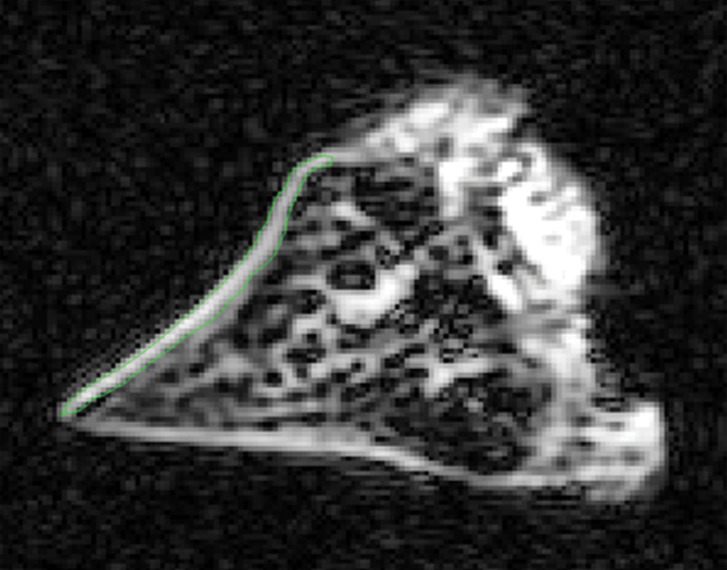
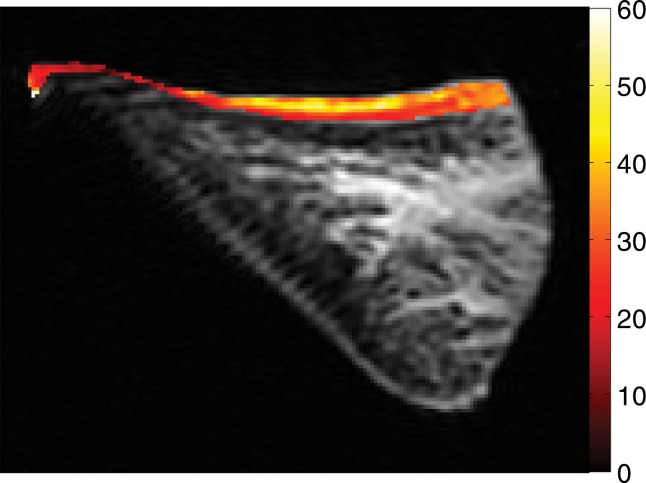
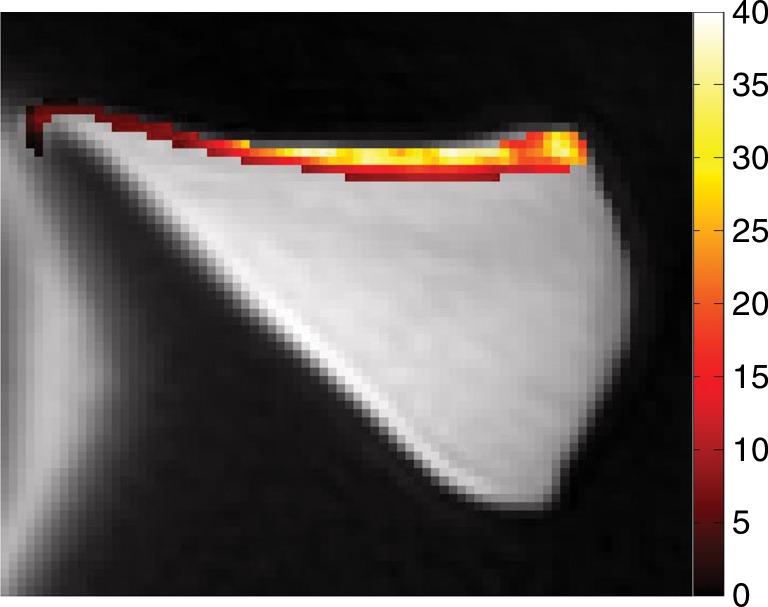
Spin-echo T2, UTE T2*, and UTE T1ρ measurements.—On the images obtained with the Carr-Purcell-Meiboon-Gill and UTE sequences, regions of interest were placed on whole lamellar layer on each surface to determine spin-echo T2, UTE T2*, and UTE T1ρ values. Regions of interest were drawn freehand along the border of the entire lamellar layer (Fig 4a). T2*, T1, and T1ρ values were obtained by using a Levenberg-Marquardt fitting algorithm developed in-house on the basis of equations previously described (5). The analysis algorithms were written by using software (Matlab version 7.9; Mathworks, Natick, Mass) and were executed offline. The program allowed placement of regions of interest on the first image of the series that were then copied to the corresponding position on each of the subsequent images. The mean intensity within each of the regions of interest was used for subsequent curve fitting.
Figure 4a:
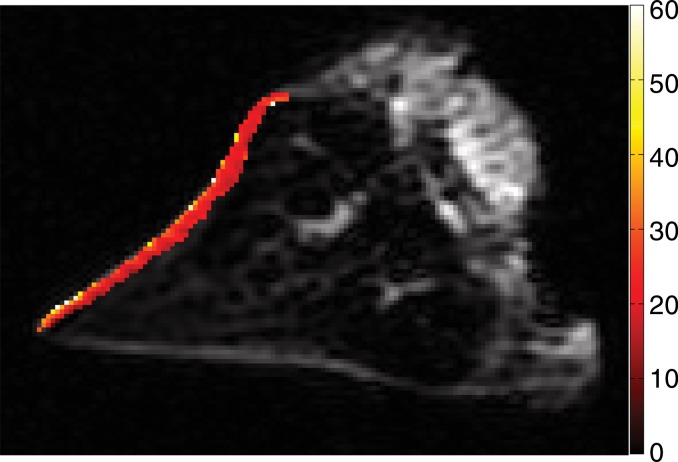
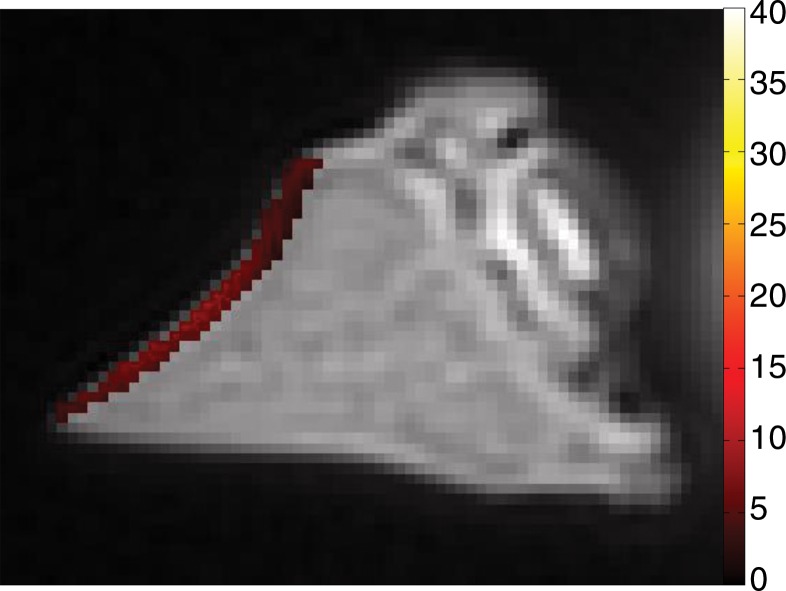
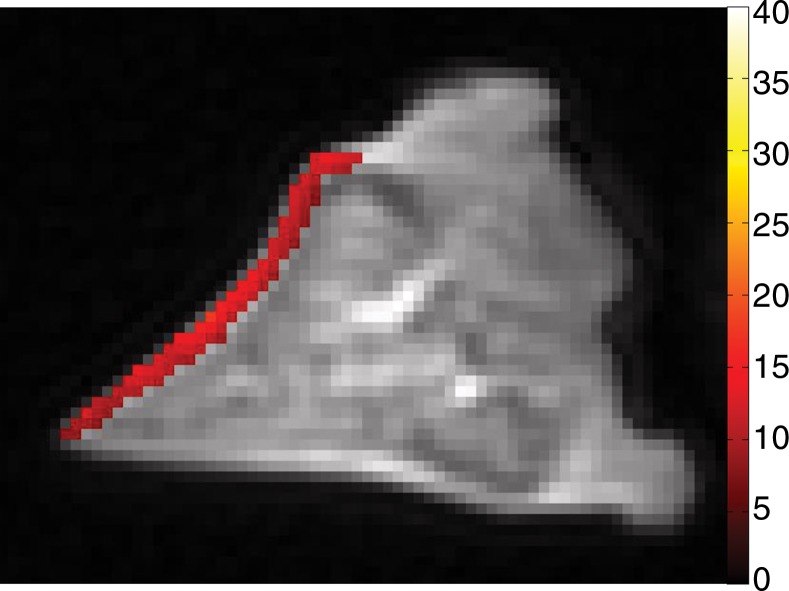
Representative MR images show meniscus with (a–d) normal lamellar layer and with (e–g) abnormally thick lamellar layer. (a) Placement of region of interest by freehand drawing. Corresponding spin-echo T2 (in milliseconds) (b, e), UTE T2* (in milliseconds) (c, f), and UTE T1ρ (in milliseconds) (d, g) overlay color maps apparently demonstrate differences in the lamellar layer matrix between the two groups. The spin-echo T2, UTE T2*, and UTE T1ρ values are generally higher in the abnormal surfaces compared with the values in the normal surfaces.
Figure 4b:
Representative MR images show meniscus with (a–d) normal lamellar layer and with (e–g) abnormally thick lamellar layer. (a) Placement of region of interest by freehand drawing. Corresponding spin-echo T2 (in milliseconds) (b, e), UTE T2* (in milliseconds) (c, f), and UTE T1ρ (in milliseconds) (d, g) overlay color maps apparently demonstrate differences in the lamellar layer matrix between the two groups. The spin-echo T2, UTE T2*, and UTE T1ρ values are generally higher in the abnormal surfaces compared with the values in the normal surfaces.
Figure 4c:
Representative MR images show meniscus with (a–d) normal lamellar layer and with (e–g) abnormally thick lamellar layer. (a) Placement of region of interest by freehand drawing. Corresponding spin-echo T2 (in milliseconds) (b, e), UTE T2* (in milliseconds) (c, f), and UTE T1ρ (in milliseconds) (d, g) overlay color maps apparently demonstrate differences in the lamellar layer matrix between the two groups. The spin-echo T2, UTE T2*, and UTE T1ρ values are generally higher in the abnormal surfaces compared with the values in the normal surfaces.
Figure 4d:
Representative MR images show meniscus with (a–d) normal lamellar layer and with (e–g) abnormally thick lamellar layer. (a) Placement of region of interest by freehand drawing. Corresponding spin-echo T2 (in milliseconds) (b, e), UTE T2* (in milliseconds) (c, f), and UTE T1ρ (in milliseconds) (d, g) overlay color maps apparently demonstrate differences in the lamellar layer matrix between the two groups. The spin-echo T2, UTE T2*, and UTE T1ρ values are generally higher in the abnormal surfaces compared with the values in the normal surfaces.
Figure 4e:
Representative MR images show meniscus with (a–d) normal lamellar layer and with (e–g) abnormally thick lamellar layer. (a) Placement of region of interest by freehand drawing. Corresponding spin-echo T2 (in milliseconds) (b, e), UTE T2* (in milliseconds) (c, f), and UTE T1ρ (in milliseconds) (d, g) overlay color maps apparently demonstrate differences in the lamellar layer matrix between the two groups. The spin-echo T2, UTE T2*, and UTE T1ρ values are generally higher in the abnormal surfaces compared with the values in the normal surfaces.
Figure 4f:
Representative MR images show meniscus with (a–d) normal lamellar layer and with (e–g) abnormally thick lamellar layer. (a) Placement of region of interest by freehand drawing. Corresponding spin-echo T2 (in milliseconds) (b, e), UTE T2* (in milliseconds) (c, f), and UTE T1ρ (in milliseconds) (d, g) overlay color maps apparently demonstrate differences in the lamellar layer matrix between the two groups. The spin-echo T2, UTE T2*, and UTE T1ρ values are generally higher in the abnormal surfaces compared with the values in the normal surfaces.
Statistical Analyses
Interobserver reliability for measurement of lamellar layer thicknesses between two radiologists was examined by using an intraclass correlation coefficient. For each surface, correlation analyses between the thicknesses of the lamellar layer and the peak forces from indentation test were determined by using the Spearman correlation analysis. The mean quantitative MR values (spin-echo T2, UTE T2*, and UTE T1ρ) and indentation peak forces were compared between normal and abnormal samples by using Mann-Whitney test. Nonparametric tests were used because of a relatively small number of samples. All the statistical analyses were performed with software (SPSS version 18.0; SPSS, Chicago, Ill). For all tests, P values less than .05 were considered to indicate statistical significance.
Results
Comparison of Mean Values of Normal and Abnormal Samples
Interobserver reliability for measurement of the lamellar layer thicknesses was excellent (intraclass correlation coefficient, 0.942) between two radiologists. Thirteen normal lamellar layers had a mean thickness of 232 μm ± 86 (range, 78–582 μm) and mean indentation peak force of 1.37 g ± 0.87 (range, 0.07–4.93 g); for four femoral lamellar layers, mean thickness was 278 μm ± 98 (range, 109–425 μm) and mean peak force was 1.30 g ± 0.92 (range, 0.11–3.72 g); and for nine tibial lamellar layers, mean thickness was 210 μm ± 75 (range, 132–582 μm) and mean peak force was 1.40 g ± 0.90 (range, 0.10–4.93 g). There was no significant difference in the thickness and peak force between femoral and tibial surfaces. Four abnormally thickened lamellar layers showed mean thickness of 353 μm ± 98 (range, 110–735 μm) and mean peak force of 0.72 g ± 0.31 (range, 0.14–2.08 g). The mean peak force tended to be lower in the abnormal surfaces (P = .100) but the difference was not statistically significant.
The mean spin-echo T2, UTE T2*, and UTE T1ρ values of normal lamellar layers were 23.99 msec ± 11.98, 4.93 msec ± 2.17, and 9.75 msec ± 2.43, respectively, whereas those of abnormally thickened lamellar layers were higher, as follows: 47.20 msec ± 35.15, 12.66 msec ± 7.42, and 22.61 msec ± 19.43, respectively (Fig 4). In particular, UTE T2* values were significantly higher (P = .010) in the abnormal surfaces, while the other values were not.
Correlation between Lamellar Layer Thickness and Indentation Stiffness
In normal surfaces, lamellar layer thicknesses correlated positively with the indentation peak force (Spearman ρ = 0.493–0.912; all P < .05 except two layers with P = .094 and P = .090) (Table 2; Fig 3c). However, in abnormal surfaces, the lamellar layer thickness showed significant negative correlation in some (Fig 3d), and no significant correlation in the others.
Table 2.
Correlation Analysis between Lamellar Layer Thickness and Indentation Stiffness
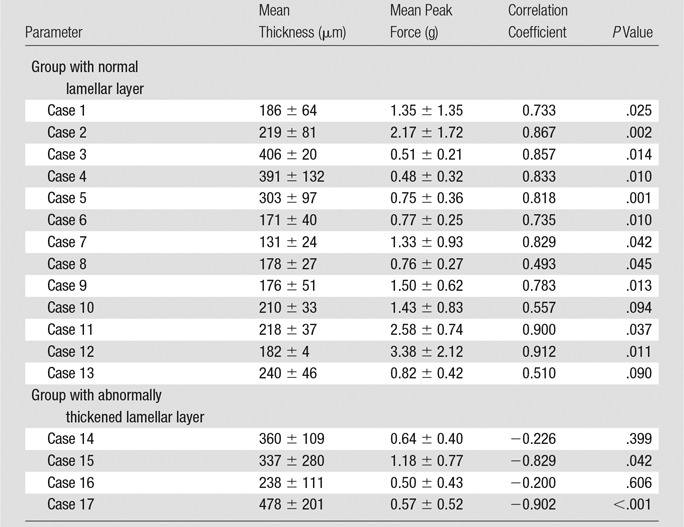
Note.—Data are means ± standard deviation unless otherwise indicated.
Figure 3c:
Representative UTE MR images of (a) normal lamellar layer and (b) abnormally thick one and corresponding graphic relationship between the lamellar layer thickness and indentation stiffness in (c) normal lamellar layer and (d) an abnormally thick one, respectively. (a) MR image (TR msec/TE μsec , 300/10): Normal lamellar layers (arrows) are seen as crescent-shaped hyperintense lines with smooth tapering. (b) MR image (TR msec/TR msec, 300/12): Abnormally thick lamellar layer on the femoral surface shows marked thickening of the layer with loss of normal tapering (solid arrows). Note the normal thin linear lamellar layer on the tibial surface (open arrows). (c) Normal lamellar layer shows highly positive correlation between lamellar layer thickness and indentation peak force with one-to-one correlation at each site on femoral surface. (d) Abnormally thick lamellar layer reveals highly negative correlation between lamellar layer thickness and indentation peak force. CC = correlation coefficient.
Figure 3d:
Representative UTE MR images of (a) normal lamellar layer and (b) abnormally thick one and corresponding graphic relationship between the lamellar layer thickness and indentation stiffness in (c) normal lamellar layer and (d) an abnormally thick one, respectively. (a) MR image (TR msec/TE μsec , 300/10): Normal lamellar layers (arrows) are seen as crescent-shaped hyperintense lines with smooth tapering. (b) MR image (TR msec/TR msec, 300/12): Abnormally thick lamellar layer on the femoral surface shows marked thickening of the layer with loss of normal tapering (solid arrows). Note the normal thin linear lamellar layer on the tibial surface (open arrows). (c) Normal lamellar layer shows highly positive correlation between lamellar layer thickness and indentation peak force with one-to-one correlation at each site on femoral surface. (d) Abnormally thick lamellar layer reveals highly negative correlation between lamellar layer thickness and indentation peak force. CC = correlation coefficient.
Discussion
The lamellar, circumferential, and radial fibers form a complex architectural network within the meniscus that help to withstand the varied forces (eg, shear, tension, and compression) to which it is exposed. The lamellar layer is known to serve as an envelope for the circumferentially oriented fiber bundles in the central main portion of the meniscus (20) and be well suited to facilitate surface to surface motion (21).
The results of our study indicated a substantial positive correlation between the lamellar layer thickness and indentation peak force in the normal lamellar layer of the knee meniscus, and a significant difference in UTE T2* values between the two groups with normal and abnormally thick lamellar layers. Our results strongly support our proposed hypotheses.
Our results suggest that normal lamellar layer plays a considerable role in the resistance to compressive load, especially at the contact surfaces between the articular cartilage and meniscus. Lai et al (22) reported that the menisci were either substantially stiffer near the surface or had comparable compressive stiffness through the depth of the meniscus through compression testing. By assuming that a normal lamellar layer is relatively homogeneous and somewhat stiffer than underlying layers, it would be logical that a thicker layer would result in higher indentation stiffness. Also, we presume that, even within an individual, the lamellar layer thicknesses could vary depending on meniscal regions such as anterior, middle, and posterior horn because the compressive loading is known to be heterogeneous throughout the meniscus (23).
In addition, we observed that femoral lamellar layers tended to be thicker than tibial ones in normal samples. In daily practice, we encounter horizontal tears that extend to the tibial surface more commonly than those extending to the femoral surface (24). The reason for this finding is unclear. Probably, several factors influence on this phenomenon. We guess that our observation (ie, thicker lamellar layer in the femoral surface) may be one of the factors. It would be worth researching to consider our finding as a possible factor to follow up in further studies on tear pattern of the meniscus.
Compared with normal surfaces, the abnormal surfaces had a somewhat lowered stiffness and significant increase in thickness. It is conceivable that even though abnormal lamellar layers are thicker than normal ones, they might lose their stiffness, possibly because of degenerative changes. The degenerative process may be gradual and inhomogeneous, which would lead to varying degrees of lamellar thickening and associated focal softening. In our study, this was apparent in quantitative MR imaging maps, which showed a more heterogeneous distribution of T2, T2*, and T1ρ values in abnormal surfaces. The mechanism of indentation softening in a heterogeneous tissue is more complex than that in a homogeneous tissue. Consideration must be given to interaction between the heterogeneous lamellar layer and underlying meniscal tissue, and it may require rigorous assessment of intratissue deformation at micron resolution (25) to fully address this issue.
We also compared T2, UTE T2*, and UTE T1ρ values between the normal and abnormally thick lamellar layers. On the basis of our results, abnormally thick lamellar layers showed increase of all spin-echo T2, UTE T2*, and UTE T1ρ values compared with normal lamellar layers, though only UTE T2* values were significantly different. These results suggest sensitivity of UTE T2* properties to pathologic and biomechanical changes of human menisci. UTE T2* sequence may be useful for early evaluation of human meniscus.
There are several limitations in our study. First, there is a minimal discrepancy in one-to-one correlation of lamellar layer thickness and indentation force, the registration involved visual correspondence between registration photographs and during the indentation testing and MR images, which may have introduced an approximately 1-mm inaccuracy, even though care was taken to minimize this. Second, the underlying main central portion fibers were possibly engaged because of the indentation depth of approximately 100 μm and a macro-scale indenter even if this indentation test was conducted on the lamellar layers. As mentioned earlier, the mechanics of indentation is such that the biomechanical property of deeper layer meniscal tissue could influence the results. To reduce the influence of deeper layer, we used a small indenter (1 mm) and a shallow indentation depth (100 μm).
In conclusion, variation of lamellar layer thickness in healthy human menisci was evident on two-dimensional UTE MR images. In normal lamellar layers, thickness is highly and positively correlated with surface indentation stiffness. In addition, UTE T2* values potentially can be used to differentiate between normal and abnormally thickened lamellar layers.
Advances in Knowledge
■ Variation of lamellar layer thickness in healthy human menisci was evident on two-dimensional ultrashort echo time (UTE) images.
■ In normal lamellar layers, thickness was highly and positively correlated with indentation stiffness.
■ There was significant difference in UTE T2* value between normal and abnormally thick lamellar layers.
Implications for Patient Care
■ Detection of alterations in the lamellar layer of the meniscus may be valuable to detect the signs of early subclinical knee osteoarthritis.
■ Two-dimensional UTE MR imaging can depict variations in lamellar layer thickness and this correlates with biomechanical stiffness.
■ UTE T2* quantification can potentially be used to distinguish between normal and thickened lamellar layers.
Received March 21, 2015; revision requested May 6; revision received October 15; accepted October 27; final version accepted November 10.
The authors acknowledge funding from the National Institutes of Health grant #R01AR064321 and from the VA Clinical Science Research and Development Service (Career Development Award IK2CX000749).
Disclosures of Conflicts of Interest: J.Y.C. disclosed no relevant relationships. R.B. disclosed no relevant relationships. W.C.B. disclosed no relevant relationships. R.H. disclosed no relevant relationships. M.I. disclosed no relevant relationships. S.S. disclosed no relevant relationships. E.Y.C. disclosed no relevant relationships. J.D. disclosed no relevant relationships. G.M.B. disclosed no relevant relationships. D.D. Activities related to the present article: disclosed no relevant relationships. Activities not related to the present article: author disclosed a pending patent for electrospinning of meniscal tissue. Other relationships: disclosed no relevant relationships. C.B.C. disclosed no relevant relationships.
Abbreviation:
- TE
- echo time
- TR
- repetition time
- UTE
- ultrashort echo time
References
- 1.Fox AJ, Bedi A, Rodeo SA. The basic science of human knee menisci: structure, composition, and function. Sports Health 2012;4(4):340–351. [DOI] [PMC free article] [PubMed] [Google Scholar]
- 2.Makris EA, Hadidi P, Athanasiou KA. The knee meniscus: structure-function, pathophysiology, current repair techniques, and prospects for regeneration. Biomaterials 2011;32(30):7411–7431. [DOI] [PMC free article] [PubMed] [Google Scholar]
- 3.Messner K, Gao J. The menisci of the knee joint. Anatomical and functional characteristics, and a rationale for clinical treatment. J Anat 1998;193(Pt 2):161–178. [DOI] [PMC free article] [PubMed] [Google Scholar]
- 4.Bae WC, Du J, Bydder GM, Chung CB. Conventional and ultrashort time-to-echo magnetic resonance imaging of articular cartilage, meniscus, and intervertebral disk. Top Magn Reson Imaging 2010;21(5):275–289. [DOI] [PMC free article] [PubMed] [Google Scholar]
- 5.Du J, Carl M, Diaz E, et al. Ultrashort TE T1rho (UTE T1rho) imaging of the Achilles tendon and meniscus. Magn Reson Med 2010;64(3):834–842. [DOI] [PubMed] [Google Scholar]
- 6.Chang EY, Du J, Chung CB. UTE imaging in the musculoskeletal system. J Magn Reson Imaging 2015;41(4):870–883. [DOI] [PMC free article] [PubMed] [Google Scholar]
- 7.Omoumi P, Bae WC, Du J, et al. Meniscal calcifications: morphologic and quantitative evaluation by using 2D inversion-recovery ultrashort echo time and 3D ultrashort echo time 3.0-T MR imaging techniques—feasibility study. Radiology 2012;264(1):260–268. [DOI] [PMC free article] [PubMed] [Google Scholar]
- 8.Williams A, Qian Y, Golla S, Chu CR. UTE-T2* mapping detects sub-clinical meniscus injury after anterior cruciate ligament tear. Osteoarthritis Cartilage 2012;20(6):486–494. [DOI] [PMC free article] [PubMed] [Google Scholar]
- 9.Du J, Takahashi AM, Bydder M, Chung CB, Bydder GM. Ultrashort TE imaging with off-resonance saturation contrast (UTE-OSC). Magn Reson Med 2009;62(2):527–531. [DOI] [PubMed] [Google Scholar]
- 10.Robson MD, Gatehouse PD, Bydder M, Bydder GM. Magnetic resonance: an introduction to ultrashort TE (UTE) imaging. J Comput Assist Tomogr 2003;27(6):825–846. [DOI] [PubMed] [Google Scholar]
- 11.Koff MF, Shah P, Pownder S, et al. Correlation of meniscal T2* with multiphoton microscopy, and change of articular cartilage T2 in an ovine model of meniscal repair. Osteoarthritis Cartilage 2013;21(8):1083–1091. [DOI] [PMC free article] [PubMed] [Google Scholar]
- 12.Chu CR, Williams AA, West RV, et al. Quantitative magnetic resonance imaging UTE-T2* mapping of cartilage and meniscus healing after anatomic anterior cruciate ligament reconstruction. Am J Sports Med 2014;42(8):1847–1856. [DOI] [PMC free article] [PubMed] [Google Scholar]
- 13.Chang EY, Campos JC, Bae WC, et al. Ultrashort echo time T1ρ is sensitive to enzymatic degeneration of human menisci. J Comput Assist Tomogr 2015;39(5):637–642. [DOI] [PMC free article] [PubMed] [Google Scholar]
- 14.Petersen W, Tillmann B. Collagenous fibril texture of the human knee joint menisci. Anat Embryol (Berl) 1998;197(4):317–324. [DOI] [PubMed] [Google Scholar]
- 15.Skaggs DL, Warden WH, Mow VC. Radial tie fibers influence the tensile properties of the bovine medial meniscus. J Orthop Res 1994;12(2):176–185. [DOI] [PubMed] [Google Scholar]
- 16.Chang EY, Du J, Bae WC, Statum S, Chung CB. Effects of Achilles tendon immersion in saline and perfluorochemicals on T2 and T2*. J Magn Reson Imaging 2014;40(2):496–500. [DOI] [PubMed] [Google Scholar]
- 17.Du J, Carl M, Bydder M, Takahashi A, Chung CB, Bydder GM. Qualitative and quantitative ultrashort echo time (UTE) imaging of cortical bone. J Magn Reson 2010;207(2):304–311. [DOI] [PubMed] [Google Scholar]
- 18.Du J, Hamilton G, Takahashi A, Bydder M, Chung CB. Ultrashort echo time spectroscopic imaging (UTESI) of cortical bone. Magn Reson Med 2007;58(5):1001–1009. [DOI] [PubMed] [Google Scholar]
- 19.Du J, Takahashi AM, Chung CB. Ultrashort TE spectroscopic imaging (UTESI): application to the imaging of short T2 relaxation tissues in the musculoskeletal system. J Magn Reson Imaging 2009;29(2):412–421. [DOI] [PubMed] [Google Scholar]
- 20.Fithian DC, Kelly MA, Mow VC. Material properties and structure-function relationships in the menisci. Clin Orthop Relat Res 1990;(252):19–31. [PubMed] [Google Scholar]
- 21.Beaupré A, Choukroun R, Guidouin R, Garneau R, Gérardin H, Cardou A. Knee menisci. Correlation between microstructure and biomechanics. Clin Orthop Relat Res 1986;(208):72–75. [PubMed] [Google Scholar]
- 22.Lai JH, Levenston ME. Meniscus and cartilage exhibit distinct intra-tissue strain distributions under unconfined compression. Osteoarthritis Cartilage 2010;18(10):1291–1299. [DOI] [PMC free article] [PubMed] [Google Scholar]
- 23.Muriuki MG, Tuason DA, Tucker BG, Harner CD. Changes in tibiofemoral contact mechanics following radial split and vertical tears of the medial meniscus an in vitro investigation of the efficacy of arthroscopic repair. J Bone Joint Surg Am 2011;93(12):1089–1095. [DOI] [PubMed] [Google Scholar]
- 24.von Engelhardt LV, Schmitz A, Pennekamp PH, Schild HH, Wirtz DC, von Falkenhausen F. Diagnostics of degenerative meniscal tears at 3-Tesla MRI compared to arthroscopy as reference standard. Arch Orthop Trauma Surg 2008;128(5):451–456. [DOI] [PubMed] [Google Scholar]
- 25.Bae WC, Lewis CW, Levenston ME, Sah RL. Indentation testing of human articular cartilage: effects of probe tip geometry and indentation depth on intra-tissue strain. J Biomech 2006;39(6):1039–1047. [DOI] [PubMed] [Google Scholar]


