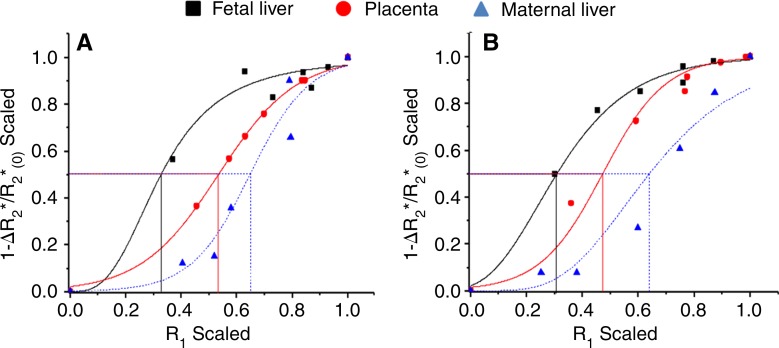
Figure 4:
Graphs show representative examples of MR imaging–based oxygen-hemoglobin dissociation curves and derived AP50 values in fetal liver (black), placenta (red), and maternal liver (blue) demonstrating expected sigmoid-shaped function, with shift to left between fetal and adult tissue on days, A, 14.5 and, B, 17.5.

