This study demonstrates that the use of multispectral optoacoustic tomography (MSOT) to detect the intrinsic signal unmixed for melanin enables detection of melanoma micrometastases and in-transit metastases in a B16F10 mouse model and that this ability is superior to that with fluorodeoxyglucose PET/CT; it also shows the superiority of MSOT in differentiating melanoma metastases from other lymphadenopathies in mice in vivo.
Abstract
Purpose
To study whether multispectral optoacoustic tomography (MSOT) can serve as a label-free imaging modality for the detection of lymph node micrometastases and in-transit metastases from melanoma on the basis of the intrinsic contrast of melanin in comparison to fluorine 18 fluorodeoxyglucose (FDG) positron emission tomography (PET)/computed tomography (CT).
Materials and Methods
The study was approved by the institutional animal care and use committee. Sequential MSOT was performed in a mouse B16F10 melanoma limb lymph node metastasis model (n = 13) to survey the development of macro-, micro- and in-transit metastases (metastases that are in transit from the primary tumor site to the local nodal basin) in vivo. The in vitro limit of detection was assessed in a B16F10 cell phantom. Signal specificity was determined on the basis of a simultaneous lymphadenitis (n = 4) and 4T1 breast cancer lymph metastasis (n = 2) model. MSOT was compared with intravenous FDG PET/CT. The diagnosis was assessed with histologic examination. Differences in the signal ratio (metastatic node to contralateral limb) between the two modalities were determined with the two-tailed paired t test.
Results
The mean signal ratios acquired with MSOT in micrometastases (2.5 ± 0.3, n = 6) and in-transit metastases (8.3 ± 5.8, n = 4) were higher than those obtained with FDG PET/CT (1.1 ± 0.5 [P < .01] and 1.3 ± 0.6 [P < .05], respectively). MSOT was able to help differentiate even small melanoma lymph node metastases from the other lymphadenopathies (P < .05 for both) in vivo, whereas FDG PET/CT could not (P > .1 for both). In vitro, the limit of detection was at an approximate cell density of five cells per microliter (P < .01).
Conclusion
MSOT enabled detection of melanoma lymph node micrometastases and in-transit metastases undetectable with FDG PET/CT and helped differentiate melanoma metastasis from other lymphadenopathies.
© RSNA, 2016
Introduction
Melanoma, the deadliest type of skin cancer, has been one of the fastest growing malignancies worldwide and has become the fifth most common cancer in the United States (1). Because melanoma is known to metastasize early into the local lymph basin, the most powerful predictor for outcome of melanoma at an early stage is the status of the sentinel lymph node (SLN) (2,3). In this regard, the excision of the SLN has been the standard of care but suffers from variably high false-negative rates: The proportion of node-positive patients who had tumor-negative SLN in the past has been reported to range from 5% to 38% (2,4). These patients have local basin disease recurrence and face a poor outcome, comparable to that of the group of patients with initial node-positive SLN (5,6) or worse (7). The most significant factors associated with the false-negative findings at SLN biopsy include (a) errors in identifying the correct SLN with lymphoscintigraphy and, subsequently, by the surgeon during excision, (b) the pathologist missing micrometastases in the examined lymph nodes, and (c) the lack of diagnostic means to detect metastases that are in transit from the primary tumor site to the local nodal basin at the time of SLN excision (in-transit metastases) (6,8–11). To solve all of these issues, highly sensitive and specific diagnostic imaging techniques for detecting melanoma metastases are required. So far, ultrasonography (US) and fluorine 18 (18F) fluorodeoxyglucose (FDG) positron emission tomography (PET)/computed tomography (CT) have been acknowledged as the imaging modalities of choice for the identification and surveillance of metastatic melanoma (12). However, all of these modalities are known to provide limited specificity and sensitivity with regard to the detection of nodal micrometastasis and in-transit melanoma metastasis at an early disease stage (12–15).
Multispectral optoacoustic tomography (MSOT) is an emerging optical biomedical imaging technique that enables noninvasive, high-spatial-resolution imaging of extrinsic contrast agents such as indocyanine green or intrinsic chromophores such as hemoglobin or melanin in near real time (16). Ex vivo, the MSOT signal of melanin obtained from excised SLN has already been shown to have excellent correlation with the histologic analyses of melanoma cell infiltration in animals (17) and improve the pathologic diagnosis in humans (18). In vivo, MSOT has recently been shown to be able to depict melanin expression driven by a vaccinia virus in lymph nodes (19) as well as melanin as a correlate of melanoma growth in brain metastases–bearing mice (20). In the recent first clinical feasibility study in 20 patients, MSOT was not only able to reliably depict SLN with use of indocyanine green and help guide SLN excision, but also could provide specific information about the node status with high sensitivity (18). However, because there is yet limited knowledge about the potential capabilities and limits of the technique for detecting melanoma metastasis in vivo, we conducted this study on the basis of an experimental lymph node melanoma metastasis model under controlled conditions. We aimed to study the capability of MSOT to serve as a label-free imaging modality for the detection of micrometastases and in-transit metastases from melanoma on the basis of the intrinsic contrast of melanin in comparison to FDG PET/CT.
Materials and Methods
V. Neuschmelting, H.L., J.G., and M.F.K. have no conflicts of interest to declare and hold control over all data and information reported in this study. V. Ntziachristos is a shareholder in iThera Medical (Munich, Germany), holds related patents, and serves as a consultant to the company.
Image Acquisition and Postprocessing
MSOT imaging.—The two-dimensional (2D) static small-animal MSOT setup (inVision 256-TF; iThera Medical) used in this study has been previously described elsewhere (21). In brief, an illumination beam is generated by a wavelength-tunable (680–980 nm) optical parametric oscillator with pulse duration of less than 10 nsec (frame rate, 10 Hz). The beam is divided into 10 output arms, which allows the mouse to be evenly illuminated from multiple angles in the center of the field of view (25 × 25 mm). The signal detection is based on an ultrasonic cylindrically focused 270° transducer array (radius, 40 mm) with 256 evenly distributed detector elements (5-MHz center frequency), reaching a maximum in-plane resolution of approximately 150 μm with a section thickness of approximately 800 μm in the center of the field of view. The probe is submerged in a water bath at a constant temperature of 34°C to allow for optimal acoustic coupling. The mice were shaved, and remnant hair was removed with use of depilatory cream if necessary. They were then horizontally positioned in a dedicated holder (iThera Medical) under 2% isoflurane anesthesia and wrapped with a thin polyethylene membrane and clear US gel as a couplant between the skin and the membrane. To enable the acquisition of a stack of 2D axial images ranging from the inguinal region to the toes and allow for optimal three-dimensional (3D) rendering thereafter, the mouse was z-translated through the imaging plane in 0.3-mm oversampling steps by using a linear stage control. In between z-translation, five frames of each of the following wavelengths were acquired in between wavelength-tuning at each position in all experiments in this study: 700, 715, 730, 760, 800, 830, and 860 nm. The total scanning time was, on average, 9.5 minutes (3.5 seconds per image plane).
The acquired images were band-pass filtered (6.5–50 MHz) and the value of the propagated speed of sound was individually adjusted to 1520 m/sec ± 5 in order to maximize the image resolution. The images were reconstructed with use of the model-based algorithm supplied within the ViewMSOT software suite (V3.6; iThera Medical). After image reconstruction, linear spectral unmixing (negative values were discarded) was applied to detect and separate signal of melanin from other intrinsic photoabsorbers such as oxygenated and deoxygenated hemoglobin, if applicable, on a pixel-by-pixel basis on the individual absorption spectra of those elements in the near-infrared window (20). All in vivo MSOT images presented in the study were scaled to the same threshold unless otherwise indicated (melanin: 6.0–66.0 arbitary units [au]; oxy- and deoxygenated hemoglobin: 4.0–40.0 au; background shown at 860 nm) to enable visual comparison of signal intensities throughout. After 3D rendering of the acquired stack of 2D images, the mean MSOT signal intensities for melanin in the popliteal basins were assessed by setting a cylindrical volume of interest (VOI) (15 mm3) around the popliteal nodes with use of the ViewMSOT software. To determine the signal of the in-transit metastases, small cylindrical VOIs (3 mm3) were drawn around the maximum melanin signal and the corresponding contralateral location on the leg, which served as a control. For the determination of the limit of detection of melanoma cells in vitro, cylindrical VOIs (16 mm3) of similar size were set to the target positions.
Three-dimensional handheld MSOT.—To assess the feasibility of the proposed concept for potential clinical translation, three mice with a micrometastasis present in their tumor-draining popliteal node were also imaged with use of a 3D handheld MSOT probe (iThera Medical) that has recently been developed for clinical use and characterized in detail (20). In brief, the 3D handheld MSOT probe consists of a spherical array of 384 ultrasonic detector elements and allows a tomographic coverage angle of 120° with a center frequency of 4 MHz, resulting in an optimal resolution of 240 μm reached at ±5 mm around the center of rotation in the center of the field of view (10 × 10 × 15 mm). The 3D probe was connected to the same optoacoustic imaging platform as the 2D static system, enabling a quick plug-and-play switching between the two approaches. The illumination beam was, thus, generated by the same wavelength-tunable optical parametric oscillator and the same presets (five frames per wavelength, seven wavelengths in total) as the 2D static tomographic system described earlier, allowing for a maximum raster scanning speed of approximately 3 mm/sec. However, because the fiber bundles were all fixed in the center of the array, a Pockels cell delay was adjusted to 250 μsec to reduce the overall laser energy for the output wavelengths to comply with the skin exposure guidelines for humans as previously reported (20). A stage-controlled water-filled animal bed at a constant temperature at 34°C covered by a thin transparent polyvinyl chloride membrane allowed to control translation in x, y, and z and stable acoustic coupling during imaging with use of a clear US gel. The acquired images (total scanning time, 3.5 seconds per 3D image data set) were reconstructed and unmixed according to the same algorithm as stated earlier, except for the use of the back-projection method instead of the model-based method, allowing for near-real-time imaging results, which is favorable for potential clinical translation.
FDG PET/CT.—Whole-body FDG PET/CT images were acquired by using an Inveon MicroPET/CT unit (Siemens Preclinical Solutions, Knoxville, Tenn) (22) with the mouse positioned prone on the built-in animal bed after it was fasted for 3 hours. The mice received a retro-orbital injection of 250–300-μCi FDG (IBA Molecular, Reston, Va; total volume = 50–80 μL, 0.11 mCi/mmol, radiochemical purity >98%) 40 minutes before imaging.
Forty million counts were recorded per PET scan (PET energy window, 350–700 keV; coincidence-timing window, 6 nsec; scanning time, 180 seconds at maximum; spatial resolution of 1.4 mm [18F] in the center of the field of view). Image data were corrected for detector nonuniformity, dead time count losses, positron branching ratio, and physical decay after the acquisition. Attenuation, scatter, or partial-volume averaging corrections were not applied. Counting rates in the reconstructed images were converted to activity concentrations in percentage of injected dose (ID) per gram of tissue by using a system calibration factor derived from the imaging of a mouse-sized water-equivalent phantom containing 18F.
For anatomic reference, whole-body standard low-magnification CT was performed with the following parameters: voltage, 80 kV; anode current, 500 μA; 120 rotational steps for a total of 220°; approximate scanning time, 240 seconds; exposure, 145 msec per frame; spatial resolution, 200 μm.
To quantify activity concentrations of the popliteal nodes in percentage ID per gram of tissue after visual verification of proper co-registration of scans, spherical VOIs were set by outlining the anatomic borders of each individual lymph node (both popliteal lymph nodes) by using the manufacturer’s analysis software (Inveon Research Workspace; Siemens Preclinical Solutions). The values were then expressed in relation to the mean FDG activity in the contralateral healthy inguinal lymph node serving as a control reference to account for the high interindividual variances in basal uptake level of FDG in lymphatic tissue. To determine the FDG activity values for the in-transit metastases observed with MSOT, a cylindrical VOI (35 mm3) was set around the corresponding suspected area of the tumor-draining leg as well as on the contralateral corresponding leg area as a healthy control. To display an overview of FDG uptake behavior, 3D maximum intensity projection images were generated. Fused axial FDG PET/CT images and corresponding FDG PET images were generated by using OsiriX imaging software (V.5.5.1; Pixmeo, Geneva, Switzerland).
All MSOT and FDG PET/CT imaging and analyses were performed by V. Neuschmelting and H.L., both with more than 5 years of experience in clinical and preclinical imaging.
Animal Experiments
All animal procedures were performed with the animals under general 2% isoflurane inhalation anesthesia in compliance with the institutional animal care and use committee guidelines.
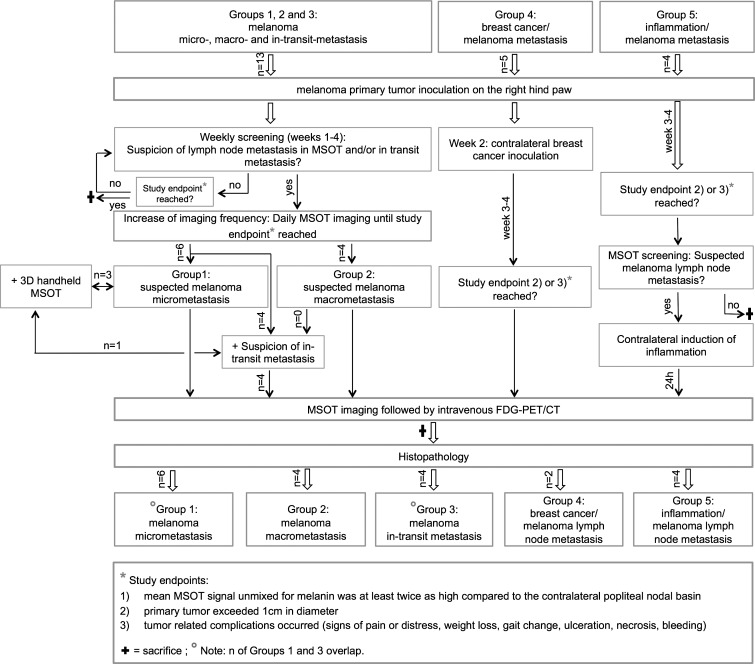
The mice were sequentially imaged with MSOT at least once a week to monitor lymph node metastasis development as well as to monitor for in-transit metastasis development over the course of 4 weeks, unless a study end point was reached before completion. The MSOT time point interval was shortened up to once per day when melanin signal increase was observed between the primary tumor and/or the popliteal lymph basin. In parallel, FDG PET/CT was performed when MSOT images were suspicious for an in-transit metastasis or when the study reached one of the following end points: (a) mean MSOT signal unmixed for melanin was at least twice as high compared with the contralateral popliteal nodal basin as described earlier, (b) the primary tumor exceeded 1 cm in diameter, or (c) tumor-related complications occurred (signs of pain or distress, weight loss, gait change, ulceration, necrosis, bleeding) (Fig 1).
Figure 1:
Flowchart of study protocol shows total number of animals, imaging sequence, and decision processes.
Melanoma lymph node metastasis model.—For the melanoma lymph node metastasis model, 6–8-week-old albino B6N-Tyrc-Brd/BrdCrCrl mice (Charles River Laboratories, Wilmington, Mass) were implanted subcutaneously on the dorsal right hind paw with 2 × 10⁵ B16F10 melanoma cells as primary tumor inoculation and developed ipsilateral melanoma lymph node metastases within 4 weeks thereafter. The contralateral popliteal nodes served as healthy intraindividual control nodes. If the primary tumor exceeded 8 mm in diameter within the first 21 days, tumor-reduction surgery was performed under sterile conditions to maximize the yield for potential lymph node metastasis development under adequate pain control.
Other lymphadenopathy models.—To determine the disease specificity of the MSOT signal, five 6–8-week-old NCR nude mice (Taconic Biosciences, Hudson, NY) were inoculated with 2 × 10⁵ B16F10 cells on the right hind paw and 1 × 10⁵ 4T1 breast cancer cells contralaterally 1 week thereafter, leading to simultaneous lymph node metastasis development in two of those mice. MSOT and FDG PET/CT were performed when the mice reached one of the end points (see earlier). In addition, four Albino B6 mice bearing advanced B16F10 primary tumors (before reaching one of the above-mentioned end points) were injected on the left hind paw (contralateral) with 100 μg ConcanavalinA (Sigma-Aldrich, St Louis, Mo) to induce acute lymphadenitis, as previously described (23). The inflammatory response in the left popliteal node peaked at 24 hours when subsequent MSOT and FDG PET/CT imaging was performed.
Histologic Examination
The mice were euthanized by means of carbon dioxide asphyxiation, and the popliteal nodes as well as the in-transit metastases, if applicable, were harvested and processed in 4% paraformaldehyde for further histologic examination with hematoxylin-eosin (H-E) staining. On the basis of the typical appearance of melanin pigment on the H-E–stained sections, the mice could be dichotomized according to the Rotterdam criteria (24) as a micrometastasis in their ipsilateral node (1 = tumor burden <0.1 mm; 2 = tumor burden 0.1–1 mm in maximum diameter) or as a macrometastasis (3 = tumor burden >1 mm).
In Vitro Experiments
Live B16F10 melanoma cells suspended in a dilution series of phosphate-buffered saline (PBS) (total volume, 20 μL each) in clear polypropylene microcentrifuge tubes (Corning, New York, NY) were dispersed by gently mixing and quickly thereafter positioned in the center of a cylindrical premolded tissue-mimicking agarose phantom (3.1 cm2 cross section × 15 cm length; the material consisted of 1.5% agarose, to which 0.002% per volume black ink and 1.2% per volume 20% intralipids were added during the cooling process at a temperature <60°C before solidification to mimic tissue scattering and absorption) to determine the MSOT signal-to-concentration ratio (scanning time per tube, 17.5 seconds). The 1.8 × 10⁵ B16F10 cells in 20-μL PBS referred to an optical density (800 nm) of 1. PBS served as a negative control.
Statistics
Differences in MSOT signal intensity and FDG PET activity, respectively, were based on group analyses of intraindividual comparisons of the mean value (±standard deviation) between a VOI on the tumor-draining side compared with the corresponding VOI on the contralateral side, which served as control, and were calculated separately with the two-tailed paired t test unless indicated otherwise. To allow for a direct intermodality comparison, the signal ratio was calculated by dividing the signal in the ipsilateral metastatic VOI by that in the corresponding contralateral healthy VOI, separately for each mouse and modality. Differences in the group mean signal ratio between the two modalities, that is, MSOT and FDG PET, were also calculated with the two-tailed paired t test. Results were determined with Prism software (V6.0; GraphPad, La Jolla, Calif). P < .05 was considered to indicate a statistically significant difference.
Results
Detection of Macro- versus Micrometastasis
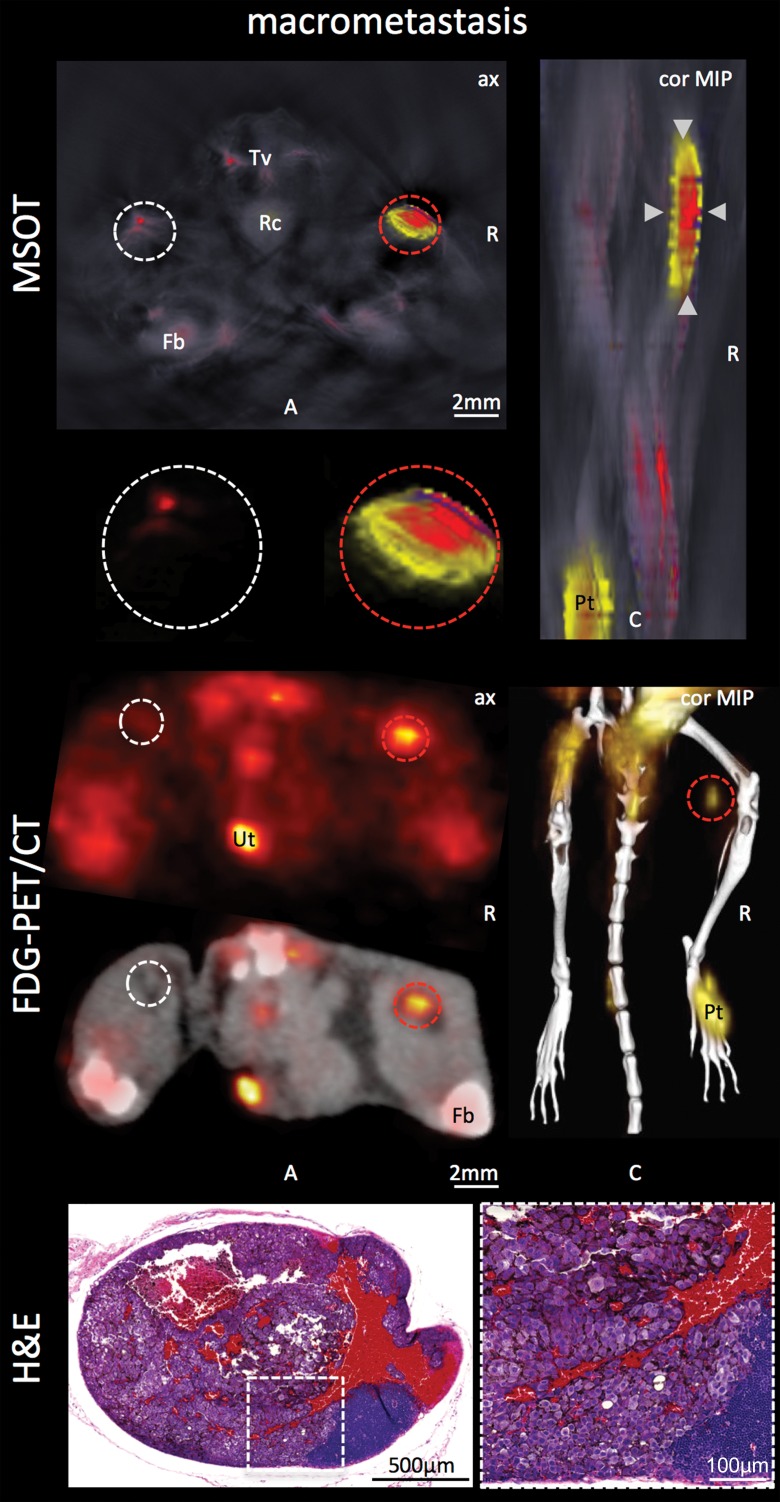
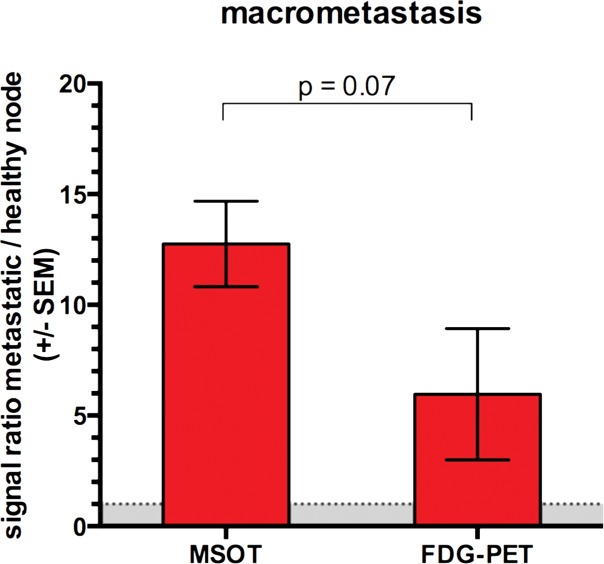
Both modalities, FDG PET/CT and MSOT, were found to be able to clearly depict the macrometastatic growth of melanoma cells in the popliteal node (Rotterdam category 3) compared with the contralateral healthy control node: While the mean MSOT signal unmixed for melanin was almost 13-fold higher than that in the contralateral control node (47.5 au ± 13.9 vs 3.8 au ± 0.8, respectively; n = 4; P < .01), the relative FDG uptake at PET in the same set of mice was found to be, on average, fourfold higher in the macrometastatic nodes than in the contralateral healthy popliteal nodes (11.0 ± 10.3 vs 2.6 ± 4.5, respectively; n = 4; P < .05). However, the difference in the signal ratio (metastatic to healthy contralateral popliteal node) between the two modalities was limited to a statistical trend (P = .07, n = 4) (Fig 2, Fig E1 [online]).
Figure 2a:
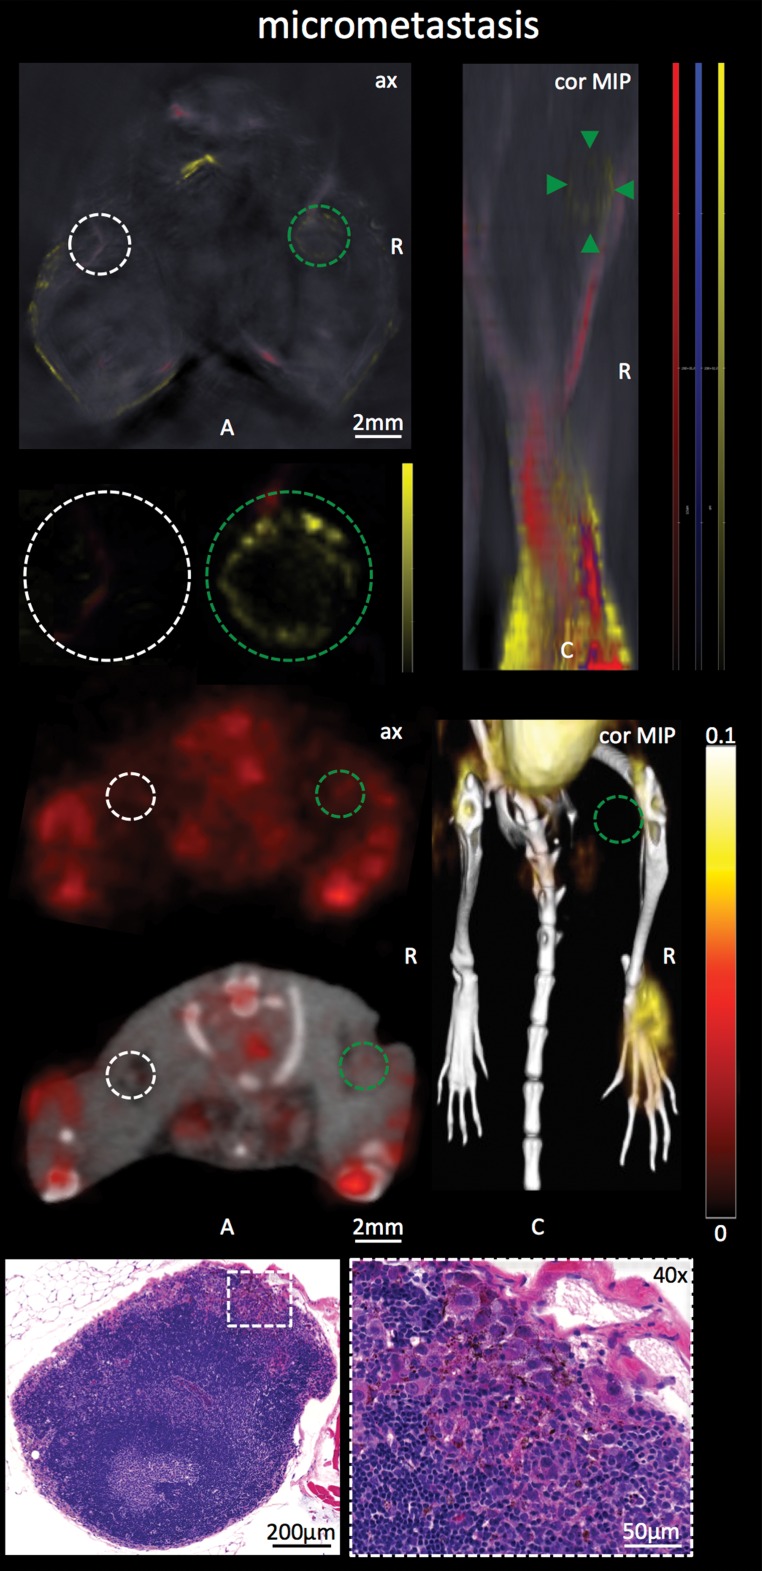
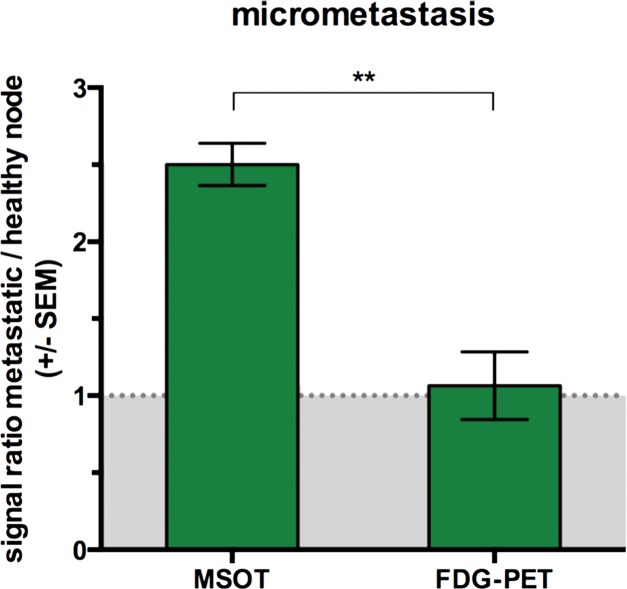
Detection of macro- versus micrometastasis. (a) MSOT and FDG PET/CT images and photomicrographs (H-E stain) in mouse (representative of four mice) bearing melanoma macrometastasis in right popliteal lymph node (red dashed circles; arrowheads in coronal maximum intensity projection [cor MIP] view). (b) Bar chart shows difference in metastatic-to–healthy contralateral popliteal node signal ratio between MSOT and FDG PET in macrometastases. SEM = standard error of the mean. (c) MSOT and FDG PET/CT images and photomicrographs (H-E stain) in mouse (representative of six mice) with node being infiltrated by micrometastasis (green dashed circles; green arrowheads in coronal maximum intensity projection [cor MIP] view) 3–4 weeks after primary tumor inoculation in right foot. Although MSOT and FDG PET/CT were both able to depict hemorrhagic melanoma macrometastasis in a and b), only MSOT signal unmixed for melanin (yellow) could help detect micrometastatic infiltration of melanoma cells in cortex of popliteal node. Magnified MSOT views of nodal basins (large dashed circles) were subtracted from background (MSOT signal for melanin was thresholded from 8 to 50 au for optimized display). Bright MSOT melanin signal and FDG activity, respectively, present at caudal end of coronal maximum intensity projection images, represent primary tumor (Pt) in right hind paw. Nodal status was histologically confirmed on the basis of the typical appearance of melanin pigment at H-E staining (brown). Although only a small focus of lymphoid tissue was found to be left in hemorrhagic macrometastatic node (in a), micrometastatic infiltration was limited to cortex of node, with most regular follicular lymph tissue still being intact (in b). A = anterior, ax = axial, C = caudal, Fb = femur, R = right, Rc = rectum, Tv = tail vessels, Ut = urethra. Dashed white circles = contralateral popliteal healthy control node; MSOT images were unmixed for deoxygenated hemoglobin (blue), oxygenated hemoglobin (red), and melanin (yellow). FDG PET scale is in percentage ID per gram of tissue. (d) Bar chart shows difference in metastatic-to–healthy contralateral popliteal node signal ratio between MSOT and FDG PET in micrometastases. Signal ratio equal to or below 1 is not sufficient for metastasis detection (gray shaded area). SEM = standard error of the mean.
Figure 2b:
Detection of macro- versus micrometastasis. (a) MSOT and FDG PET/CT images and photomicrographs (H-E stain) in mouse (representative of four mice) bearing melanoma macrometastasis in right popliteal lymph node (red dashed circles; arrowheads in coronal maximum intensity projection [cor MIP] view). (b) Bar chart shows difference in metastatic-to–healthy contralateral popliteal node signal ratio between MSOT and FDG PET in macrometastases. SEM = standard error of the mean. (c) MSOT and FDG PET/CT images and photomicrographs (H-E stain) in mouse (representative of six mice) with node being infiltrated by micrometastasis (green dashed circles; green arrowheads in coronal maximum intensity projection [cor MIP] view) 3–4 weeks after primary tumor inoculation in right foot. Although MSOT and FDG PET/CT were both able to depict hemorrhagic melanoma macrometastasis in a and b), only MSOT signal unmixed for melanin (yellow) could help detect micrometastatic infiltration of melanoma cells in cortex of popliteal node. Magnified MSOT views of nodal basins (large dashed circles) were subtracted from background (MSOT signal for melanin was thresholded from 8 to 50 au for optimized display). Bright MSOT melanin signal and FDG activity, respectively, present at caudal end of coronal maximum intensity projection images, represent primary tumor (Pt) in right hind paw. Nodal status was histologically confirmed on the basis of the typical appearance of melanin pigment at H-E staining (brown). Although only a small focus of lymphoid tissue was found to be left in hemorrhagic macrometastatic node (in a), micrometastatic infiltration was limited to cortex of node, with most regular follicular lymph tissue still being intact (in b). A = anterior, ax = axial, C = caudal, Fb = femur, R = right, Rc = rectum, Tv = tail vessels, Ut = urethra. Dashed white circles = contralateral popliteal healthy control node; MSOT images were unmixed for deoxygenated hemoglobin (blue), oxygenated hemoglobin (red), and melanin (yellow). FDG PET scale is in percentage ID per gram of tissue. (d) Bar chart shows difference in metastatic-to–healthy contralateral popliteal node signal ratio between MSOT and FDG PET in micrometastases. Signal ratio equal to or below 1 is not sufficient for metastasis detection (gray shaded area). SEM = standard error of the mean.
Figure 2c:
Detection of macro- versus micrometastasis. (a) MSOT and FDG PET/CT images and photomicrographs (H-E stain) in mouse (representative of four mice) bearing melanoma macrometastasis in right popliteal lymph node (red dashed circles; arrowheads in coronal maximum intensity projection [cor MIP] view). (b) Bar chart shows difference in metastatic-to–healthy contralateral popliteal node signal ratio between MSOT and FDG PET in macrometastases. SEM = standard error of the mean. (c) MSOT and FDG PET/CT images and photomicrographs (H-E stain) in mouse (representative of six mice) with node being infiltrated by micrometastasis (green dashed circles; green arrowheads in coronal maximum intensity projection [cor MIP] view) 3–4 weeks after primary tumor inoculation in right foot. Although MSOT and FDG PET/CT were both able to depict hemorrhagic melanoma macrometastasis in a and b), only MSOT signal unmixed for melanin (yellow) could help detect micrometastatic infiltration of melanoma cells in cortex of popliteal node. Magnified MSOT views of nodal basins (large dashed circles) were subtracted from background (MSOT signal for melanin was thresholded from 8 to 50 au for optimized display). Bright MSOT melanin signal and FDG activity, respectively, present at caudal end of coronal maximum intensity projection images, represent primary tumor (Pt) in right hind paw. Nodal status was histologically confirmed on the basis of the typical appearance of melanin pigment at H-E staining (brown). Although only a small focus of lymphoid tissue was found to be left in hemorrhagic macrometastatic node (in a), micrometastatic infiltration was limited to cortex of node, with most regular follicular lymph tissue still being intact (in b). A = anterior, ax = axial, C = caudal, Fb = femur, R = right, Rc = rectum, Tv = tail vessels, Ut = urethra. Dashed white circles = contralateral popliteal healthy control node; MSOT images were unmixed for deoxygenated hemoglobin (blue), oxygenated hemoglobin (red), and melanin (yellow). FDG PET scale is in percentage ID per gram of tissue. (d) Bar chart shows difference in metastatic-to–healthy contralateral popliteal node signal ratio between MSOT and FDG PET in micrometastases. Signal ratio equal to or below 1 is not sufficient for metastasis detection (gray shaded area). SEM = standard error of the mean.
Figure 2d:
Detection of macro- versus micrometastasis. (a) MSOT and FDG PET/CT images and photomicrographs (H-E stain) in mouse (representative of four mice) bearing melanoma macrometastasis in right popliteal lymph node (red dashed circles; arrowheads in coronal maximum intensity projection [cor MIP] view). (b) Bar chart shows difference in metastatic-to–healthy contralateral popliteal node signal ratio between MSOT and FDG PET in macrometastases. SEM = standard error of the mean. (c) MSOT and FDG PET/CT images and photomicrographs (H-E stain) in mouse (representative of six mice) with node being infiltrated by micrometastasis (green dashed circles; green arrowheads in coronal maximum intensity projection [cor MIP] view) 3–4 weeks after primary tumor inoculation in right foot. Although MSOT and FDG PET/CT were both able to depict hemorrhagic melanoma macrometastasis in a and b), only MSOT signal unmixed for melanin (yellow) could help detect micrometastatic infiltration of melanoma cells in cortex of popliteal node. Magnified MSOT views of nodal basins (large dashed circles) were subtracted from background (MSOT signal for melanin was thresholded from 8 to 50 au for optimized display). Bright MSOT melanin signal and FDG activity, respectively, present at caudal end of coronal maximum intensity projection images, represent primary tumor (Pt) in right hind paw. Nodal status was histologically confirmed on the basis of the typical appearance of melanin pigment at H-E staining (brown). Although only a small focus of lymphoid tissue was found to be left in hemorrhagic macrometastatic node (in a), micrometastatic infiltration was limited to cortex of node, with most regular follicular lymph tissue still being intact (in b). A = anterior, ax = axial, C = caudal, Fb = femur, R = right, Rc = rectum, Tv = tail vessels, Ut = urethra. Dashed white circles = contralateral popliteal healthy control node; MSOT images were unmixed for deoxygenated hemoglobin (blue), oxygenated hemoglobin (red), and melanin (yellow). FDG PET scale is in percentage ID per gram of tissue. (d) Bar chart shows difference in metastatic-to–healthy contralateral popliteal node signal ratio between MSOT and FDG PET in micrometastases. Signal ratio equal to or below 1 is not sufficient for metastasis detection (gray shaded area). SEM = standard error of the mean.
In the group of mice in which the degree of infiltration of melanoma cells in the popliteal node was limited to merely micrometastatic lesions (Rotterdam categories 1 and 2), the mean relative FDG PET activity in the diseased node (1.4 ± 0.6) did not differ from that in the contralateral healthy control node (1.2 ± 0.3, n = 6, P > .1), which illustrates that PET was not suitable for detecting melanoma micrometastases. MSOT, however, was still able to depict these micrometastases in vivo: In the same set of mice, measured on the same day, the mean MSOT signal unmixed for melanin in the micrometastatic popliteal node was found to be 7.4 au ± 3.1 and therefore significantly higher than the signal derived from the contralateral healthy control node (3.0 au ± 1.3, n = 6, P < .01). This mean signal ratio of 2.5 au ± 0.3 acquired with MSOT was significantly higher than the corresponding signal ratio at FDG PET (1.1 au ± 0.5, n = 6, P < .01).
Limit of Detection
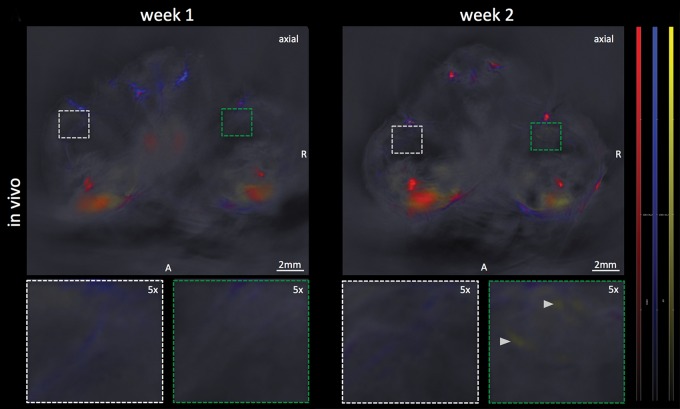
In the same set of mice with histologically evident presence of melanoma micrometastases 3 weeks after primary tumor inoculation, there was no melanin signal found in the popliteal tumor-draining nodal basin in the 1st week after primary tumor inoculation (mean, 3.9 au ± 1.8) in comparison to the contralateral control (mean, 3.4 au ± 1.3, n = 6, P > .1). During the 2nd week, all of these mice demonstrated a subtle increase (to a varying degree) in the signal of melanin in the tumor-draining popliteal node (mean, 4.6 au ± 1.2) compared with that in the contralateral node (mean, 3.1 au ± 1.4). The signal increase, which was primarily from the cortical region of the nodes, was strongly indicative of observing the early stage of the melanoma micrometastatic invasion as micrometastasis formation was histologically confirmed thereafter. This was supported by the statistical trend found in the group analysis of the MSOT signal difference between the ipsi- and contralateral popliteal node (n = 6, P = .06) (Fig 3a, 3b).
Figure 3a:
Limit of detection. (a) Axial MSOT images over time in same mouse shown in Figure 2 (representative of six mice), which was confirmed to bear a melanoma micrometastasis, 3 weeks after primary tumor inoculation. Although there was no sign of metastatic growth present in 1st week, subtle melanin signal (arrowheads) became detectable during 2nd week in right popliteal basin (green dashed box) as the earliest sign of beginning metastatic infiltration. MSOT images were unmixed for deoxygenated hemoglobin (blue), oxygenated hemoglobin (red), and melanin (yellow). Contralateral popliteal nodes served as healthy controls for comparison (white dashed boxes). A = anterior, R = right. (b) Graph shows melanin signal difference between ipsilateral and contralateral nodes over the course of 3 weeks. SEM = standard error of the mean. (c) In vitro MSOT images in tissue-mimicking phantom at 8 mm depth. Lowest density of live B16F10 melanoma cells in suspension that could be detected with MSOT were five cells per microliter PBS (images representative of triplicates, scale in MSOT signal unmixed for melanin in arbitrary units). Image saturation was reached at 1 × 10⁵ cells/μL. (d) Graph shows relationship between cell density and MSOT signal in comparison with PBS control. SD = standard deviation.
Figure 3b:
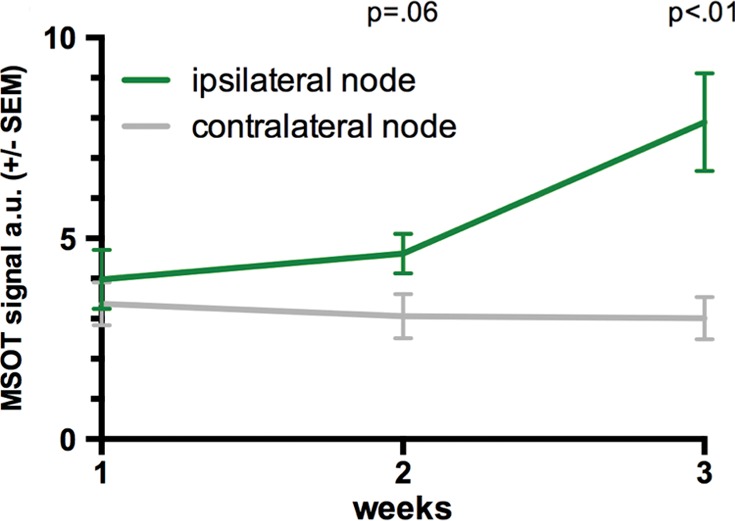
Limit of detection. (a) Axial MSOT images over time in same mouse shown in Figure 2 (representative of six mice), which was confirmed to bear a melanoma micrometastasis, 3 weeks after primary tumor inoculation. Although there was no sign of metastatic growth present in 1st week, subtle melanin signal (arrowheads) became detectable during 2nd week in right popliteal basin (green dashed box) as the earliest sign of beginning metastatic infiltration. MSOT images were unmixed for deoxygenated hemoglobin (blue), oxygenated hemoglobin (red), and melanin (yellow). Contralateral popliteal nodes served as healthy controls for comparison (white dashed boxes). A = anterior, R = right. (b) Graph shows melanin signal difference between ipsilateral and contralateral nodes over the course of 3 weeks. SEM = standard error of the mean. (c) In vitro MSOT images in tissue-mimicking phantom at 8 mm depth. Lowest density of live B16F10 melanoma cells in suspension that could be detected with MSOT were five cells per microliter PBS (images representative of triplicates, scale in MSOT signal unmixed for melanin in arbitrary units). Image saturation was reached at 1 × 10⁵ cells/μL. (d) Graph shows relationship between cell density and MSOT signal in comparison with PBS control. SD = standard deviation.
In vitro, in a tissue-mimicking phantom at 8 mm depth, the limit of detection of live B16F10 melanoma cells in a PBS dilution series was found to be at an approximate cell density of merely five cells per microliter. This was found to be the lowest cell density that generated a significantly higher MSOT signal (mean, 5.42 au ± 0.07) compared with PBS solution (mean, 5.05 au ± 0.01, n = 3, P < .01) (Fig 3c, 3d).
Figure 3c:
Limit of detection. (a) Axial MSOT images over time in same mouse shown in Figure 2 (representative of six mice), which was confirmed to bear a melanoma micrometastasis, 3 weeks after primary tumor inoculation. Although there was no sign of metastatic growth present in 1st week, subtle melanin signal (arrowheads) became detectable during 2nd week in right popliteal basin (green dashed box) as the earliest sign of beginning metastatic infiltration. MSOT images were unmixed for deoxygenated hemoglobin (blue), oxygenated hemoglobin (red), and melanin (yellow). Contralateral popliteal nodes served as healthy controls for comparison (white dashed boxes). A = anterior, R = right. (b) Graph shows melanin signal difference between ipsilateral and contralateral nodes over the course of 3 weeks. SEM = standard error of the mean. (c) In vitro MSOT images in tissue-mimicking phantom at 8 mm depth. Lowest density of live B16F10 melanoma cells in suspension that could be detected with MSOT were five cells per microliter PBS (images representative of triplicates, scale in MSOT signal unmixed for melanin in arbitrary units). Image saturation was reached at 1 × 10⁵ cells/μL. (d) Graph shows relationship between cell density and MSOT signal in comparison with PBS control. SD = standard deviation.
Figure 3d:
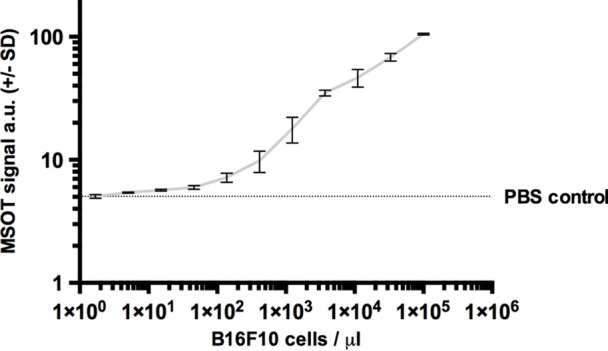
Limit of detection. (a) Axial MSOT images over time in same mouse shown in Figure 2 (representative of six mice), which was confirmed to bear a melanoma micrometastasis, 3 weeks after primary tumor inoculation. Although there was no sign of metastatic growth present in 1st week, subtle melanin signal (arrowheads) became detectable during 2nd week in right popliteal basin (green dashed box) as the earliest sign of beginning metastatic infiltration. MSOT images were unmixed for deoxygenated hemoglobin (blue), oxygenated hemoglobin (red), and melanin (yellow). Contralateral popliteal nodes served as healthy controls for comparison (white dashed boxes). A = anterior, R = right. (b) Graph shows melanin signal difference between ipsilateral and contralateral nodes over the course of 3 weeks. SEM = standard error of the mean. (c) In vitro MSOT images in tissue-mimicking phantom at 8 mm depth. Lowest density of live B16F10 melanoma cells in suspension that could be detected with MSOT were five cells per microliter PBS (images representative of triplicates, scale in MSOT signal unmixed for melanin in arbitrary units). Image saturation was reached at 1 × 10⁵ cells/μL. (d) Graph shows relationship between cell density and MSOT signal in comparison with PBS control. SD = standard deviation.
Detection of In-Transit Metastasis
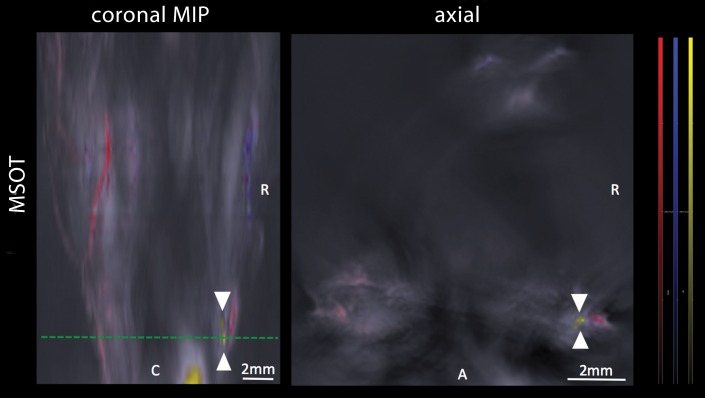
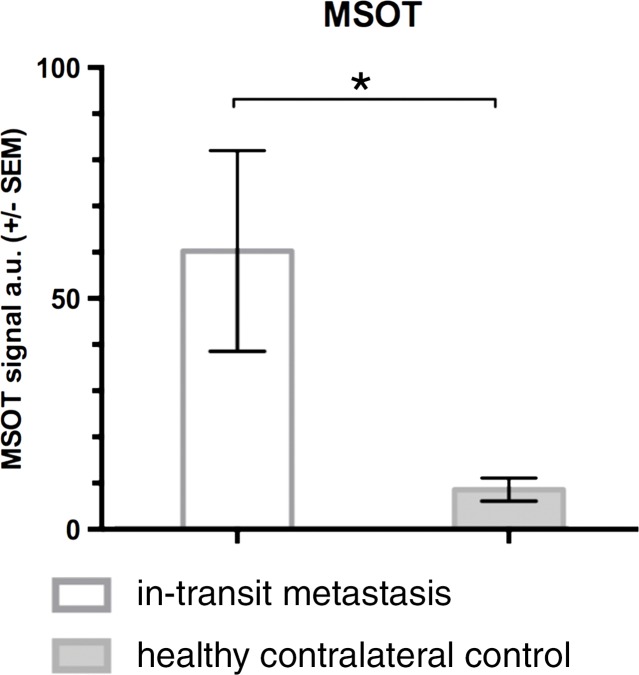
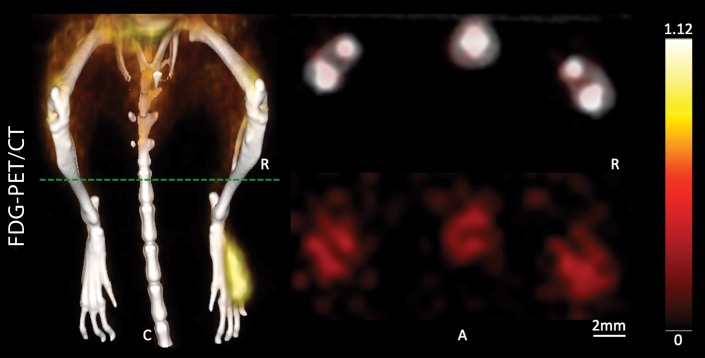
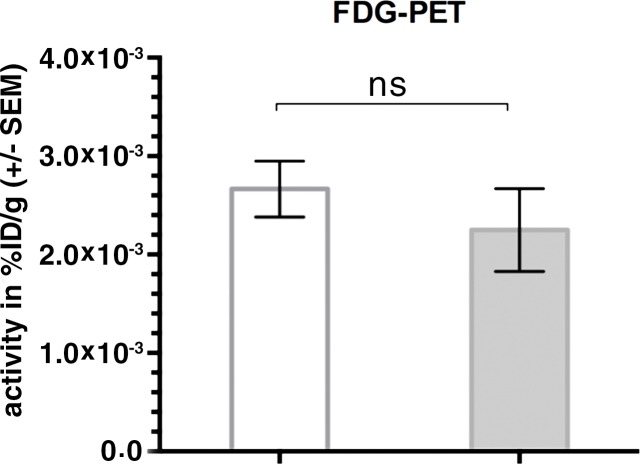
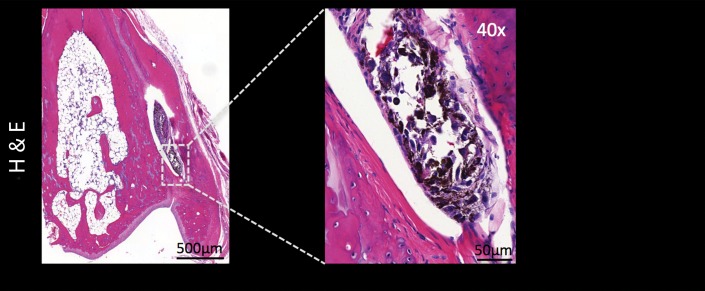
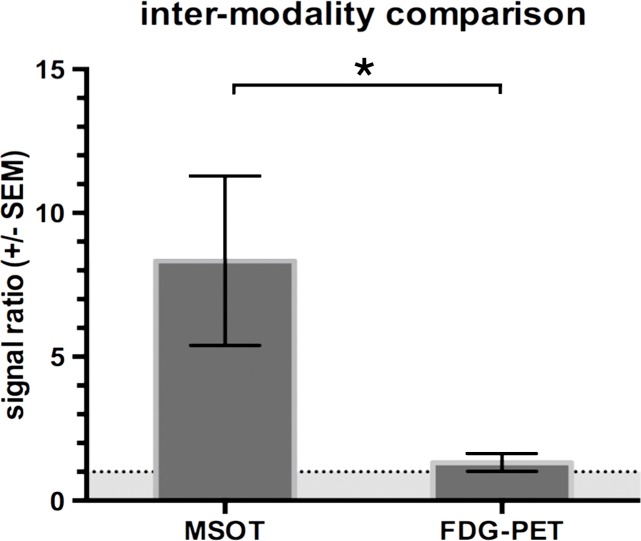
During sequential MSOT in the first 3 weeks after primary tumor inoculation, MSOT was able to depict bright clusters of subcutaneous or deep tissue melanin signal distant to the primary tumor site but clearly separated from the popliteal nodal basin in four mice, resembling a correlate of early stage in-transit melanoma metastasis: The MSOT signal of these in-transit metastases of varying intensity (mean, 60.3 au ± 43.4) was significantly higher than that determined in a VOI of the same size on the corresponding contralateral healthy leg (mean, 8.6 au ± 5.0, n = 4, P < .05) (Fig 4). This mean MSOT signal ratio (ipsilateral-to-contralateral VOI) of 8.3 au ± 5.8 was found to be significantly higher than the corresponding signal ratio determined with FDG PET/CT (1.3 au ± 0.6, n = 4, P < .05). In fact, FDG PET/CT performed on the same day did not show a difference in FDG activity between the corresponding VOI in the tumor-draining leg (2.7 × 10⁻³% ID/g ± 5.7 × 10⁻⁴) compared with the contralateral healthy control leg (2.2 × 10⁻³% ID/g ± 8.4 × 10⁻⁴, n = 4, P > .1) and, thus, failed to depict the in-transit melanoma metastases in those mice. After image acquisition, histologic examination of the corresponding tissue samples was performed, which confirmed the presence of clusters of metastasizing melanoma cells on the basis of the typical appearance of melanin pigment at H-E staining.
Figure 4a:
Detection of in-transit metastasis. (a) MSOT images show subtle melanin signal clusters of varying sizes (arrowheads) “in transit” from primary tumor site to lymph nodal basin (representative of four mice). A = anterior, C = caudal, R = right. Axial image plane is indicated by green dashed line on coronal maximum intensity projection (MIP) image. MSOT images are unmixed for deoxygenated hemoglobin (blue), oxygenated hemoglobin (red), and melanin (yellow). (b) Bar chart shows MSOT signal in in-transit metastasis and healthy contralateral control. SEM = standard error of the mean. (c) In contrast, FDG PET/CT could not reveal presence of in-transit melanoma metastases, as shown by corresponding FDG PET/CT images of same representative mouse. FDG PET scale is in percentage ID per gram of tissue. (d, f) Bar charts show FDG activity in in-transit metastasis (white bar) and healthy contralateral control node (gray bar) (d) and intermodality comparison of signal ratio in MSOT and FDG PET (f). Signal ratio equal to or below 1 is not sufficient for melanoma metastasis detection (gray shaded area in f). * = P < .05, ns = nonsignificant, SEM = standard error of the mean. (e) Photomicrographs (H-E stain) of respective tissue samples confirm presence of these metastasizing clusters of melanoma cells based on the typical brown pigment of melanin being surrounded by bone, muscle, vessels, and connective tissue.
Figure 4b:
Detection of in-transit metastasis. (a) MSOT images show subtle melanin signal clusters of varying sizes (arrowheads) “in transit” from primary tumor site to lymph nodal basin (representative of four mice). A = anterior, C = caudal, R = right. Axial image plane is indicated by green dashed line on coronal maximum intensity projection (MIP) image. MSOT images are unmixed for deoxygenated hemoglobin (blue), oxygenated hemoglobin (red), and melanin (yellow). (b) Bar chart shows MSOT signal in in-transit metastasis and healthy contralateral control. SEM = standard error of the mean. (c) In contrast, FDG PET/CT could not reveal presence of in-transit melanoma metastases, as shown by corresponding FDG PET/CT images of same representative mouse. FDG PET scale is in percentage ID per gram of tissue. (d, f) Bar charts show FDG activity in in-transit metastasis (white bar) and healthy contralateral control node (gray bar) (d) and intermodality comparison of signal ratio in MSOT and FDG PET (f). Signal ratio equal to or below 1 is not sufficient for melanoma metastasis detection (gray shaded area in f). * = P < .05, ns = nonsignificant, SEM = standard error of the mean. (e) Photomicrographs (H-E stain) of respective tissue samples confirm presence of these metastasizing clusters of melanoma cells based on the typical brown pigment of melanin being surrounded by bone, muscle, vessels, and connective tissue.
Figure 4c:
Detection of in-transit metastasis. (a) MSOT images show subtle melanin signal clusters of varying sizes (arrowheads) “in transit” from primary tumor site to lymph nodal basin (representative of four mice). A = anterior, C = caudal, R = right. Axial image plane is indicated by green dashed line on coronal maximum intensity projection (MIP) image. MSOT images are unmixed for deoxygenated hemoglobin (blue), oxygenated hemoglobin (red), and melanin (yellow). (b) Bar chart shows MSOT signal in in-transit metastasis and healthy contralateral control. SEM = standard error of the mean. (c) In contrast, FDG PET/CT could not reveal presence of in-transit melanoma metastases, as shown by corresponding FDG PET/CT images of same representative mouse. FDG PET scale is in percentage ID per gram of tissue. (d, f) Bar charts show FDG activity in in-transit metastasis (white bar) and healthy contralateral control node (gray bar) (d) and intermodality comparison of signal ratio in MSOT and FDG PET (f). Signal ratio equal to or below 1 is not sufficient for melanoma metastasis detection (gray shaded area in f). * = P < .05, ns = nonsignificant, SEM = standard error of the mean. (e) Photomicrographs (H-E stain) of respective tissue samples confirm presence of these metastasizing clusters of melanoma cells based on the typical brown pigment of melanin being surrounded by bone, muscle, vessels, and connective tissue.
Figure 4d:
Detection of in-transit metastasis. (a) MSOT images show subtle melanin signal clusters of varying sizes (arrowheads) “in transit” from primary tumor site to lymph nodal basin (representative of four mice). A = anterior, C = caudal, R = right. Axial image plane is indicated by green dashed line on coronal maximum intensity projection (MIP) image. MSOT images are unmixed for deoxygenated hemoglobin (blue), oxygenated hemoglobin (red), and melanin (yellow). (b) Bar chart shows MSOT signal in in-transit metastasis and healthy contralateral control. SEM = standard error of the mean. (c) In contrast, FDG PET/CT could not reveal presence of in-transit melanoma metastases, as shown by corresponding FDG PET/CT images of same representative mouse. FDG PET scale is in percentage ID per gram of tissue. (d, f) Bar charts show FDG activity in in-transit metastasis (white bar) and healthy contralateral control node (gray bar) (d) and intermodality comparison of signal ratio in MSOT and FDG PET (f). Signal ratio equal to or below 1 is not sufficient for melanoma metastasis detection (gray shaded area in f). * = P < .05, ns = nonsignificant, SEM = standard error of the mean. (e) Photomicrographs (H-E stain) of respective tissue samples confirm presence of these metastasizing clusters of melanoma cells based on the typical brown pigment of melanin being surrounded by bone, muscle, vessels, and connective tissue.
Figure 4e:
Detection of in-transit metastasis. (a) MSOT images show subtle melanin signal clusters of varying sizes (arrowheads) “in transit” from primary tumor site to lymph nodal basin (representative of four mice). A = anterior, C = caudal, R = right. Axial image plane is indicated by green dashed line on coronal maximum intensity projection (MIP) image. MSOT images are unmixed for deoxygenated hemoglobin (blue), oxygenated hemoglobin (red), and melanin (yellow). (b) Bar chart shows MSOT signal in in-transit metastasis and healthy contralateral control. SEM = standard error of the mean. (c) In contrast, FDG PET/CT could not reveal presence of in-transit melanoma metastases, as shown by corresponding FDG PET/CT images of same representative mouse. FDG PET scale is in percentage ID per gram of tissue. (d, f) Bar charts show FDG activity in in-transit metastasis (white bar) and healthy contralateral control node (gray bar) (d) and intermodality comparison of signal ratio in MSOT and FDG PET (f). Signal ratio equal to or below 1 is not sufficient for melanoma metastasis detection (gray shaded area in f). * = P < .05, ns = nonsignificant, SEM = standard error of the mean. (e) Photomicrographs (H-E stain) of respective tissue samples confirm presence of these metastasizing clusters of melanoma cells based on the typical brown pigment of melanin being surrounded by bone, muscle, vessels, and connective tissue.
Figure 4f:
Detection of in-transit metastasis. (a) MSOT images show subtle melanin signal clusters of varying sizes (arrowheads) “in transit” from primary tumor site to lymph nodal basin (representative of four mice). A = anterior, C = caudal, R = right. Axial image plane is indicated by green dashed line on coronal maximum intensity projection (MIP) image. MSOT images are unmixed for deoxygenated hemoglobin (blue), oxygenated hemoglobin (red), and melanin (yellow). (b) Bar chart shows MSOT signal in in-transit metastasis and healthy contralateral control. SEM = standard error of the mean. (c) In contrast, FDG PET/CT could not reveal presence of in-transit melanoma metastases, as shown by corresponding FDG PET/CT images of same representative mouse. FDG PET scale is in percentage ID per gram of tissue. (d, f) Bar charts show FDG activity in in-transit metastasis (white bar) and healthy contralateral control node (gray bar) (d) and intermodality comparison of signal ratio in MSOT and FDG PET (f). Signal ratio equal to or below 1 is not sufficient for melanoma metastasis detection (gray shaded area in f). * = P < .05, ns = nonsignificant, SEM = standard error of the mean. (e) Photomicrographs (H-E stain) of respective tissue samples confirm presence of these metastasizing clusters of melanoma cells based on the typical brown pigment of melanin being surrounded by bone, muscle, vessels, and connective tissue.
Disease Specificity
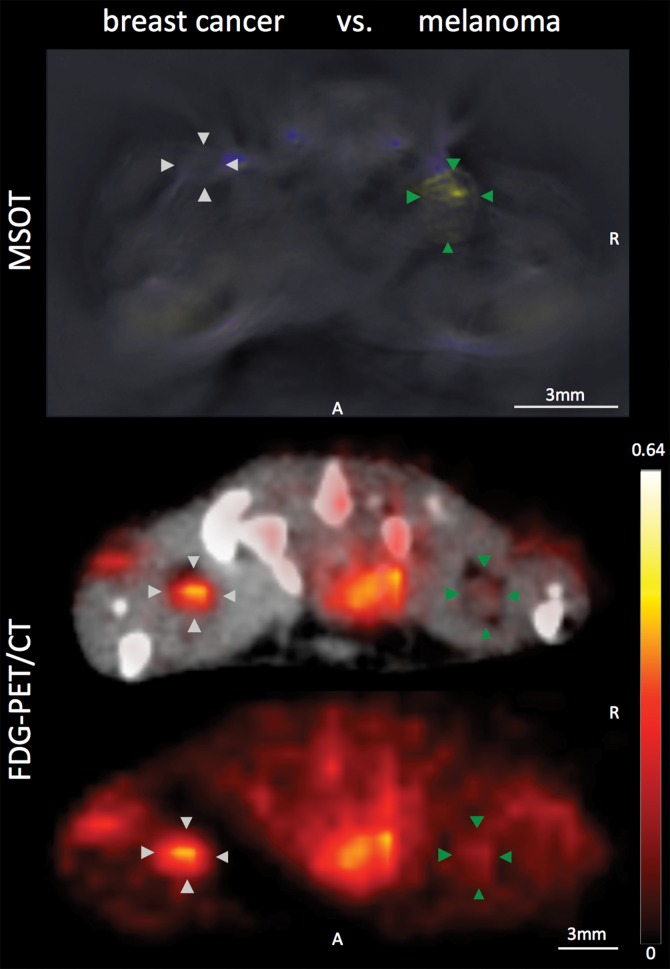
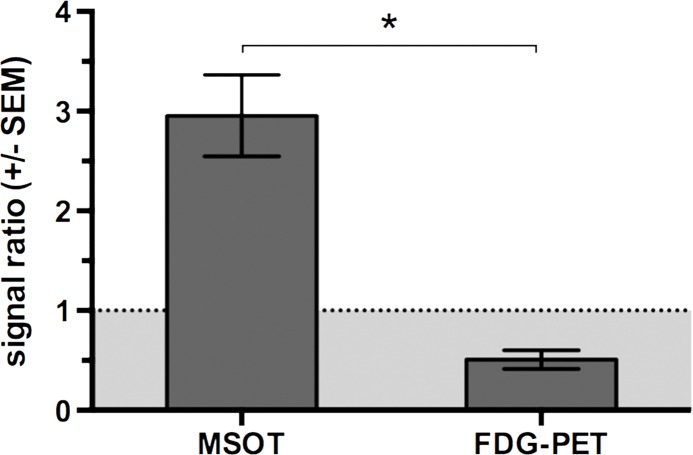
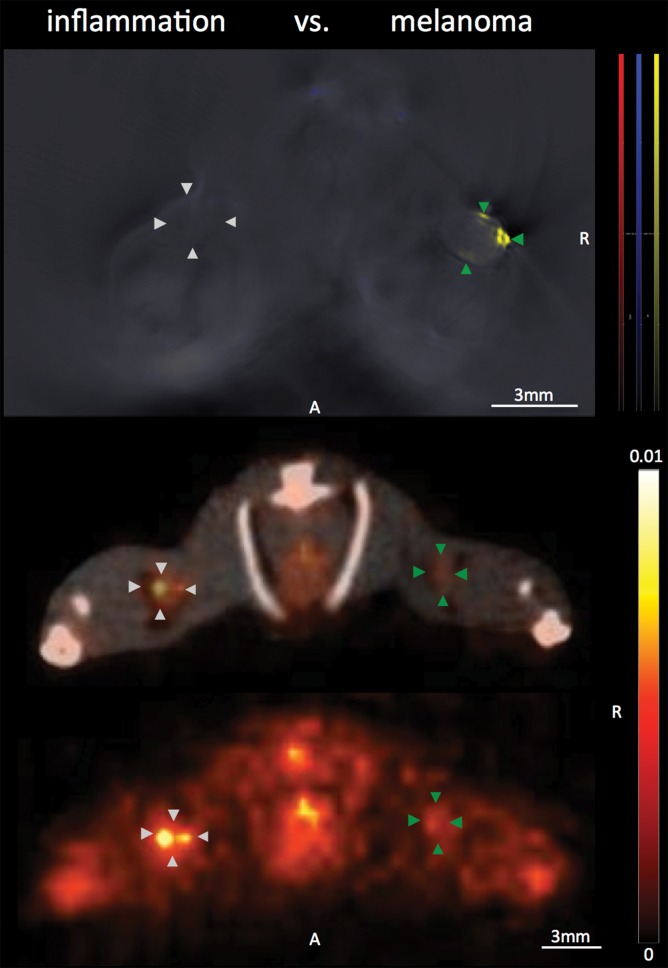
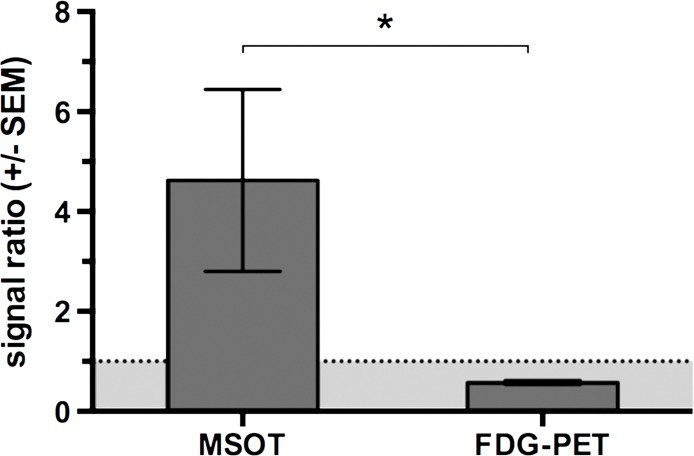
With regard to the specificity of the MSOT signal unmixed for melanin to differentiate melanoma lymph node metastases from other lymphadenopathies, we found the MSOT signal to be highly specific for melanoma: Even small melanoma metastatic nodes (Rotterdam category 2) showed significantly higher MSOT signal (mean, 10.9 au ± 5.3) than contralateral inflammatory nodes (mean, 2.7 au ± 0.8, n = 4, P < .05) or lymph nodes infiltrated by breast cancer metastases (mean, 4.2 au ± 2.9, n = 2, P < .05) in intraindividual comparisons (Fig 5, Fig E2 [online]). The uptake of FDG in the same mice, however, showed the opposite relationship. The relative PET activity in the inflammatory nodes (mean, 2.1 ± 0.6) or nodes with breast cancer (mean, 2.4 ± 0.9) was significantly higher than that in the small melanoma metastatic nodes (1.2 ± 0.4, P < .05 for both). In the intermodality comparison, the signal ratios of the melanoma metastatic nodes and inflammatorily enlarged or breast cancerous nodes acquired with MSOT were significantly higher than the corresponding signal ratios obtained with FDG PET/CT (P < .05 for both). With the signal ratios of FDG PET being smaller than 1, FDG uptake was thus found to be of nonspecific value for the detection of melanoma metastasis. Of note, there was no difference detected between the FDG activity in inflammatory and neoplastic breast cancerous nodes (P > .1, unpaired t test).
Figure 5a:
Disease specificity. (a, c) Axial MSOT and FDG PET/CT images of popliteal node basin in two mice within 3 weeks after being implanted with B16F10 melanoma cells on right foot and 4T1 breast cancer cells on left foot (a) or induction of a nodal inflammatory response (c). MSOT specifically revealed presence of small melanoma metastases in right popliteal nodes (green arrowheads). Conversely, FDG PET signal was found to be nonspecific for detecting melanoma metastases as it showed higher activity in left breast cancer–infiltrated node (signal ratio <1; representative of two mice; white arrowheads in a) as well as inflammatory node (signal ratio <1; representative of four mice; white arrowheads in c), respectively, compared with melanoma metastatic node (green arrowheads). MSOT images were unmixed for deoxygenated hemoglobin (blue), oxygenated hemoglobin (red), and melanin (yellow). FDG PET scale is in percentage ID per gram of tissue. A = anterior, R = right. (b, d) Bar charts show signal ratio in nodes infiltrated by breast cancer versus melanoma (b) and melanoma versus contralateral inflammatory nodes (d). Signal ratio equal to or below 1 is not sufficient for melanoma metastasis detection (gray shaded area). * = P < .05. SEM = standard error of the mean. (e) Photomicrographs (H-E stain) of presented lymphadenopathies confirm presence of 4T1 breast cancer lymph node metastases (left), typical appearance of melanin pigment in melanoma metastatic nodes (middle), and typical follicular hyperplasia of inflammatory nodes (right).
Figure 5b:
Disease specificity. (a, c) Axial MSOT and FDG PET/CT images of popliteal node basin in two mice within 3 weeks after being implanted with B16F10 melanoma cells on right foot and 4T1 breast cancer cells on left foot (a) or induction of a nodal inflammatory response (c). MSOT specifically revealed presence of small melanoma metastases in right popliteal nodes (green arrowheads). Conversely, FDG PET signal was found to be nonspecific for detecting melanoma metastases as it showed higher activity in left breast cancer–infiltrated node (signal ratio <1; representative of two mice; white arrowheads in a) as well as inflammatory node (signal ratio <1; representative of four mice; white arrowheads in c), respectively, compared with melanoma metastatic node (green arrowheads). MSOT images were unmixed for deoxygenated hemoglobin (blue), oxygenated hemoglobin (red), and melanin (yellow). FDG PET scale is in percentage ID per gram of tissue. A = anterior, R = right. (b, d) Bar charts show signal ratio in nodes infiltrated by breast cancer versus melanoma (b) and melanoma versus contralateral inflammatory nodes (d). Signal ratio equal to or below 1 is not sufficient for melanoma metastasis detection (gray shaded area). * = P < .05. SEM = standard error of the mean. (e) Photomicrographs (H-E stain) of presented lymphadenopathies confirm presence of 4T1 breast cancer lymph node metastases (left), typical appearance of melanin pigment in melanoma metastatic nodes (middle), and typical follicular hyperplasia of inflammatory nodes (right).
Figure 5c:
Disease specificity. (a, c) Axial MSOT and FDG PET/CT images of popliteal node basin in two mice within 3 weeks after being implanted with B16F10 melanoma cells on right foot and 4T1 breast cancer cells on left foot (a) or induction of a nodal inflammatory response (c). MSOT specifically revealed presence of small melanoma metastases in right popliteal nodes (green arrowheads). Conversely, FDG PET signal was found to be nonspecific for detecting melanoma metastases as it showed higher activity in left breast cancer–infiltrated node (signal ratio <1; representative of two mice; white arrowheads in a) as well as inflammatory node (signal ratio <1; representative of four mice; white arrowheads in c), respectively, compared with melanoma metastatic node (green arrowheads). MSOT images were unmixed for deoxygenated hemoglobin (blue), oxygenated hemoglobin (red), and melanin (yellow). FDG PET scale is in percentage ID per gram of tissue. A = anterior, R = right. (b, d) Bar charts show signal ratio in nodes infiltrated by breast cancer versus melanoma (b) and melanoma versus contralateral inflammatory nodes (d). Signal ratio equal to or below 1 is not sufficient for melanoma metastasis detection (gray shaded area). * = P < .05. SEM = standard error of the mean. (e) Photomicrographs (H-E stain) of presented lymphadenopathies confirm presence of 4T1 breast cancer lymph node metastases (left), typical appearance of melanin pigment in melanoma metastatic nodes (middle), and typical follicular hyperplasia of inflammatory nodes (right).
Figure 5d:
Disease specificity. (a, c) Axial MSOT and FDG PET/CT images of popliteal node basin in two mice within 3 weeks after being implanted with B16F10 melanoma cells on right foot and 4T1 breast cancer cells on left foot (a) or induction of a nodal inflammatory response (c). MSOT specifically revealed presence of small melanoma metastases in right popliteal nodes (green arrowheads). Conversely, FDG PET signal was found to be nonspecific for detecting melanoma metastases as it showed higher activity in left breast cancer–infiltrated node (signal ratio <1; representative of two mice; white arrowheads in a) as well as inflammatory node (signal ratio <1; representative of four mice; white arrowheads in c), respectively, compared with melanoma metastatic node (green arrowheads). MSOT images were unmixed for deoxygenated hemoglobin (blue), oxygenated hemoglobin (red), and melanin (yellow). FDG PET scale is in percentage ID per gram of tissue. A = anterior, R = right. (b, d) Bar charts show signal ratio in nodes infiltrated by breast cancer versus melanoma (b) and melanoma versus contralateral inflammatory nodes (d). Signal ratio equal to or below 1 is not sufficient for melanoma metastasis detection (gray shaded area). * = P < .05. SEM = standard error of the mean. (e) Photomicrographs (H-E stain) of presented lymphadenopathies confirm presence of 4T1 breast cancer lymph node metastases (left), typical appearance of melanin pigment in melanoma metastatic nodes (middle), and typical follicular hyperplasia of inflammatory nodes (right).
Figure 5e:
Disease specificity. (a, c) Axial MSOT and FDG PET/CT images of popliteal node basin in two mice within 3 weeks after being implanted with B16F10 melanoma cells on right foot and 4T1 breast cancer cells on left foot (a) or induction of a nodal inflammatory response (c). MSOT specifically revealed presence of small melanoma metastases in right popliteal nodes (green arrowheads). Conversely, FDG PET signal was found to be nonspecific for detecting melanoma metastases as it showed higher activity in left breast cancer–infiltrated node (signal ratio <1; representative of two mice; white arrowheads in a) as well as inflammatory node (signal ratio <1; representative of four mice; white arrowheads in c), respectively, compared with melanoma metastatic node (green arrowheads). MSOT images were unmixed for deoxygenated hemoglobin (blue), oxygenated hemoglobin (red), and melanin (yellow). FDG PET scale is in percentage ID per gram of tissue. A = anterior, R = right. (b, d) Bar charts show signal ratio in nodes infiltrated by breast cancer versus melanoma (b) and melanoma versus contralateral inflammatory nodes (d). Signal ratio equal to or below 1 is not sufficient for melanoma metastasis detection (gray shaded area). * = P < .05. SEM = standard error of the mean. (e) Photomicrographs (H-E stain) of presented lymphadenopathies confirm presence of 4T1 breast cancer lymph node metastases (left), typical appearance of melanin pigment in melanoma metastatic nodes (middle), and typical follicular hyperplasia of inflammatory nodes (right).
Three-dimensional Handheld MSOT
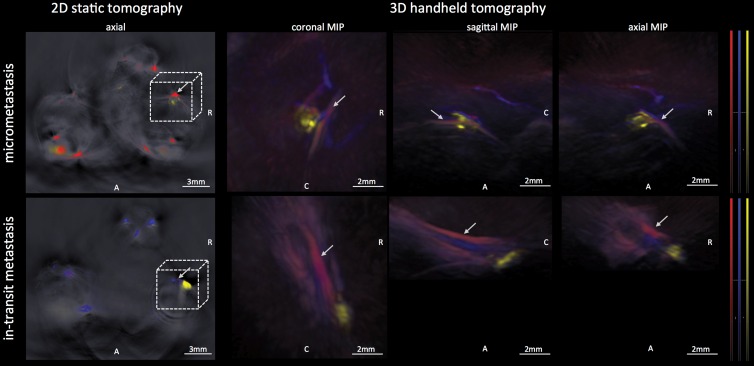
The recently developed 3D handheld MSOT system was found to be suitable for detecting the micrometastases in the popliteal nodes of three mice that were additionally imaged on the same day with use of the 2D static system: The MSOT signal unmixed for melanin as a correlate of the micrometastatic melanoma growth in these lymph nodes was found to correspond well when comparing the images derived from both systems. This is shown in a representative example in Figure 6.
Figure 6:
Images from 3D handheld tomography. MSOT images were acquired with use of a recently developed 3D handheld device and enabled detection of melanoma micrometastasis in popliteal lymph node basin (upper row) as well as a large in-transit metastasis at upper third of lower thigh distal to popliteal basin (lower row). The handheld device provides data in three different planes in near real time, with good correspondence to images acquired with static 2D tomographic system. A = anterior, C = caudal, MIP = maximum intensity projection, R = right. Arrows indicate popliteal vein and artery; 3D field of view corresponds to dashed box (not drawn to scale) on axial 2D images. MSOT images were unmixed for deoxygenated hemoglobin (blue), oxygenated hemoglobin (red), and melanin (yellow).
Discussion
In this study, we investigated the capabilities and limits of the emerging technology of MSOT to detect melanoma lymph node metastasis under controlled conditions based on an experimental melanoma lymph node metastasis model in comparison to FDG PET/CT as the current imaging modality of choice for the detection of melanoma metastasis. In direct comparison of the signal between the metastatic and contralateral healthy limb in vivo, we found MSOT not only to be able to (a) depict melanoma lymph node micrometastases that were too small to be detected with FDG PET/CT, but also to (b) depict even small clusters of metastatic melanoma cells that were “in transit” from the primary tumor site to the lymph node basin, solely based on the intrinsic optoacoustic contrast of melanin. In vitro, the limit of detection was determined to be in the range of merely a few melanoma cells per microliter in a tissue-mimicking phantom at 8 mm depth in this study, which is well in alignment with findings in previous optoacoustic studies (20,25,26).
Furthermore, we found the MSOT signal unmixed for melanin to be feasible for differentiating even small melanoma lymph node metastases from other lymphadenopathies such as lymphadenitis or other neoplasms such as breast cancerous lymph nodes. Conversely, because of the nonspecific uptake of FDG and limited resolution (22), FDG PET/CT failed to depict the melanoma metastases under those challenging circumstances and could not help differentiate them from a noncancerous inflammatorily enlarged node either. The specificity issue of FDG PET/CT is widely acknowledged in this regard (12). Recently, more specific 18F-based tracers targeted to melanin are subject to preclinical development, with the intention to potentially overcome this issue (27,28).
The ex vivo MSOT signal unmixed for melanin had been shown by others to correlate well with the melanoma cell infiltration in excised SLN in canines (17). This approach was recently found to also be feasible in human lymph nodes: In fact, in the first in-human study, MSOT was shown to reduce the false-negative rates in pathologic examination ex vivo (18). In vivo, MSOT has previously been demonstrated to depict melanin expression driven by a vaccinia virus in lymph nodes of mice (19). In fact, in the recent human study MSOT has been shown to decrease errors in identifying the SLN and facilitating the excision in up to 5 cm depth of subcutaneous tissue (18). However, the abilities of the MSOT technique to help detect melanoma micrometastatis or in-transit metastasis formation as well as the comparison to FDG PET/CT as the current standard of care had not yet been reported.
Our study had a number of limitations. The main disadvantage of MSOT is that the whole-body cross-sectional imaging approach based on a multidirectional illumination pattern as shown here remains physically limited to small animals. Its clinical translation in vivo requires the development of a handheld MSOT imaging approach similar to the use of a US probe in size and handling. Such hand-held probes were recently characterized in detail (20), were used in this study in mice, and have also been tested in humans (18). However, with the maximum raster scanning speed of approximately 3 mm/sec used in this study, the time needed to survey whole human limbs may limit its practicability. A further reduction of the laser frame rate and the set of wavelengths may increase its raster scanning speed. With regard to the limit of detection in vivo, one needs to keep in mind the function of tissue depth, its absorption and scattering characteristics, the illumination pattern, the field of sensitivity of the detector array, the spectral specificity, and the concentration of the compound to be unmixed: In this respect, it is unlikely that the very low detection threshold of a few cells per microliter that we measured in vitro can be achieved in humans if the lymph node in question is located several centimeters from the skin surface. Furthermore, the limit of detection is strongly associated with the individual level of the tumor’s melanin expression, which for the B16 cells is comparable to that of humans (29), but may lead to different results in other melanoma models. Other melanoma models may also vary in their degree of FDG uptake. Primary amelanotic melanoma, which occurs in humans and accounts for approximately 10% of all melanomas (30), is much less likely to be detectable with MSOT owing to its markedly lower or even absent melanin content. Another limitation of this study that must be acknowledged is the small number of animals that were examined, which did not allow us to quantify sensitivity and specificity of the technique in the detection of melanoma metastasis with a binary classification test. This should be subject to further studies.
Overall, our study demonstrated the intrinsic MSOT signal unmixed for melanin to be superior to FDG PET/CT in the detection of melanoma micrometastases and in-transit metastases in a B16F10 mouse model. It also shows the superiority of MSOT in differentiating melanoma metastases from other lymphadenopathies in mice in vivo.
Practical application: Once further validated in clinical trials, MSOT may be used in the future as a routine method to survey the nodal basin for the occurrence of melanoma metastases, even microscopic in size, and may potentially even make the routine SLN excision in node-negative patients obsolete. Furthermore, it may also potentially enable us to survey for early stage in-transit melanoma metastases that are currently missed with use of SLN techniques.
Advances in Knowledge
■ Multispectral optoacoustic tomography (MSOT) signal is indicative of lymph node micrometastasis from melanoma in vivo (n = 6, P < .01), whereas fluorine 18 fluorodeoxyglucose (FDG) PET/CT failed to help differentiate micrometastasis from a contralateral healthy control node (n = 6, P > .1).
■ MSOT signal is indicative of in-transit metastasis from melanoma in vivo (n = 4, P < .05), whereas FDG PET/CT failed to help differentiate in-transit metastasis from a healthy control node (n = 4, P > .1).
■ MSOT signal is highly disease specific for lymph node metastases from melanoma compared with other lymphadenopathies (n = 6, P < .05), whereas FDG PET/CT is not.
Implications for Patient Care
■ The readily translatable MSOT technique holds promise as a highly specific and sensitive label-free imaging approach for the in vivo detection of lymph node micrometastases from melanoma that are beyond the detection limit of FDG PET/CT.
■ MSOT has been shown to enable the detection of early-stage in-transit melanoma metastases; such in-transit metastases could represent one of the causes of false-negative nodal staging in the current standard of care, and their detection may potentially prevent a poor outcome in this proportion of patients with melanoma.
SUPPLEMENTAL FIGURE
Acknowledgments
Acknowledgments
We thank Pat Zanzonico and Valerie Longo, MSKCC Animal Imaging Core Facility, as well as Ning Fan, MSKCC Molecular Cytology Core Facility, for their technical support.
Received January 24, 2016; revision requested February 4 and received March 3; accepted March 11; final version accepted March 24.
The MSOT system was purchased with the help of a MSKCC Molecularly Targeted Intra-Operative Imaging Grant to M.F.K.. M.F.K. is a Damon Runyon-Rachleff Innovator supported (in part) by the Damon Runyon Cancer Research Foundation (DRR-29-14). M.F.K. supported by Pershing Square Sohn Cancer Research Alliance (Pershing Square Sohn Prize). M.F.K. supported by RSNA Research Scholar Grant. M.F.K. supported by MSKCC Center for Molecular Imaging and Nanotechnology Grant. M.F.K. and J.G. supported by Mr. William H. and Mrs. Alice Goodwin and the Commonwealth Foundation for Cancer Research and The Center for Experimental Therapeutics Center of Memorial Sloan Kettering Cancer Center. M.F.K. supported by MSKCC Technology Development Grant. M.F.K. supported by Geoffrey Beene Cancer Research Center Grant Award. M.F.K. and J.G. supported by Society of MSKCC Research Grant. V. Neuschmelting supported by Deutsche Forschungsgemeinschaft (DFG) Research Fellowship grant NE 1922/2-1. H.L. supported by Heinrich Hertz-Stiftung Research Fellowship Grant. Study was funded in part by NIH/NCI Cancer Center Support Grant P30 CA008748. M.F.K. supported by National Institutes of Health (R01 EB017748, K08 CA16396). J.G. supported in part by National Institutes of Health (1R01CA183953-01A1, R01EB014944).
Current address: Department of Neurosurgery, University Hospital Cologne, Cologne, Germany.
Current address: Department of Radiology, University Hospital Cologne, Cologne, Germany.
V. Neuschmelting and H.L. contributed equally to this work.
Disclosures of Conflicts of Interest: V. Neuschmelting disclosed no relevant relationships. H.L. disclosed no relevant relationships. V. Ntziachristos Activities related to the present article: is a shareholder in iThera Medical; is a consultant for iThera Medical. Activities not related to the present article: disclosed no relevant relationships. Other relationships: has patents issued; has patent licensed to SurgOptics. J.G. disclosed no relevant relationships. M.F.K. disclosed no relevant relationships.
Abbreviations:
- FDG
- fluorodeoxyglucose
- H-E
- hematoxylin-eosin
- ID
- injected dose
- MSOT
- multispectral optoacoustic tomography
- PBS
- phosphate-buffered saline
- SLN
- sentinel lymph node
- 3D
- three-dimensional
- 2D
- two-dimensional
- VOI
- volume of interest
References
- 1.Siegel R, Ma J, Zou Z, Jemal A. Cancer statistics, 2014. CA Cancer J Clin 2014;64(1):9–29. [DOI] [PubMed] [Google Scholar]
- 2.van Akkooi AC, Verhoef C, Eggermont AM. Importance of tumor load in the sentinel node in melanoma: clinical dilemmas. Nat Rev Clin Oncol 2010;7(8):446–454. [DOI] [PubMed] [Google Scholar]
- 3.Balch CM, Soong SJ, Gershenwald JE, et al. Prognostic factors analysis of 17,600 melanoma patients: validation of the American Joint Committee on Cancer melanoma staging system. J Clin Oncol 2001;19(16):3622–3634. [DOI] [PubMed] [Google Scholar]
- 4.Nieweg OE. False-negative sentinel node biopsy. Ann Surg Oncol 2009;16(8):2089–2091. [DOI] [PMC free article] [PubMed] [Google Scholar]
- 5.Nowecki ZI, Rutkowski P, Nasierowska-Guttmejer A, Ruka W. Survival analysis and clinicopathological factors associated with false-negative sentinel lymph node biopsy findings in patients with cutaneous melanoma. Ann Surg Oncol 2006;13(12):1655–1663. [DOI] [PubMed] [Google Scholar]
- 6.Scoggins CR, Martin RC, Ross MI, et al. Factors associated with false-negative sentinel lymph node biopsy in melanoma patients. Ann Surg Oncol 2010;17(3):709–717. [DOI] [PubMed] [Google Scholar]
- 7.Morton DL, Thompson JF, Cochran AJ, et al. Sentinel-node biopsy or nodal observation in melanoma. N Engl J Med 2006;355(13):1307–1317. [DOI] [PubMed] [Google Scholar]
- 8.Sondak VK, Zager JS. Who is to blame for false-negative sentinel node biopsies in melanoma? Ann Surg Oncol 2010;17(3):670–673. [DOI] [PMC free article] [PubMed] [Google Scholar]
- 9.Caracò C, Marone U, Celentano E, Botti G, Mozzillo N. Impact of false-negative sentinel lymph node biopsy on survival in patients with cutaneous melanoma. Ann Surg Oncol 2007;14(9):2662–2667. [DOI] [PubMed] [Google Scholar]
- 10.Carlson GW, Page AJ, Cohen C, et al. Regional recurrence after negative sentinel lymph node biopsy for melanoma. Ann Surg 2008;248(3):378–386. [DOI] [PubMed] [Google Scholar]
- 11.Kretschmer L, Bertsch HP, Zapf A, et al. Nodal basin recurrence after sentinel lymph node biopsy for melanoma: a retrospective multicenter study in 2653 patients. Medicine (Baltimore) 2015;94(36):e1433. [DOI] [PMC free article] [PubMed] [Google Scholar]
- 12.Xing Y, Bronstein Y, Ross MI, et al. Contemporary diagnostic imaging modalities for the staging and surveillance of melanoma patients: a meta-analysis. J Natl Cancer Inst 2011;103(2):129–142. [DOI] [PMC free article] [PubMed] [Google Scholar]
- 13.Schäfer-Hesterberg G, Schoengen A, Sterry W, Voit C. Use of ultrasound to early identify, diagnose and localize metastases in melanoma patients. Expert Rev Anticancer Ther 2007;7(12):1707–1716. [DOI] [PubMed] [Google Scholar]
- 14.Veit-Haibach P, Vogt FM, Jablonka R, et al. Diagnostic accuracy of contrast-enhanced FDG-PET/CT in primary staging of cutaneous malignant melanoma. Eur J Nucl Med Mol Imaging 2009;36(6):910–918. [DOI] [PubMed] [Google Scholar]
- 15.Fuster D, Chiang S, Johnson G, Schuchter LM, Zhuang H, Alavi A. Is 18F-FDG PET more accurate than standard diagnostic procedures in the detection of suspected recurrent melanoma? J Nucl Med 2004;45(8):1323–1327. [PubMed] [Google Scholar]
- 16.Taruttis A, Ntziachristos V. Advances in real-time multispectral optoacoustic imaging and its applications. Nat Photonics 2015;9(4):219–227. [Google Scholar]
- 17.McCormack D, Al-Shaer M, Goldschmidt BS, et al. Photoacoustic detection of melanoma micrometastasis in sentinel lymph nodes. J Biomech Eng 2009;131(7):074519. [DOI] [PubMed] [Google Scholar]
- 18.Stoffels I, Morscher S, Helfrich I, et al. Metastatic status of sentinel lymph nodes in melanoma determined noninvasively with multispectral optoacoustic imaging. Sci Transl Med 2015;7(317):317ra199. [DOI] [PubMed] [Google Scholar]
- 19.Stritzker J, Kirscher L, Scadeng M, et al. Vaccinia virus–mediated melanin production allows MR and optoacoustic deep tissue imaging and laser-induced thermotherapy of cancer. Proc Natl Acad Sci U S A 2013;110(9):3316–3320. [DOI] [PMC free article] [PubMed] [Google Scholar]
- 20.Neuschmelting V, Burton NC, Lockau H, et al. Performance of a multispectral optoacoustic tomography (MSOT) system equipped with 2D vs. 3D handheld probes for potential clinical translation. Photoacoustics 2016;4(1):1–10. [DOI] [PMC free article] [PubMed] [Google Scholar]
- 21.Burton NC, Patel M, Morscher S, et al. Multispectral opto-acoustic tomography (MSOT) of the brain and glioblastoma characterization. Neuroimage 2013;65:522–528. [DOI] [PubMed] [Google Scholar]
- 22.Bao Q, Newport D, Chen M, Stout DB, Chatziioannou AF. Performance evaluation of the Inveon dedicated PET preclinical tomograph based on the NEMA NU-4 standards. J Nucl Med 2009;50(3):401–408. [DOI] [PMC free article] [PubMed] [Google Scholar]
- 23.Rau FC, Weber WA, Wester HJ, et al. O-(2-[(18)F]Fluoroethyl)- L-tyrosine (FET): a tracer for differentiation of tumour from inflammation in murine lymph nodes. Eur J Nucl Med Mol Imaging 2002;29(8):1039–1046. [DOI] [PubMed] [Google Scholar]
- 24.van Akkooi AC, Nowecki ZI, Voit C, et al. Sentinel node tumor burden according to the Rotterdam criteria is the most important prognostic factor for survival in melanoma patients: a multicenter study in 388 patients with positive sentinel nodes. Ann Surg 2008;248(6):949–955. [DOI] [PubMed] [Google Scholar]
- 25.Galanzha EI, Kokoska MS, Shashkov EV, Kim JW, Tuchin VV, Zharov VP. In vivo fiber-based multicolor photoacoustic detection and photothermal purging of metastasis in sentinel lymph nodes targeted by nanoparticles. J Biophotonics 2009;2(8-9):528–539. [DOI] [PMC free article] [PubMed] [Google Scholar]
- 26.Galanzha EI, Shashkov EV, Spring PM, Suen JY, Zharov VP. In vivo, noninvasive, label-free detection and eradication of circulating metastatic melanoma cells using two-color photoacoustic flow cytometry with a diode laser. Cancer Res 2009;69(20):7926–7934. [DOI] [PMC free article] [PubMed] [Google Scholar]
- 27.Feng H, Xia X, Li C, et al. Imaging malignant melanoma with (18)F-5-FPN. Eur J Nucl Med Mol Imaging 2016;43(1):113–122. [DOI] [PubMed] [Google Scholar]
- 28.Liu H, Liu S, Miao Z, et al. A novel aliphatic 18F-labeled probe for PET imaging of melanoma. Mol Pharm 2013;10(9):3384–3391. [DOI] [PMC free article] [PubMed] [Google Scholar]
- 29.Watts KP, Fairchild RG, Slatkin DN, et al. Melanin content of hamster tissues, human tissues, and various melanomas. Cancer Res 1981;41(2):467–472. [PubMed] [Google Scholar]
- 30.Thomas NE, Kricker A, Waxweiler WT, et al. Comparison of clinicopathologic features and survival of histopathologically amelanotic and pigmented melanomas: a population-based study. JAMA Dermatol 2014;150(12):1306–1314. [DOI] [PMC free article] [PubMed] [Google Scholar]
Associated Data
This section collects any data citations, data availability statements, or supplementary materials included in this article.


