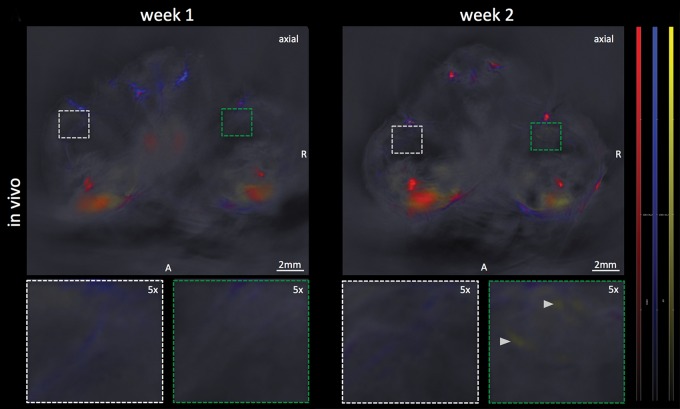
Figure 3a:
Limit of detection. (a) Axial MSOT images over time in same mouse shown in Figure 2 (representative of six mice), which was confirmed to bear a melanoma micrometastasis, 3 weeks after primary tumor inoculation. Although there was no sign of metastatic growth present in 1st week, subtle melanin signal (arrowheads) became detectable during 2nd week in right popliteal basin (green dashed box) as the earliest sign of beginning metastatic infiltration. MSOT images were unmixed for deoxygenated hemoglobin (blue), oxygenated hemoglobin (red), and melanin (yellow). Contralateral popliteal nodes served as healthy controls for comparison (white dashed boxes). A = anterior, R = right. (b) Graph shows melanin signal difference between ipsilateral and contralateral nodes over the course of 3 weeks. SEM = standard error of the mean. (c) In vitro MSOT images in tissue-mimicking phantom at 8 mm depth. Lowest density of live B16F10 melanoma cells in suspension that could be detected with MSOT were five cells per microliter PBS (images representative of triplicates, scale in MSOT signal unmixed for melanin in arbitrary units). Image saturation was reached at 1 × 10⁵ cells/μL. (d) Graph shows relationship between cell density and MSOT signal in comparison with PBS control. SD = standard deviation.

