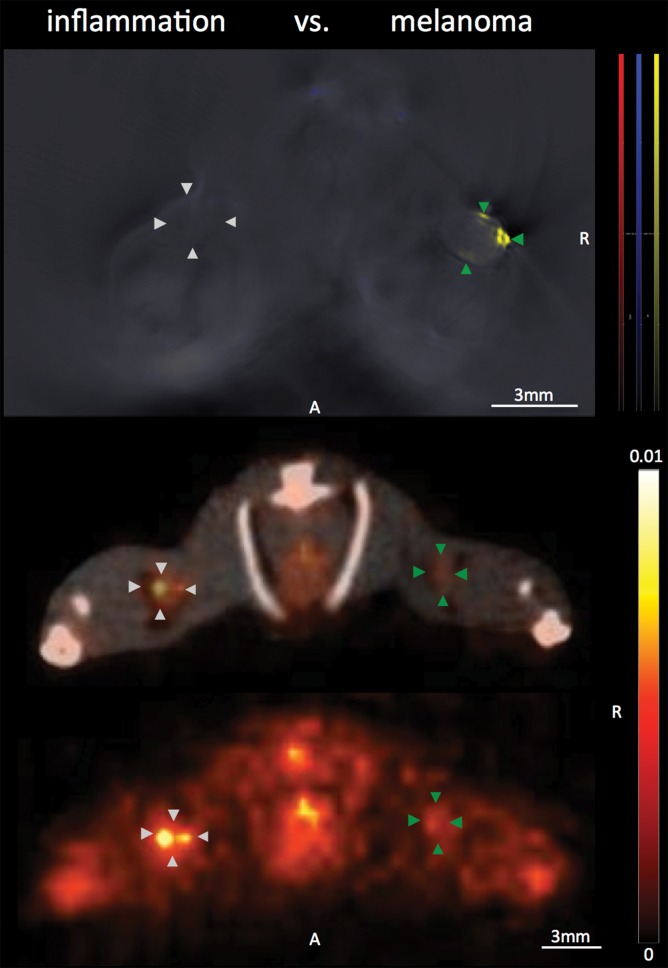
Figure 5c:
Disease specificity. (a, c) Axial MSOT and FDG PET/CT images of popliteal node basin in two mice within 3 weeks after being implanted with B16F10 melanoma cells on right foot and 4T1 breast cancer cells on left foot (a) or induction of a nodal inflammatory response (c). MSOT specifically revealed presence of small melanoma metastases in right popliteal nodes (green arrowheads). Conversely, FDG PET signal was found to be nonspecific for detecting melanoma metastases as it showed higher activity in left breast cancer–infiltrated node (signal ratio <1; representative of two mice; white arrowheads in a) as well as inflammatory node (signal ratio <1; representative of four mice; white arrowheads in c), respectively, compared with melanoma metastatic node (green arrowheads). MSOT images were unmixed for deoxygenated hemoglobin (blue), oxygenated hemoglobin (red), and melanin (yellow). FDG PET scale is in percentage ID per gram of tissue. A = anterior, R = right. (b, d) Bar charts show signal ratio in nodes infiltrated by breast cancer versus melanoma (b) and melanoma versus contralateral inflammatory nodes (d). Signal ratio equal to or below 1 is not sufficient for melanoma metastasis detection (gray shaded area). * = P < .05. SEM = standard error of the mean. (e) Photomicrographs (H-E stain) of presented lymphadenopathies confirm presence of 4T1 breast cancer lymph node metastases (left), typical appearance of melanin pigment in melanoma metastatic nodes (middle), and typical follicular hyperplasia of inflammatory nodes (right).

