

Abstract
Background
Cardiac magnetic resonance (CMR) can quantify myocardial infarct (MI) size and myocardium at risk (MaR), enabling assessment of myocardial salvage index (MSI). We assessed how MSI impacts the number of patients needed to reach statistical power in relation to MI size alone and levels of biochemical markers in clinical cardioprotection trials and how scan day affect sample size.
Methods and Results
Controls (n=90) from the recent CHILL‐MI and MITOCARE trials were included. MI size, MaR, and MSI were assessed from CMR. High‐sensitivity troponin T (hsTnT) and creatine kinase isoenzyme MB (CKMB) levels were assessed in CHILL‐MI patients (n=50). Utilizing distribution of these variables, 100 000 clinical trials were simulated for calculation of sample size required to reach sufficient power. For a treatment effect of 25% decrease in outcome variables, 50 patients were required in each arm using MSI compared to 93, 98, 120, 141, and 143 for MI size alone, hsTnT (area under the curve [AUC] and peak), and CKMB (AUC and peak) in order to reach a power of 90%. If average CMR scan day between treatment and control arms differed by 1 day, sample size needs to be increased by 54% (77 vs 50) to avoid scan day bias masking a treatment effect of 25%.
Conclusion
Sample size in cardioprotection trials can be reduced 46% to 65% without compromising statistical power when using MSI by CMR as an outcome variable instead of MI size alone or biochemical markers. It is essential to ensure lack of bias in scan day between treatment and control arms to avoid compromising statistical power.
Keywords: acute myocardial infarction, biochemical markers, cardioprotection, myocardial salvage index, sample size
Subject Categories: Clinical Studies, Cardiovascular Disease, Myocardial Infarction, Magnetic Resonance Imaging (MRI), Percutaneous Coronary Intervention
Introduction
Ischemic heart disease is one of the leading causes of morbidity and mortality in the Western world. Myocardial infarction (MI) typically results from a coronary occlusion as a consequence of a ruptured vulnerable coronary plaque.1 As the duration of the coronary occlusion is prolonged, the greater the proportion of the ischemic myocardium, referred to as myocardium at risk (MaR), will develop into MI.2 Thus, in the situation of acute coronary occlusion, the goal is to reperfuse the ischemic myocardium as soon as possible to maximize myocardial salvage.
In the current era of acute reperfusion therapy, a fast and effective revascularization helps many patients by preventing MaR from developing into MI. Acute reperfusion therapy is, however, associated with a variable degree of reperfusion injury.3, 4 Several attempts have been made to develop adjuvant therapies to complement acute reperfusion therapy in order to minimize reperfusion injury.5, 6, 7, 8 Traditionally, surrogates of MI size, such as levels of biochemical markers, have often been used as endpoints in cardioprotection trials. The role of cardiac imaging for determination of MI size as an endpoint in cardioprotection trials has previously been debated.9, 10, 11 Currently, cardiac magnetic resonance (CMR) with late gadolinium enhancement (LGE) is considered to be the reference standard for in vivo detection and quantification of MI.12 Because of the high reproducibility and accuracy for quantification of MI, CMR has been used in several clinical studies to assess MI size as an outcome variable.5, 8, 13, 14, 15 It has, however, been shown that the timing of the CMR examination is important for accurate determination of MI size during the first week after acute MI (AMI).16, 17
Methodological variability in measuring MI size is typically much smaller than variability of actual MI size between patients depending on pathophysiological factors such as location of the coronary occlusion, which determines MaR.9 Thus, although MI size might serve as a predictor of postinfarction LV remodeling and patient prognosis,18, 19 there is a need to relate MI size to MaR when evaluating efficacy of acute cardioprotective therapies. Taking MaR into account and thereby determining myocardial salvage index (MSI=1−MI/MaR) might decrease variability of treatment effect and, consequently, the number of patients needed to reach sufficient statistical power.
Recently, CMR has been shown to enable determination not only of MI size, but also MaR and thereby enabling assessment of MSI using contrast‐enhanced steady‐state free precession (CE‐SSFP) imaging.20, 21
The primary aim of this study was to determine how assessment of MSI by CMR will impact the number of patients needed to reach sufficient statistical power in relation to MI size alone and levels of biochemical markers. The secondary aim was to determine how differences in CMR scan day affect the number of patients needed to reach sufficient statistical power.
Methods
Study Population and Design
Patients from the control arms of 2 recently published multicenter clinical cardioprotection trials (CHILL‐MI22 and MITOCARE23, 24; n=90 patients from 17 centers) and patients from a previous serial 1‐year follow‐up study after first‐time MI (n=22)16 were included in the study. The inclusion and exclusion criteria for the different studies have previously been described16, 22, 23, 24 (Table 1). In short, all patients from the 3 studies had clinical signs of AMI defined as clinical symptoms, ST‐elevation, and elevated biochemical markers. All patients underwent acute percutaneous coronary intervention (PCI). Patients with previous infarction or history of coronary revascularization were excluded. The study complies with the Declaration of Helsinki, and all patients gave their written informed consent to participate in the study, which was approved by appropriate ethics committees for each country in which patients were included.
Table 1.
Characteristics of the Trials Included in the Present Study
| CHILL‐MI22 | MITOCARE24 | Serial Follow‐up Study16 | |
|---|---|---|---|
| Study design | Prospective, multicenter, randomized study; 1:1 randomization to hypothermia or standard care | Prospective, multicenter, randomized study; 1:1 randomization to TRO40303 or placebo | Prospective clinical exploratory trial |
| Inclusion criteria | |||
| Infarct charactersitics | First‐time myocardial infarction | First‐time myocardial infarction | First‐time myocardial infarction |
| ECG criteria | Anterior: ST elevation >0.2 mV in 2 contiguous leads Inferior: ST depression in 2 contiguous anterior leads for a total ST‐segment deviation (inferior ST‐segment elevation plus anterior ST‐segment depression) of 0.8 mV | ST elevation ≥0.2 mV in men or ≥0.15 mV in women in leads V2 to V3 and/or ≥0.1 mV in other lead | Clinical diagnosis of ST elevation myocardial infarction |
| Duration of symptoms | <6 hours | <6 hours | No predefined time limit |
| Primary endpoint | Myocardial salvage index by CMR | Biochemical marker relsease | Exploring infarct resorption by serial CMR examinations during the first year after infarction |
| Exclusion criteria | Cardiac arrest, previous AMIs, previous PCI or coronary artery bypass grafting, known congestive heart failure, end‐stage kidney disease or hepatic failure, recent stroke, coagulopathy, pregnancy, or Killip class II to IV | Cardiac arrest, ventricular fibrillation, cardiogenic shock, stent thrombosis, a previous acute myocardial infarction, angina within 48 hours before infarction, previous coronary artery bypass graft, intravenous fibrinolytic therapy within 72 hours before PCI, atrial fibrillation, had a pacemaker, concurrent inflammatory, infectious, or malignant disease, or a biliary obstruction or hepatic insufficiency | Past infarction, past PCI or CABG, TIMI flow >0 at admission, contraindication for CMR, clinical instability, reinfarction, or coronary intervention during the follow‐up period |
AMI indicates acute myocardial infarction; CABG, coronary artery bypass graft; CMR, cardiac magnetic resonance; ECG, electrocardiogram; PCI, percutaneous coronary intervention; TIMI, Thrombolysis in Myocardial Infarction.
CMR Imaging
All CHILL‐MI and MITOCARE patients included in the present study underwent CMR 2 to 6 days after the acute event. In the serial follow‐up study, all patients underwent CMR 1 and 7 days after the acute event in order to study changes in infarcted myocardium during this time period. All patients were imaged on a 1.5 Tesla magnetic resonance (MR) system either from Siemens (Erlangen, Germany), Philips (Best, The Netherlands), or GE Healthcare (Waukesha, WI).
CHILL‐MI and MITOCARE
For patients in the CHILL‐MI and MITOCARE22, 24 trials, initial scout images were acquired to locate the heart. For visualization of MaR, multislice, multiphase CE‐SSFP images were acquired ≈5 minutes after intravenous administration of a gadolinium‐based extracellular contrast agent (0.2 mmol/kg). CE‐SSFP images were acquired in 2‐, 3‐, and 4‐chamber views as well as in short‐axis view covering the left ventricle (LV) from base to apex. Slice thickness was 8 mm with no slice gap. In‐plane resolution was typically 1.5×1.5 mm, and temporal resolution was 20 to 30 frames per cardiac cycle. For infarct visualization, LGE images corresponding to CE‐SSFP images were acquired ≈15 minutes after injection of gadolinium. LGE‐images were acquired using an inversion‐recovery gradient‐recalled echo sequence with a slice thickness of 8 mm with no slice gap. In‐plane resolution was typically 1.5×1.5 mm. Inversion time was manually adjusted to null the signal from viable myocardium.
For the serial follow‐up study,16 typical imaging parameters were slice thickness of 8 to 10 mm with no slice gap and in‐plane‐resolution 1.4 to 1.5×1.4 to 1.5 mm.
CMR Analysis
All image analyses were performed using the software, Segment (http://segment.heiberg.se).25
All image analysis was performed by Imacor AB as a core lab service in both trials. Analysis of MaR and MI size was done according to previously described methodology.20, 26, 27
Myocardium at Risk
MaR was assessed from CE‐SSFP short‐axis images from patients in the CHILL‐MI and MITOCARE trials according to a previously described methodology.20 In short, endocardial and epicardial borders of the LV were traced in all short‐axis slices both in end diastole and end systole, followed by manual delineation of the hyperintense myocardium in both time frames. Papillary muscles were excluded from the myocardium. The MaR was then defined as the total amount of hyperintense myocardium in all short‐axis slices and expressed as percentage of LV. If present, hypointense myocardium within the area of increased signal intensity (microvascular obstruction) was included in the MaR.
Infarct size
In the CHILL‐MI and MITOCARE studies, the infarcted myocardium was automatically quantified from the short‐axis LGE images according to a previously validated method.26 In short, the endocardial and epicardial borders were traced manually with exclusion of the papillary muscles, after which the infarcted myocardium was defined using a computer algorithm taking partial volume effects within the hyperenhanced myocardium into consideration. Manual adjustments were made when the computer algorithm was obviously wrong. For the serial follow‐up study, MI size was assessed using a previously described semiautomatic infarct sizing method.27 If present, a hypointense signal within the area of LGE (microvascular obstruction) was included in the analysis as 100% infarction. Finally, MI size was expressed as a percentage of the LV.
Myocardial salvage index was calculated as 1−(MI size/MaR).
Biochemical Markers
For biochemical markers analysis, data from the CHILL‐MI controls were used because that included serial sampling well suited for calculation of area under the curve (AUC) as a cumulative measure of biomarker release. Thus, high‐sensitivity troponin T (hsTnT) and creatine kinase isoenzyme MB (CKMB) were sampled on admission to the catheterization laboratory and at 12, 24, and 48 hours after admission. Peak values were defined as the highest measured value within 24 hours, and AUC was calculated from the serial measurements.
Statistical Analysis
Data are expressed as mean±SD.
Power calculation
To estimate the power of a hypothetical trial for a different number of patients in each arm and different treatment effects, a Monte Carlo simulation was developed based on the distribution measured from the clinical trials. Data from the MITOCARE and CHILL‐MI trials were used to calculate distributions for MI size and MaR for the virtual patients used in the simulations. For calculation of distribution of hsTnT, data from the CHILL‐MI trial was used. Distributions were estimated by calculating cumulative probability distribution for each measured variable (1−MSI, MI size, hsTnT [AUC], hsTnT [peak], CKMB [AUC], and CKMB [peak]). We use 1−MSI=MI/MaR to simplify comparisons because this measure decreases with larger effect size in accordance with MI size and biochemical markers. Cumulative distribution was fitted with smoothed cubic spline interpolation. In the simulations, a treatment effect of 25% was defined as a decrease in infarct size by 25% with no treatment effect on MaR. The rationale for this assumption was that a cardioprotective treatment would affect the development of infarction, whereas MaR would be determined by the site of the culprit lesion independent of treatment.
A set of virtual patients were created for each variable using the estimated cumulative probability distributions and randomized to either the control or treatment group in simulated trials designed to take each variable alone as an outcome variable. For the treated cases, a fixed treatment effect λ was assumed to affect the outcome variable with the factor (1−λ) also decreasing the variability in this group, which was taken into account in the sample‐size calculations.
The number of patients N in each arm was tested in the range 1 to 160 in steps of 3 for N<100 (1, 4, 7, 10 … . ) and in steps of 10 for N>100 (100, 110, 120, 130…. ). The different incremental steps were used to reduce the computational burden. For each combination of number of patients N and treatment effect λ, 100 000 simulated clinical trials were performed. Statistical power of each combination of N and λ was calculated as the number of positive trials divided by the total number of trials. In order to determine the number of patients required for each group to reach a statistical power of 90%, an iterative line search algorithm was performed with 10 000 trials in each iteration and 100 000 in the last calculation step to accurately define the number of patients needed.
The above simulation results were compared with (1) the same simulations assuming normal distribution and fixed SD of both controls and treatment groups of the outcome variables and (2) with sample‐size calculation using a conventional power calculator based on analytical expressions and not Monte Carlo simulations (ClinCalc.com).
In order to determine impact of scan day on MSI during the first week after infarction, an additional dedicated simulation was performed. The average decrease in hyperenhanced myocardium has previously been shown to be ≈25% during the first week after an acute infarction.16 Assuming that the infarct size decreases linearly over time, the effect of scan day on sample size was calculated by determining the masking effect of differences in scan days between treatment and control arms. If scanning the treatment group on day 4 (on average), and the control group, on average, 0, 0.5, 1, and 1.5 days later, the masking effect would be 0%, 2.2%, 4.4%, and 6.8%, respectively. The masking effect was introduced by decrease in infarct size over time.
Simulations and statistical preprocessing was implemented in Matlab software (R2011a; The MathWorks, Inc., Natwick, MA). The simulation software is available upon request.
Results
Patient characteristics for the study population have previously been described in the original CHILL‐MI and MITOCARE articles.16, 22, 24 Mean±SD for the different outcome variables are shown in Table 2.
Table 2.
Mean and SD of the Different Outcome Variables in Control Subjects Undergoing CMR From the CHILL‐MI and MITOCARE Trials
| Parameter | N | Mean±SD | CoV (%) |
|---|---|---|---|
| MSI | 90 | 54.0±19.4 (%) | 36 |
| Infarct size | 90 | 17.4±10.5 (%LV) | 60 |
| hsTnT AUCa | 50 | 192 110±119 410 (μg×h/L) | 62 |
| hsTnT peaka | 50 | 6980±4880 (μg/L) | 70 |
| CKMB AUCa | 50 | 5180±3900 (μg×h/L) | 75 |
| CKMB peaka | 50 | 273±208 (μg/L) | 76 |
AUC indicates area under the curve; CKMB, creatine kinase isoenzym MB; CoV, coefficient of variation (SD/mean); hsTnT, high‐sensitivity troponin T; LV, left ventricle; MSI, myocardial salvage index.
Biochemical markers are from the control patients in the CHILL‐MI trial.
Myocardial Salvage Index Versus MI Size Alone and Biochemical Markers
Figure 1 shows the relationship between sample size and statistical power with different expected treatment efficacy for 1‐MSI (Figure 1A) and MI size alone (Figure 1B). Figure 2 shows the relationship between sample size and statistical power with different treatment efficacy for hsTnT (AUC and peak; Figure 2A and 2B) and CKMB (AUC and peak; Figure 2C and 2D). Thus, the number of patients required in each treatment arm decreased by 46% (50 vs 93), 49% (50 vs 98), 58% (50 vs 120), 65% (50 vs 141), and 65% (50 vs 143) when comparing 1−MSI to MI size alone, hsTnT (AUC), hsTNT (peak), CKMB (AUC), and CKMB (peak), respectively (Table 3). Sample size for a simulated treatment effect of 25% assuming normal distribution of the outcome variable as well as using a conventional, freely available power calculator (ClinCalc.com) are shown in Table 4. Distributions of the different outcome variables are shown in Figure 3. Figure 4 shows an example of 2 patients with similar MI size, but significantly different MSI and, consequently, significantly different effect of acute reperfusion therapy. The bias of effect‐size estimate (defined as 1 minus the mean of the outcome variable for the treatment group divided by the mean of the control group) in the simulations were small, and for the example of true effect size of 25% in Table 4, the treatment effect was underestimated by 0.22 to 0.29 percentage units for the different outcome variables. The largest bias was observed for hsTnT (peak), where the measured effect size was 24.71% versus the true effect size of 25%.
Figure 1.
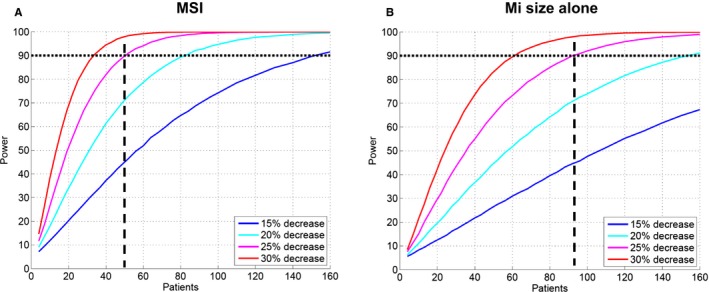
Difference in number of patient needed per treatment arm for different expected treatment effects when using (A) MSI and (B) MI size alone in order to reach sufficient statistical power. Two‐sided probability α=0.05 of type 1 error was assumed. Dashed lines indicate the number of patients needed in each treatment arm to detect a decrease of 25% in outcome variables. MaR indicates myocardium at risk; MI, myocardial infarction; MSI, myocardial salvage index.
Figure 2.
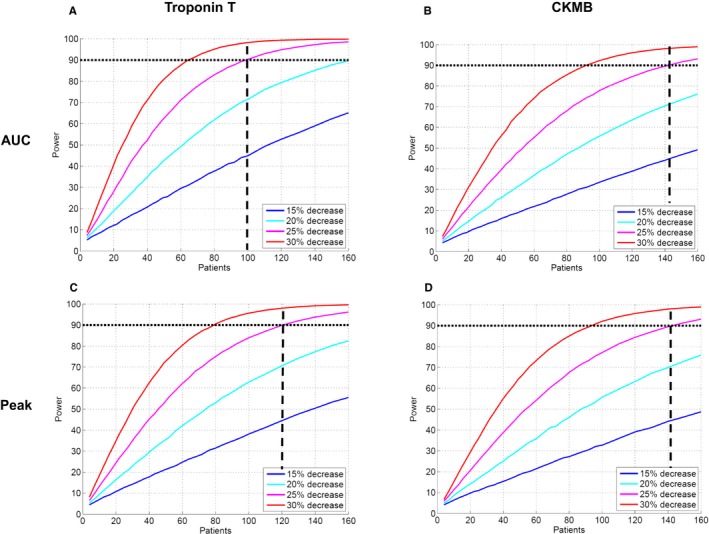
Difference in number of patients needed per treatment arm for different expected treatment effects when using (A) AUC hsTnT (B), AUC CKMB (C), peak hsTnT, and (D) peak CKMB in order to reach sufficient statistical power. Two‐sided probability α=0.05 of type 1 error was assumed. Dashed lines indicate the number of patients needed in each treatment arm to detect a decrease of 25% in outcome variables. AUC indicates area under the curve; CKMB, creatine kinase isoenzyme MB; hsTnT, high‐sensitivity troponin T; MaR, myocardium at risk; MI, myocardial infarction.
Table 3.
Number of Patients Required in Each Arm to Reach a Power of 90% Depending on Estimated Treatment Effect
| Parameter | Treatment Effect | |||
|---|---|---|---|---|
| 15% | 20% | 25% | 30% | |
| MSI | 152 | 82 | 50 | 34 |
| Infarct size by LGE | 287 | 153 | 93 | 61 |
| hsTnT AUCa | 303 | 162 | 98 | 65 |
| hsTnT peaka | 375 | 199 | 120 | 79 |
| CKMB AUCa | 441 | 234 | 141 | 92 |
| CKMB peaka | 444 | 236 | 143 | 93 |
AUC indicates area under the curve; CKMB, creatine kinase isoenzym MB; hsTnT, high‐sensitivity troponin T; LGE, late gadolinium enhancement; LV, left ventricle; MSI, myocardial salvage index.
Biochemical markers are from the control patients in the CHILL‐MI trial.
Table 4.
Number of Patients Required in Each Arm to Reach a Power of 90% With a Treatment Effect of 25% Depending Sample‐Size Calculation Method
| Parameter | Monte Carlo Simulation Current Study (N) | Monte Carlo Simulation Assuming Normal Distribution (N) | Sample‐Size Calculation by Statistical Softwarea (N) |
|---|---|---|---|
| MSI | 50 | 43 | 43 |
| Infarct size | 93 | 122 | 122 |
| hsTnT AUCb | 98 | 130 | 130 |
| hsTnT Peakb | 120 | 164 | 164 |
| CKMB AUCb | 141 | 191 | 191 |
| CKMB Peakb | 143 | 197 | 197 |
AUC indicates area under the curve; CKMB, creatine kinase isoenzym MB; hsTnT, high‐sensitivity troponin T; LGE, late gadolinium enhancement; LV, left ventricle; MSI, myocardial salvage index.
ClinCalc.com (http://clincalc.com/Stats/SampleSize.aspx), which uses analytical formulas as opposed to Monte Carlo simulations.
Biochemical markers are from the control patients in the CHILL‐MI trial.
Figure 3.
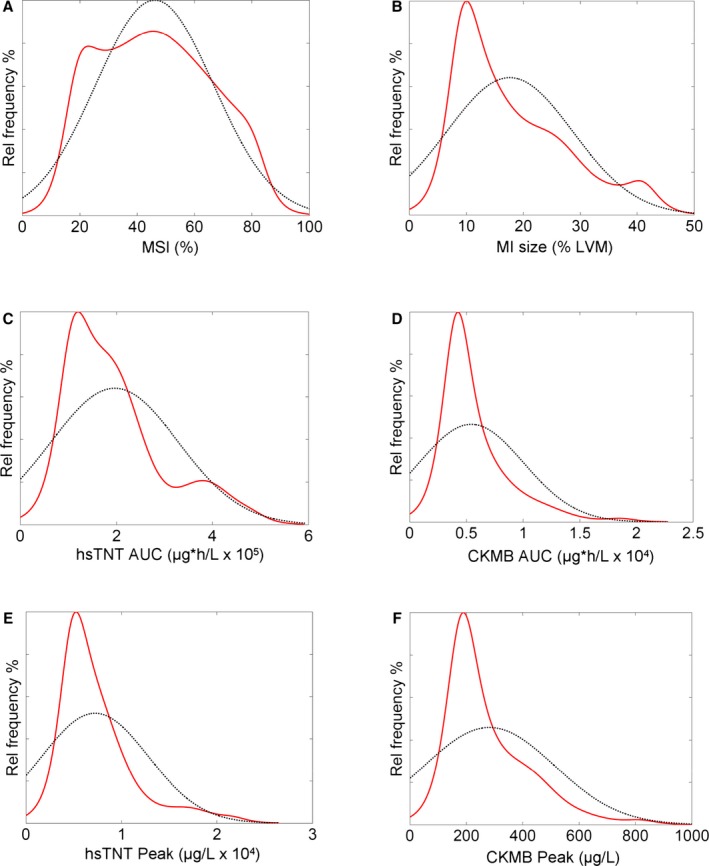
Distribution of MSI (A), MI size (B), hsTNT AUC (C), CKMB AUC (D), hsTNT peak (E), and CKMB peak (F). Dashed black lines represent the Gaussian distribution assuming that the variables were normally distributed. Red lines represent the actual distribution of the outcome variables in the pooled control subjects from the CHILL‐MI and MITOCARE cardioprotection trials. No variable, except MSI (A), was normally distributed. Thus, performing a power analysis, based on the assumption that the outcome variable is normally distributed, will provide different results compared to the Monte Carlo simulation performed in the present study, which takes the actual distribution into consideration for sample‐size calculation. AUC indicates area under the curve; CKMB, creatine kinase isoenzyme MB; hsTnT, high‐sensitivity troponin T; LVM, left ventricular mass; MI, myocardial infarction; MSI, myocardial salvage index.
Figure 4.
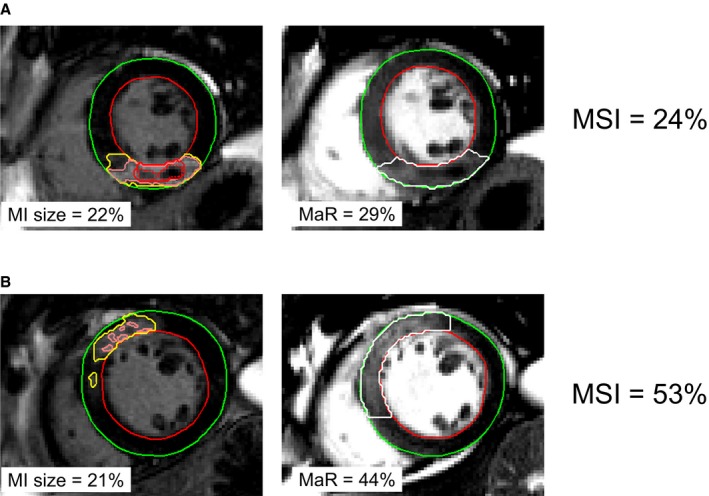
Two patient examples showing the impact of relating MI size to MaR when evaluating the efficacy of acute reperfusion therapy. A, An example of patient with MI in the inferior LV wall attributed to occlusion of the right coronary artery. B, An example of a patient with MI in the anteroseptal LV wall attributed to occlusion of the left anterior descending artery. The endocardial borders are delineated in red and the epicardial borders in green. Left panel shows mid‐ventricular short‐axis late gadolinium enhancement images with the infarcted myocardium defined within the yellow delineation. Pink lines represent pixel weighted used for infarct quantification. Red lines indicate microvascular obstruction. Right panel shows corresponding mid‐ventricular short‐axis contrast‐enhanced SSFP images with the MaR delineated in white. Note the similar infarct size (22% and 21% of the LV), but the significantly different MSI (24% vs 53%) attributed to different MaR. Thus, efficacy of acute reperfusion therapy was approximately double in (B) compared to (A) despite similar MI size. LV indicates left ventricle; MaR, myocardium at risk; MI size, myocardial infarct size; MSI, myocardial salvage index; SSFP, steady‐state free precession.
Impact of Scan Day on Sample Size
Figure 5 shows the impact of scan day during the first week after AMI on the sample‐size increase needed to avoid making a type 2 error of falsely rejecting an effective treatment of 25% by the bias introduced by difference in scan day. The decrease in hyperenhanced myocardium that has been shown to occur during the first week after infarction is shown in Figure 5A and 5B.16 The number of patients needed in each arm of a trial with an assumed treatment effect of 25% is shown in Figure 5C. In order to reach statistical significance with a power of 90, the number of patients in each arm would have to be increased by 22% (50 vs 61), 54% (50 vs 77), and 100% (50 vs 100) for an average scan day difference of 0.5, 1, and 1.5 days, respectively, to avoid being masked by the bias caused by difference in scan day. For the CHILL‐MI and MITOCARE trials, there was no difference in scan day when comparing patients in the treatment arm to controls (3.8±1.5 vs 3.6±1.6 [P=0.60] and 3.9±1.2 vs 3.9±1.2 [P=0.85]).
Figure 5.
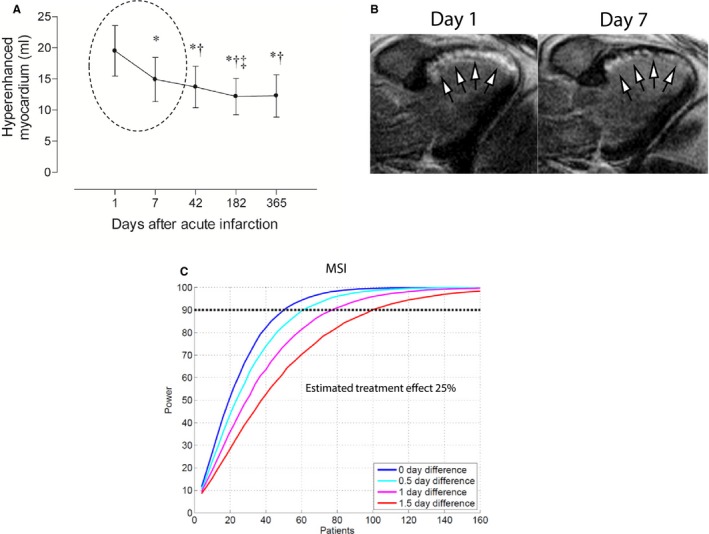
Sensitivity analysis for impact of timing of CMR examination after an acute MI. A, Decrease in hyperenhanced myocardium observed with LGE CMR over the first year in patients with reperfused after first‐time MI as shown by Engblom et al.16 Note the significant decrease observed during the first week after infarction (dashed circle). This is illustrated in (B) by a 3‐chamber LGE image from a patient with an anteroseptal MI (arrows) attributed to an acute proximal LAD occlusion.16 Note the significant reduction of the hyperenhanced myocardium observed between days 1 and 7. C, The increase in sample size needed to avoid committing a type 2 error of rejecting true treatment effect of 25% masked by bias introduced by difference in scan day. CMR indicates cardiovascular magnetic resonance; MaR, myocardium at risk; LAD, left anterior descending artery; LGE, late gadolinium enhancement; MI size, myocardial infarct size; MSI, myocardial salvage index.
Discussion
This study is, to our knowledge, the first study using multicenter cardioprotection data to explore the impact on sample size when considering MSI assessed by CMR as an outcome variable taking scan day into consideration. Sample size needed to reach sufficient statistical power can be reduced significantly when using MSI determined by CMR compared to MI size alone or biochemical markers (hsTnT and CKMB). Furthermore, it is important to ensure that the average scan day is similar between the treatment and control arms to avoid infarct size bias between the groups. A bias between the groups may mask the treatment effect, and increased sample size would be needed for sufficient statistical power or, alternatively, may lead to incorrect conclusion of the trial.
Use of simulations for clinical trials to evaluate sensitivity in trial designs is not new.28 The current study adds to the notation that simulations of clinical trials are a powerful method to systematically and scientifically investigate clinical trial designs. The presented methodology to use simulations of clinical trial scenarios as an aid in clinical trial design is a highly generalizable approach, even in a nonimaging context, to make informed design decisions to balance risks, uncertainties, feasibility, and costs. The slight bias in effect‐size estimates revealed in the simulations can be understood both by the uneven distribution in the outcome variables combined with the fact that the effect‐size estimator is nonlinear (1 minus the ratio between the mean of the treated subject over the control subjects). For treatment effect models where the treatment is additive and the effect‐size operator is linear, the bias would be zero.
Therapeutic Efficacy Versus Prognostic Significance
In phase I and II clinical trials of cardioprotection therapies, the main outcome variable is the efficacy of the therapy tested and are aimed at confirming or rejecting the biological effect caused by the treatment. MI size has been shown to be an important prognostic factor in patients that have suffered from AMI, superior to LV ejection fraction and volumes.19, 29, 30 In order to assess therapeutic efficacy, however, MI size alone has limited value given that it does not reveal information about the amount of myocardium that was initially at risk (MaR) of developing infarction. Therefore, 2 patients with similar infarct size and possibly similar prognosis might have had significantly different effect of the acute therapy (MSI) depending on differences in MaR, as exemplified in Figure 4. Thus, fewer patients, shorter time, and potentially lower costs would be required to show the therapeutic effect of a new cardioprotective treatment when using MSI as a surrogate endpoint in phase I and II cardioprotection trials.
The Use of CE‐SSFP for Determination of MaR
For both the CHILL‐MI and MITOCARE trials, CE‐SSFP was used for determination of MaR. CE‐SSFP has previously been validated against myocardial perfusion single‐photon emission computed tomography.20 This technique has been shown to strongly correlate to T2‐weighted imaging for MaR in a single‐center setting.21 Both CE‐SSFP and T2‐weighted imaging can be applied at least up to 1 week after the acute event.20, 31 Applicability of CE‐SSFP for assessment of MaR in a multicenter, multivendor trial has also been shown to be high, whereas T2‐weighted imaging performs less well in this situation.32 The difficulty of optimal implementation of T2‐weighted imaging for MaR in some settings is confirmed with the findings by Kim et al.,33 who showed a poor agreement between MaR by T2‐weighted imaging and histopathology.
Impact of Scan Day on Sample Size
It has been shown, both experimentally34, 35 and clinically,16, 17 that characteristics of ischemically injured myocardium change over time after an acute ischemic episode, including recovery of the reversibly injured peri‐infarction zone.36, 37 This needs to be taken into consideration when designing cardioprotection trials using MI size by CMR as an endpoint. If, for some reason, there is a systematic difference in scan day between the control and treatment arms in a clinical cardioprotection trial using CMR to assess MI size and MSI, both type 1 and 2 errors can be made. If the patients in the treatment arm happen to be examined, on average, later than in the control arm, smaller infarcts and higher MSI could result from the natural decrease in hyperenhanced myocardium occurring during this time and not because of therapeutic effect and vice versa. Note that for small treatment effects, the bias in scan day will overcome the treatment effect, and regardless of the number of patients included in the study, the result would still be erroneous. Also note that any systematic bias with regard to scan day will cause errors in the estimated treatment effect for the trial. One way to avoid scan day bias acutely would be to scan the patients at a later time point (ie, at 30 days postinfarction). Still, this approach would require a larger study population because MaR cannot be assessed at this time point, enabling calculation of myocardial salvage. Thus, 2 patients with similar infarct size at 30 days might have had significantly different MaR and therefore significantly different myocardial salvage, which cannot be assessed at this time point.
Ethical and Health Economy Considerations
From an ethical perspective, it is important to ensure effective clinical trial designs to minimize the number of patients exposed to potential harmful treatments. This includes the use of the best possible surrogate biomarkers for evaluation of therapeutic efficacy. This also decreases the risk of committing type 2 errors by rejecting therapies that could actually benefit patients, but fail to show statistical significant effects attributed to use of suboptimal endpoints or ways of estimating sample size needed to reach sufficient statistical power, as shown in Table 4. This translates into increased trial costs. Although a CMR examination is more expensive than, for example, analysis of biochemical markers, the use of CMR for assessment of MSI as an outcome variable in clinical cardioprotection trials could potentially reduce trial costs attributed to the reduced number of patients needed to reach sufficient statistical power. There is no additional time or costs required for acquiring CE‐SSFP images that enable determination of MaR and, consequently, MSI by relating MaR to MI size. Still, CMR is not available at all centers, whereas biochemical markers can be sampled at the point of care at most hospitals, making biochemical markers a more widely available endpoint, which needs to be taken into consideration when designing a clinical trial. Further modeling of clinical trial design would enable calculation of the difference in trial costs using MSI by CMR versus a more traditional approach with biochemical markers, knowing that use of biochemical markers will increase sample size and use of CMR will increase the cost per patient and, potentially, the complexity of the study. This was, however, beyond the scope of the present study.
Use of Monte Carlo Simulations for Designing Clinical Trials
Use of Monte Carlo simulation for calculation of sample size can be used to design not only imaging trials. Using Monte Carlo simulations, it is possible to take into consideration the distribution of the outcome variable to be tested, that is, biochemical markers as shown in the present study (Table 4). If the outcome variable is not normally distributed, a sample‐size calculation based on mean and coefficient of variation of the variable will lead to trial design errors. From Table 4, it is clear that sample size may be both under‐ and overestimated when using normal distribution assumptions instead of realistic distributions.
Limitations
The findings in the present study should be considered in light of some limitations. The patients included in the study have been examined on different MR scanners from different vendors with different implementation of the MR sequences used. These differences may influence the variability in the data because of technical variability other than biological variability. This, however, resembles the conditions for a multicenter trial involving sites with different CMR systems from different vendors, increasing the generalization of the findings.
The decrease in infarct size between days 1 and 7 after acute infarction was treated as linear. This is, however, an assumption, because there are no data on the temporal evolution of hyperenhancement by LGE during the first week post infarction.
Conclusions
Sample size can be reduced by 46% to 65% without compromising statistical power when using MSI determined by CMR as an outcome variable compared to MI size or biochemical markers. Furthermore, it is important to avoid differences in scan days between control and treatment arms in clinical CMR cardioprotection trials.
Sources of Funding
The CHILL‐MI study was funded by Philips Healthcare (San Diego, CA), and the MITOCARE project was supported by the European Union under the 7th Framework Programme for RTD—Project MITOCARE—Grant Agreement HEALTH‐2010‐261034. Furthermore, this study was supported by the Swedish Research Council (Stockholm, Sweden), the Swedish Heart Lung Foundation (Stockholm, Sweden), and the Medical Faculty at Lund University (Lund, Sweden).
Disclosures
H.A., E.H., M.C., and H.E. have been part time employees in Imacor AB. Arheden is shareholder of Imacor AB. D.E. has received speaker's honoraria from Philips and ZOLL.
Acknowledgment
This project is indebted to all study personnel that made this research possible as well as all the patients who participated.
(J Am Heart Assoc. 2016;5:e002708 doi: 10.1161/JAHA.115.002708)
Results from this study have been presented as an abstract at the Society for Cardiovascular Magnetic Resonance (SCMR) Scientific Sessions, February 5–7, 2015 in Nice, France.
References
- 1. Libby P. Molecular bases of the acute coronary syndromes. Circulation. 1995;91:2844–2850. [DOI] [PubMed] [Google Scholar]
- 2. Hedstrom E, Engblom H, Frogner F, Astrom‐Olsson K, Ohlin H, Jovinge S, Arheden H. Infarct evolution in man studied in patients with first‐time coronary occlusion in comparison to different species—implications for assessment of myocardial salvage. J Cardiovasc Magn Reson. 2009;11:38. [DOI] [PMC free article] [PubMed] [Google Scholar]
- 3. Kloner RA. Does reperfusion injury exist in humans? J Am Coll Cardiol. 1993;21:537–545. [DOI] [PubMed] [Google Scholar]
- 4. Kloner RA, Ganote CE, Jennings RB. The “no‐reflow” phenomenon after temporary coronary occlusion in the dog. J Clin Invest. 1974;54:1496–1508. [DOI] [PMC free article] [PubMed] [Google Scholar]
- 5. Atar D, Petzelbauer P, Schwitter J, Huber K, Rensing B, Kasprzak JD, Butter C, Grip L, Hansen PR, Suselbeck T, Clemmensen PM, Marin‐Galiano M, Geudelin B, Buser PT. Effect of intravenous FX06 as an adjunct to primary percutaneous coronary intervention for acute ST‐segment elevation myocardial infarction results of the F.I.R.E. (Efficacy of FX06 in the Prevention of Myocardial Reperfusion Injury) trial. J Am Coll Cardiol. 2009;53:720–729. [DOI] [PubMed] [Google Scholar]
- 6. Piot C, Croisille P, Staat P, Thibault H, Rioufol G, Mewton N, Elbelghiti R, Cung TT, Bonnefoy E, Angoulvant D, Macia C, Raczka F, Sportouch C, Gahide G, Finet G, Andre‐Fouet X, Revel D, Kirkorian G, Monassier JP, Derumeaux G, Ovize M. Effect of cyclosporine on reperfusion injury in acute myocardial infarction. N Engl J Med. 2008;359:473–481. [DOI] [PubMed] [Google Scholar]
- 7. Gotberg M, Olivecrona GK, Koul S, Carlsson M, Engblom H, Ugander M, van der Pals J, Algotsson L, Arheden H, Erlinge D. A pilot study of rapid cooling by cold saline and endovascular cooling before reperfusion in patients with ST‐elevation myocardial infarction. Circ Cardiovasc Interv. 2010;3:400–407. [DOI] [PubMed] [Google Scholar]
- 8. Patel MR, Worthley SG, Stebbins A, Dill T, Rademakers FE, Valeti US, Barsness GW, Van de Werf F, Hamm CW, Armstrong PW, Granger CB, Kim RJ. Pexelizumab and infarct size in patients with acute myocardial infarction undergoing primary percutaneous coronary Intervention: a delayed enhancement cardiac magnetic resonance substudy from the APEX‐AMI trial. JACC Cardiovasc Imaging. 2010;3:52–60. [DOI] [PubMed] [Google Scholar]
- 9. Gibbons RJ, Valeti US, Araoz PA, Jaffe AS. The quantification of infarct size. J Am Coll Cardiol. 2004;44:1533–1542. [DOI] [PubMed] [Google Scholar]
- 10. Kim HW, Farzaneh‐Far A, Kim RJ. Cardiovascular magnetic resonance in patients with myocardial infarction: current and emerging applications. J Am Coll Cardiol. 2009;55:1–16. [DOI] [PubMed] [Google Scholar]
- 11. Desch S, Eitel I, de Waha S, Fuernau G, Lurz P, Gutberlet M, Schuler G, Thiele H. Cardiac magnetic resonance imaging parameters as surrogate endpoints in clinical trials of acute myocardial infarction. Trials. 2011;12:204. [DOI] [PMC free article] [PubMed] [Google Scholar]
- 12. Pennell DJ, Sechtem UP, Higgins CB, Manning WJ, Pohost GM, Rademakers FE, van Rossum AC, Shaw LJ, Yucel EK. Clinical indications for cardiovascular magnetic resonance (CMR): Consensus Panel report. J Cardiovasc Magn Reson. 2004;6:727–765. [DOI] [PubMed] [Google Scholar]
- 13. Thiele H, Engelmann L, Elsner K, Kappl MJ, Storch WH, Rahimi K, Hartmann A, Pfeiffer D, Kneissl GD, Schneider D, Moller T, Heberling HJ, Weise I, Schuler G. Comparison of pre‐hospital combination‐fibrinolysis plus conventional care with pre‐hospital combination‐fibrinolysis plus facilitated percutaneous coronary intervention in acute myocardial infarction. Eur Heart J. 2005;26:1956–1963. [DOI] [PubMed] [Google Scholar]
- 14. Thiele H, Schindler K, Friedenberger J, Eitel I, Furnau G, Grebe E, Erbs S, Linke A, Mobius‐Winkler S, Kivelitz D, Schuler G. Intracoronary compared with intravenous bolus abciximab application in patients with ST‐elevation myocardial infarction undergoing primary percutaneous coronary intervention: the randomized Leipzig immediate percutaneous coronary intervention abciximab IV versus IC in ST‐elevation myocardial infarction trial. Circulation. 2008;118:49–57. [DOI] [PubMed] [Google Scholar]
- 15. Haeck JD, Kuijt WJ, Koch KT, Bilodeau L, Henriques JP, Rohling WJ, Baan J Jr, Vis MM, Nijveldt R, van Geloven N, Groenink M, Piek JJ, Tijssen JG, Krucoff MW, De Winter RJ. Infarct size and left ventricular function in the PRoximal Embolic Protection in Acute myocardial infarction and Resolution of ST‐segment Elevation (PREPARE) trial: ancillary cardiovascular magnetic resonance study. Heart. 2010;96:190–195. [DOI] [PubMed] [Google Scholar]
- 16. Engblom H, Hedstrom E, Heiberg E, Wagner GS, Pahlm O, Arheden H. Rapid initial reduction of hyperenhanced myocardium after reperfused first myocardial infarction suggests recovery of the peri‐infarction zone: one‐year follow‐up by MRI. Circ Cardiovasc Imaging. 2009;2:47–55. [DOI] [PubMed] [Google Scholar]
- 17. Ibrahim T, Hackl T, Nekolla SG, Breuer M, Feldmair M, Schomig A, Schwaiger M. Acute myocardial infarction: serial cardiac MR imaging shows a decrease in delayed enhancement of the myocardium during the 1st week after reperfusion. Radiology. 2010;254:88–97. [DOI] [PubMed] [Google Scholar]
- 18. Kwong RY, Chan AK, Brown KA, Chan CW, Reynolds HG, Tsang S, Davis RB. Impact of unrecognized myocardial scar detected by cardiac magnetic resonance imaging on event‐free survival in patients presenting with signs or symptoms of coronary artery disease. Circulation. 2006;113:2733–2743. [DOI] [PubMed] [Google Scholar]
- 19. Wu E, Ortiz JT, Tejedor P, Lee DC, Bucciarelli‐Ducci C, Kansal P, Carr JC, Holly TA, Lloyd‐Jones D, Klocke FJ, Bonow RO. Infarct size by contrast enhanced cardiac magnetic resonance is a stronger predictor of outcomes than left ventricular ejection fraction or end‐systolic volume index: prospective cohort study. Heart. 2008;94:730–736. [DOI] [PubMed] [Google Scholar]
- 20. Sorensson P, Heiberg E, Saleh N, Bouvier F, Caidahl K, Tornvall P, Ryden L, Pernow J, Arheden H. Assessment of myocardium at risk with contrast enhanced steady‐state free precession cine cardiovascular magnetic resonance compared to single‐photon emission computed tomography. J Cardiovasc Magn Reson. 2010;12:25. [DOI] [PMC free article] [PubMed] [Google Scholar]
- 21. Ubachs JF, Sorensson P, Engblom H, Carlsson M, Jovinge S, Pernow J, Arheden H. Myocardium at risk by magnetic resonance imaging: head‐to‐head comparison of T2‐weighted imaging and contrast‐enhanced steady‐state free precession. Eur Heart J Cardiovasc Imaging. 2012;13:1008–1015. [DOI] [PMC free article] [PubMed] [Google Scholar]
- 22. Erlinge D, Gotberg M, Lang I, Holzer M, Noc M, Clemmensen P, Jensen U, Metzler B, James S, Botker HE, Omerovic E, Engblom H, Carlsson M, Arheden H, Ostlund O, Wallentin L, Harnek J, Olivecrona GK. Rapid endovascular catheter core cooling combined with cold saline as an adjunct to percutaneous coronary intervention for the treatment of acute myocardial infarction: the CHILL‐MI Trial: a randomized controlled study of the use of central venous catheter core cooling combined with cold saline as an adjunct to percutaneous coronary intervention for the treatment of acute myocardial infarction. J Am Coll Cardiol. 2014;63:1857–1865. [DOI] [PubMed] [Google Scholar]
- 23. Atar D, Abitbol J, Arheden H, Berdeaux A, Bonnet JL, Carlsson M, Clemmensen P, Cuvier V, Danchin N, Dubois‐Randé J, Engblom H, Erlinge D, Firat H, Eggert‐Jensen S, Halvorsen S, Hansen HS, Heiberg E, Larsen AI, Le Corvoisier P, Longlade P, Nordrehaug JE, Perez C, Pruss R, Sonou G, Schaller S, Tuseth V, Vicaut E. Rationale and design of the ‘MITOCARE’ Study: a phase II, multicenter, randomized, double‐blind, placebo‐controlled study to assess the safety and efficacy of TRO40303 for the reduction of reperfusion injury in patients undergoing percutaneous coronary intervention for acute myocardial infarction. Cardiology. 2012;123:201–207. [DOI] [PubMed] [Google Scholar]
- 24. Atar D, Arheden H, Berdeaux A, Bonnet JL, Carlsson M, Clemmensen P, Cuvier V, Danchin N, Dubois‐Rande JL, Engblom H, Erlinge D, Firat H, Halvorsen S, Hansen HS, Hauke W, Heiberg E, Koul S, Larsen AI, Le Corvoisier P, Nordrehaug JE, Paganelli F, Pruss RM, Rousseau H, Schaller S, Sonou G, Tuseth V, Veys J, Vicaut E, Jensen SE. Effect of intravenous TRO40303 as an adjunct to primary percutaneous coronary intervention for acute ST‐elevation myocardial infarction: MITOCARE study results. Eur Heart J. 2015;36:112–119. [DOI] [PubMed] [Google Scholar]
- 25. Heiberg E, Sjogren J, Ugander M, Carlsson M, Engblom H, Arheden H. Design and validation of segment–freely available software for cardiovascular image analysis. BMC Med Imaging. 2010;10:1. [DOI] [PMC free article] [PubMed] [Google Scholar]
- 26. Heiberg E, Ugander M, Engblom H, Gotberg M, Olivecrona GK, Erlinge D, Arheden H. Automated quantification of myocardial infarction from MR images by accounting for partial volume effects: animal, phantom, and human study. Radiology. 2008;246:581–588. [DOI] [PubMed] [Google Scholar]
- 27. Heiberg E, Engblom H, Engvall J, Hedstrom E, Ugander M, Arheden H. Semi‐automatic quantification of myocardial infarction from delayed contrast enhanced magnetic resonance imaging. Scand Cardiovasc J. 2005;39:267–275. [DOI] [PubMed] [Google Scholar]
- 28. Bajard A, Chabaud S, Perol D, Boissel JP, Nony P. Revisiting the level of evidence in randomized controlled clinical trials: a simulation approach. Contemp Clin Trials. 2009;30:400–410. [DOI] [PubMed] [Google Scholar]
- 29. Roes SD, Kelle S, Kaandorp TA, Kokocinski T, Poldermans D, Lamb HJ, Boersma E, van der Wall EE, Fleck E, de Roos A, Nagel E, Bax JJ. Comparison of myocardial infarct size assessed with contrast‐enhanced magnetic resonance imaging and left ventricular function and volumes to predict mortality in patients with healed myocardial infarction. Am J Cardiol. 2007;100:930–936. [DOI] [PubMed] [Google Scholar]
- 30. Eitel I, de Waha S, Wohrle J, Fuernau G, Lurz P, Pauschinger M, Desch S, Schuler G, Thiele H. Comprehensive prognosis assessment by CMR imaging after ST‐segment elevation myocardial infarction. J Am Coll Cardiol. 2014;64:1217–1226. [DOI] [PubMed] [Google Scholar]
- 31. Carlsson M, Ubachs JF, Hedstrom E, Heiberg E, Jovinge S, Arheden H. Myocardium at risk after acute infarction in humans on cardiac magnetic resonance: quantitative assessment during follow‐up and validation with single‐photon emission computed tomography. JACC Cardiovasc Imaging. 2009;2:569–576. [DOI] [PubMed] [Google Scholar]
- 32. Nordlund D, Klug G, Heiberg E, Koul S, Larsen TH, Hoffmann P, Metzler B, Erlinge D, Atar D, Aletras AH, Carlsson M, Engblom H, Arheden H. Multi‐vendor, multicentre comparison of contrast‐enhanced SSFP and T2‐STIR CMR for determining myocardium at risk in ST‐elevation myocardial infarction. Eur Heart J Cardiovasc Imaging. 2016;doi:10.1093/ehjci/jew027. [DOI] [PMC free article] [PubMed] [Google Scholar]
- 33. Kim HW, Van Assche L, Jennings RB, Wince WB, Jensen CJ, Rehwald WG, Wendell DC, Bhatti L, Spatz DM, Parker MA, Jenista ER, Klem I, Crowley AL, Chen EL, Judd RM, Kim RJ. Relationship of T2‐weighted MRI myocardial hyperintensity and the ischemic area‐at‐risk. Circ Res. 2015;117:254–265. [DOI] [PMC free article] [PubMed] [Google Scholar]
- 34. Fieno DS, Hillenbrand HB, Rehwald WG, Harris KR, Decker RS, Parker MA, Klocke FJ, Kim RJ, Judd RM. Infarct resorption, compensatory hypertrophy, and differing patterns of ventricular remodeling following myocardial infarctions of varying size. J Am Coll Cardiol. 2004;43:2124–2131. [DOI] [PubMed] [Google Scholar]
- 35. Reimer KA, Jennings RB. The changing anatomic reference base of evolving myocardial infarction. Underestimation of myocardial collateral blood flow and overestimation of experimental anatomic infarct size due to tissue edema, hemorrhage and acute inflammation. Circulation. 1979;60:866–876. [DOI] [PubMed] [Google Scholar]
- 36. Arheden H, Saeed M, Higgins CB, Gao DW, Ursell PC, Bremerich J, Wyttenbach R, Dae MW, Wendland MF. Reperfused rat myocardium subjected to various durations of ischemia: estimation of the distribution volume of contrast material with echo‐planar MR imaging. Radiology. 2000;215:520–528. [DOI] [PubMed] [Google Scholar]
- 37. Saeed M, Lund G, Wendland MF, Bremerich J, Weinmann H, Higgins CB. Magnetic resonance characterization of the peri‐infarction zone of reperfused myocardial infarction with necrosis‐specific and extracellular nonspecific contrast media. Circulation. 2001;103:871–876. [DOI] [PubMed] [Google Scholar]