

Abstract
Background
Acute kidney injury (AKI) and dialysis‐requiring AKI (AKI‐D) are common, serious complications of cardiac procedures.
Methods and Results
We evaluated 3 633 762 (17 765 214 weighted population) cardiac catheterization or percutaneous coronary intervention (PCI) hospital discharges from the nationally representative National Inpatient Sample to determine annual population incidence rates for AKI and AKI‐D in the United States from 2001 to 2011. Odds ratios for both conditions and associated in‐hospital mortality were calculated for each year in the study period using multiple logistic regression. The number of cardiac catheterization or PCI cases resulting in AKI rose almost 3‐fold from 2001 to 2011. The adjusted odds of AKI and AKI‐D per year among cardiac catheterization and PCI patients were 1.11 (95% CI: 1.10–1.12) and 1.01 (95% CI: 0.99–1.02), respectively. Most importantly, in‐hospital mortality significantly decreased from 2001 to 2011 for AKI (19.6–9.2%) and AKI‐D (28.3–19.9%), whereas odds of associated in‐hospital mortality were 0.50 (95% CI: 0.45–0.56) and 0.70 (95% CI: 0.55–0.93) in 2011 versus 2001, respectively. The population‐attributable risk of mortality for AKI and AKI‐D was 25.8% and 3.8% in 2001 and 41.1% and 6.5% in 2011, respectively. Males and females had similar patterns of AKI increase, although males outpaced females.
Conclusions
The Incidence of AKI among cardiac catheterization and PCI patients has increased sharply in the United States, and this should be addressed by implementing prevention strategies. However, mortality has significantly declined, suggesting that efforts to manage AKI and AKI‐D after cardiac catheterization and PCI have reduced mortality.
Keywords: acute kidney injury, acute renal failure, glomerular filtration rate, renal failure
Subject Categories: Imaging, Angiography, Catheter-Based Coronary and Valvular Interventions, Percutaneous Coronary Intervention, Health Services
Introduction
Percutaneous coronary intervention (PCI) and other types of cardiac catheterization (e.g., diagnostic procedures of the heart) are increasingly prevalent in the United States, accounting for over 2 000 000 procedures annually.1, 2 This increase has been driven by the substitution of cardiac surgeries for less‐invasive catheterization, increased hospital catheterization capacity, and a greater emphasis on evidence‐based care for noncomplex lesions.2, 3, 4, 5 One of the most common complications of cardiac catheterization and PCI is acute kidney injury (AKI). Cardiac catheterization or PCI patients who develop AKI have an increased risk of cardiovascular events, end‐stage renal disease, all‐cause mortality, increased length of stay, and additional acute care costs of ≈$7500.6, 7, 8 AKI severity is positively associated with morbidity and mortality, and dialysis‐requiring AKI (AKI‐D) is associated with the highest rates of morbidity and mortality among patients with post‐procedural AKI.9, 10 The primary cause of AKI and AKI‐D in cardiac catheterization or PCI patients is the use of nephrotoxic, iodinated contrast media for cardiac imaging. Contrast‐induced AKI occurs in 3% to 14% of cardiac catheterization or PCI patients and is the third‐most common cause of AKI in hospitalized patients.11, 12, 13 The 2 primary mechanisms by which contrast media can cause nephrotoxicity are vasoconstriction/ischemic injury and direct toxicity to renal tubular cells.14 These pathways lead to acute tubular necrosis and renal cell apoptosis, causing renal dysfunction. Because of increased use and complexity of cardiac catheterization and PCI requiring large volumes of contrast media, we hypothesized that incidence of AKI and AKI‐D has increased among patients undergoing these procedures. Using a nationally representative sample and census data, we calculated the population‐based incidence and associated in‐hospital mortality of AKI and AKI‐D among cardiac catheterization or PCI patients in the United States from 2001 to 2011.
Methods
We used National Inpatient Sample (NIS) discharge data from 2001 to 2011. The NIS is a yearly nationally‐representative, stratified sample of ≈20% of community‐based hospitals in the United States, making it the largest US all‐payer inpatient database available to researchers.15 Thirty‐three states (986 hospitals) contributed over 7 400 000 discharge records to this database in 2001. The NIS grew to 46 states, 1049 hospitals, and over 8 000 000 discharge records by 2011. The Committee for the Protection of Human Subjects at Dartmouth College waived required approval for this study because the NIS contains no protected health information and is publicly available.
Our study cohort consisted of hospitalizations requiring PCI or cardiac catheterization during the study period. International Classification of Diseases, Ninth Revision, Clinical Modification (ICD‐9‐CM) procedure and diagnosis codes were used to identify and describe these patients. We defined PCI or cardiac catheterization cases using any of the following ICD‐9‐CM codes: 0066 (percutaneous transluminal coronary angioplasty); 3601 to 3609 (operations on vessels of heart); 3722 to 3723 (diagnostic procedures on heart and pericardium); or 8853 to 8857 (angiocardiography using contrast material).
Primary outcomes were occurrence of AKI and AKI‐D and in‐hospital mortality postcardiac catheterization or PCI. Cases of AKI were identified using the following ICD‐9‐CM codes for acute renal failure: 584.5 (with tubular necrosis); 584.6 (with lesion of renal cortical necrosis); 584.7 (with lesion of renal medullary necrosis); 584.8 (other specified pathological lesion in kidney); or 584.9 (unspecified). Cases of AKI‐D were defined as an AKI diagnosis plus a co‐listed code for hemodialysis, hemofiltration, or peritoneal dialysis (V45.1, V56.0, 39.95, V56.1, and 54.98). Records with hemodialysis, hemofiltration, or peritoneal dialysis procedure codes without an AKI diagnosis code were excluded from the analysis, as in similar investigations.16 Patients with arteriovenous fistula creation or revision procedure codes (39.27, 39.42, 39.43, and 39.93) were excluded from analysis to increase sensitivity and specificity for acute dialysis procedures.17
In our model, we accounted for co‐occurring conditions, age, sex, cardiac procedure characteristics, and hospital utilization practices in adjusted analyses (we hypothesized no difference in sex). NIS comorbidity indicators were used to identify these co‐occurring conditions (congestive heart failure, pulmonary circulation disorders, peripheral vascular disease, hypertension, other neurological disorders, chronic pulmonary disease, diabetes without chronic complications, diabetes with chronic complications, renal failure, obesity, fluid and electrolyte disorders, blood loss anemia, and deficiency anemias). Specific ICD‐9‐CM codes used to identify co‐occurring conditions are available for review.18 For adjustment for cardiac procedure characteristics, we also identified sepsis cases (038.x, 112.5, 112.81, 020.2, 790.7, and 785.59) and the number of stents placed during angioplasty, which was considered to account for coronary vessel disease severity and procedure intensity (0045–0048). Lastly, our model was adjusted for yearly median length of stay and the proportion of patients discharged to skilled nursing facilities. We adjusted for discharge to skilled nursing facilities and median lengths of stay to account for potential changes in discharge practices over time and/or between hospitals. This model applies to both AKI and AKI‐D. These measures may be an indicator of unmeasured confounding attributed to unmeasured comorbidities. Additionally, length of stay has declined over time, and discharge to skilled nursing facilities has been shown to increase over time.19
We calculated the population incidence of AKI and AKI‐D for patients who underwent cardiac catheterization or PCI in the United States from 2001 to 2011 by dividing the unweighted number of discharges with AKI or AKI‐D by the annual US population (according to the U.S. Census Bureau).17 Incidence estimates were stratified by sex and age for subgroup analysis. We then used multiple logistic regression to determine the odds of AKI, AKI‐D, and corresponding in‐hospital mortality. To account for the sampling frame and clustering, we applied population weights to the model. Crude and adjusted models were used to estimate the odds of AKI and AKI‐D per a 1‐year increase. We performed the same analysis for sex and age subgroups. Because the NIS has been adding data from more and more states over the years, including during our study period, we adjusted for covariates over time to counteract the addition of these states. We used crude and adjusted models to estimate the odds of mortality for each year, with 2001 as a reference. Adjusted models accounted for age, sex, race, congestive heart failure, pulmonary circulation disorders, peripheral vascular disease, hypertension, other neurological disorders, chronic pulmonary disease, diabetes without chronic complications, diabetes with chronic complications, renal failure, obesity, fluid and electrolyte disorders, blood loss anemia, deficiency anemias, sepsis, and cardiac catheterization. Using these models, we calculated the population‐attributable risk of death for PCI or cardiac catheterization patients during hospitalization for AKI and AKI‐D. Population‐attributable risk approximates the proportion of patient deaths that could be prevented if a condition (e.g. AKI‐D) and its associated complications are avoided. All data were analyzed using SAS software (volume 9.3; SAS Institute Inc., Cary, NC) and weighted at the discharge level to account for the NIS sampling schema.
Results
Yearly characteristics for cardiac catheterization and PCI patients are displayed in Table 1. Sample sizes are unweighted, whereas percentages are population‐weighted. The proportion of patients undergoing only cardiac catheterization remained stable (56.9–56.0%), whereas the proportion of patients undergoing only PCI decreased (6.2–3.3%) from 2001 to 2011. The proportion of patients undergoing both procedures grew (36.9–40.7%) from 2001 to 2011. Most characteristics of cardiac catheterization and PCI patients changed across study years, except sex, age, and blood loss anemia. The largest increases occurred in patients with hypertension (51.6–71.8%), diabetes without chronic complications (23.1–30.5%), obesity (7.72–16.8%), renal failure predceing surgery (3.6–15.2%), electrolyte disorders (7.0–17.3%), and deficiency anemias (6.3–14.2%) from 2002 to 2011.
Table 1.
Characteristics of Cardiac Catheterization and PCI Patients in the United States From 2001 to 2011
| All Years | 2001 | 2002 | 2003 | 2004 | 2005 | 2006 | 2007 | 2008 | 2009 | 2010 | 2011 | |
|---|---|---|---|---|---|---|---|---|---|---|---|---|
| N (%) | N (%) | N (%) | N (%) | N (%) | N (%) | N (%) | N (%) | N (%) | N (%) | N (%) | N (%) | |
| N | 3 633 762 | 358 866 | 364 605 | 379 592 | 349 690 | 341 896 | 371 758 | 312 730 | 323 568 | 302 970 | 259 379 | 268 708 |
| Catheterization only | 1 967 899 (54) | 204 933 (57) | 206 739 (57) | 210 776 (56) | 187 289 (53) | 177 910 (52) | 184 304 (50) | 166 384 (53) | 167 873 (52) | 164 169 (54) | 147 297 (57) | 150 225 (56) |
| Catheterization and PCI | 1 453 932 (40) | 131 589 (37) | 132 582 (36) | 145 462 (38) | 140 271 (40) | 144 232 (42) | 156 340 (42) | 128 273 (41) | 138 087 (43) | 124 598 (41) | 102 942 (40) | 109 556 (41) |
| PCI Only | 211 931 (6) | 22 344 (6) | 25 284 (7) | 23 354 (6) | 22 130 (6) | 19 754 (6) | 31 114 (8) | 18 073 (6) | 17 608 (5) | 14 203 (5) | 9140 (4) | 8927 (3) |
| Female | 1 426 388 (39) | 142 063 (40) | 145 133 (40) | 149 816 (39) | 138 231 (40) | 133 102 (39) | 144 279 (39) | 122 564 (39) | 126 328 (39) | 119 100 (39) | 100 603 (39) | 105 169 (39) |
| Age, yr | ||||||||||||
| 0 to 19 | 16 772 (1) | 1506 (0) | 1247 (0) | 1173 (0) | 1803 (1) | 2571 (1) | 1609 (0) | 1485 (0) | 1381 (0) | 1231 (0) | 1352 (1) | 1414 (1) |
| 20 to 44 | 247 659 (7) | 24 094 (7) | 25 752 (7) | 27 310 (7) | 24 445 (7) | 23 264 (7) | 25 108 (7) | 21 774 (7) | 21 669 (7) | 19 693 (6) | 17 303 (7) | 17 247 (6) |
| 45 to 64 | 1 546 101 (43) | 145 288 (40) | 151 863 (42) | 161 555 (43) | 147 780 (42) | 144 764 (42) | 159 902 (43) | 135 603 (43) | 139 103 (43) | 130 834 (43) | 113 688 (44) | 115 721 (43) |
| 65 to 74 | 953 727 (26) | 99 861 (28) | 98 374 (27) | 99 897 (26) | 91 742 (26) | 88 277 (26) | 96 529 (26) | 80 337 (26) | 83 754 (26) | 78 733 (26) | 66 276 (26) | 69 947 (26) |
| 75+ | 869 453 (24) | 88 115 (25) | 87 367 (24) | 89 652 (24) | 83 917 (24) | 83 018 (24) | 88 609 (24) | 73 529 (24) | 77 656 (24) | 72 472 (24) | 60 746 (23) | 64 372 (24) |
| CHF | 85 604 (2) | 1 (0) | 20 676 (6) | 6297 (2) | 6234 (2) | 6854 (2) | 7155 (2) | 6675 (2) | 7685 (2) | 8003 (3) | 7414 (3) | 8610 (3) |
| Pulmonary circulation disorder | 15 671 (0) | 0 (0) | 905 (0) | 1006 (0) | 895 (0) | 990 (0) | 1150 (0) | 1420 (0) | 2116 (1) | 2374 (1) | 2151 (1) | 2664 (1) |
| Peripheral vascular disease | 325 599 (9) | 1 (0) | 28 743 (8) | 30 284 (8) | 31 568 (9) | 31 133 (9) | 36 196 (10) | 34 036 (11) | 37 083 (11) | 35 728 (12) | 28 446 (11) | 32 381 (12) |
| Hypertension | 2 086 115 (57) | 16 (0) | 188 699 (52) | 211 101 (56) | 215 875 (62) | 213 067 (62) | 242 501 (65) | 207 171 (66) | 221 758 (68) | 210 865 (70) | 181 952 (70) | 193 110 (72) |
| Neurological disorders | 101 120 (3) | 0 (0) | 9454 (3) | 8493 (2) | 8503 (2) | 8743 (3) | 10 266 (3) | 10 312 (3) | 11 404 (4) | 11 566 (4) | 10 346 (4) | 12 033 (5) |
| Chronic pulmonary disease | 584 211 (16) | 4 (0) | 55 723 (15) | 58 947 (16) | 58 387 (17) | 60 220 (18) | 66 672 (18) | 59 669 (19) | 59 407 (18) | 58 731 (19) | 50 496 (19) | 55 955 (21) |
| Diabetes mellitus | 880 157 (24) | 6 (0) | 84 348 (23) | 89 391 (24) | 90 427 (26) | 88 696 (26) | 99 978 (27) | 87 654 (28) | 92 697 (29) | 88 381 (29) | 76 447 (30) | 82 132 (31) |
| Diabetes mellitus with chronic complications | 136 954 (4) | 3 (0) | 12 653 (3) | 12 966 (3) | 12 566 (4) | 13 006 (4) | 14 028 (4) | 13 549 (4) | 14 313 (4) | 14 536 (5) | 13 468 (5) | 15 866 (6) |
| Renal failure | 279 216 (8) | 0 (0) | 13 109 (4) | 14 495 (4) | 15 133 (4) | 19 080 (6) | 33 587 (9) | 33 104 (11) | 36 027 (11) | 38 396 (13) | 35 516 (14) | 40 769 (15) |
| Obesity | 372 328 (10) | 0 (0) | 28 437 (8) | 31 057 (8) | 31 338 (9) | 33 463 (10) | 37 545 (10) | 36 451 (12) | 44 088 (14) | 45 619 (15) | 39 317 (15) | 45 013 (17) |
| Fluid and electrolyte disorders | 356 941 (10) | 4 (0) | 25 574 (7) | 28 361 (8) | 29 323 (8) | 31 823 (9) | 37 146 (10) | 35 435 (11) | 40 923 (13) | 42 261 (14) | 39 477 (15) | 46 614 (17) |
| Chronic blood loss anemia | 23 134 (1) | 0 (0) | 2236 (1) | 2472 (1) | 2498 (1) | 2656 (1) | 2792 (1) | 2581 (1) | 2309 (1) | 2156 (1) | 1642 (1) | 1792 (1) |
| Deficiency anemias | 297 657 (8) | 2 (0) | 22 992 (6) | 24 541 (7) | 24 255 (7) | 24 645 (7) | 28 491 (8) | 30 340 (10) | 34 884 (11) | 36 659 (12) | 32 626 (13) | 38 222 (14) |
| Sepsis | 52 025 (1) | 3186 (1) | 3778 (1) | 3941 (1) | 3889 (1) | 4288 (1) | 4786 (1) | 4785 (2) | 5551 (2) | 5960 (2) | 5503 (2) | 6358 (2) |
| SNF or ICF | 212 729 (6) | 18 093 (5) | 18 844 (5) | 19 396 (5) | 19 180 (6) | 18 814 (6) | 20 020 (5) | 18 920 (6) | 20 672 (6) | 20 357 (7) | 18 410 (7) | 20 023 (8) |
| Died | 60 354 (2) | 6205 (2) | 6136 (2) | 6217 (2) | 5384 (2) | 5155 (2) | 5417 (2) | 4934 (2) | 5468 (2) | 5347 (2) | 4805 (2) | 5286 (2) |
Please note that sample sizes are unweighted, but percentages are population‐weighted. CHF indicates congestive heart failure; ICF, intermediate care facility; PCI, percutaneous coronary intervention; SNF, skilled nursing facility.
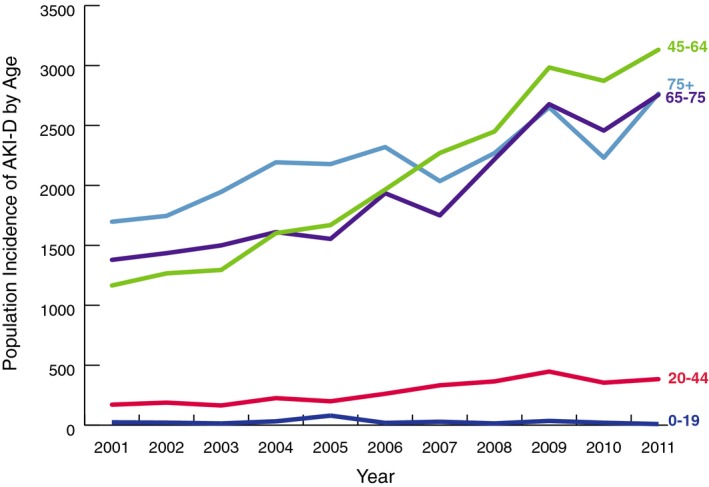
We identified 184 752 (894 815 population weighted; 273 per 1 000 000) hospitalizations requiring cardiac catheterization or PCI with a subsequent diagnosis of AKI over the study period.20 From 2001 to 2011, the number of cases of cardiac catheterization or PCI resulting in AKI rose almost 3‐fold in the United States, from 8789 to 26 851 (44 158–127 380 population weighted; 155–416 per 1 000 000; Figure 1). However, the AKI incidence among cardiac catheterization or PCI patients did not increase uniformly every year. AKI incidence declined substantially in 2010. AKI‐D incidence had similar patterns of overall growth and decline in 2010 (Figure 2). Unadjusted logistic regression showed that patients had 1.17 (95% CI, 1.16–1.18) times the odds of AKI per 1‐year increase (Table 2). After adjustment for patient, cardiac procedure, and hospital characteristics, the odds of developing AKI were 1.11 times the previous year (95% CI, 1.10–1.12). AKI incidence increased similarly for men and women over the study period. However, the increase in AKI incidence for men outpaced that of women (Figure 3). Across age groups, AKI incidence increased similarly, except for the 0 to 19 and 20 to 40 age groups, in which AKI incidence plateaued toward the study period's end (Figure 4).
Figure 1.
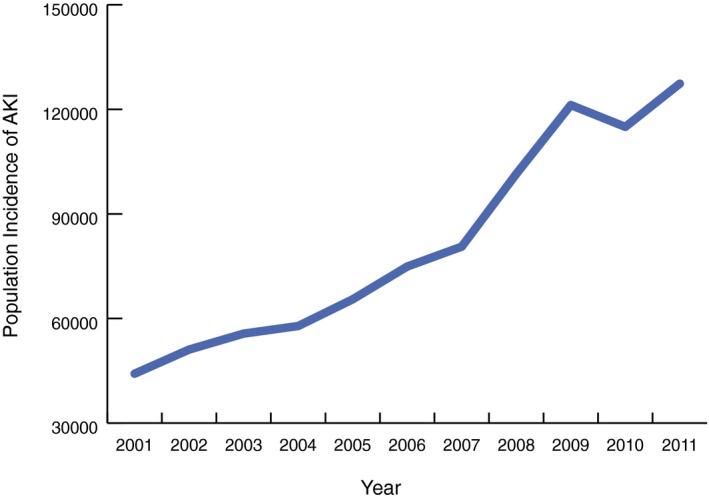
AKI incidence: population incidence of acute kidney injury among cardiac catheterization and percutaneous coronary intervention patients in the United States from 2001 to 2011. AKI indicates acute kidney injury.
Figure 2.
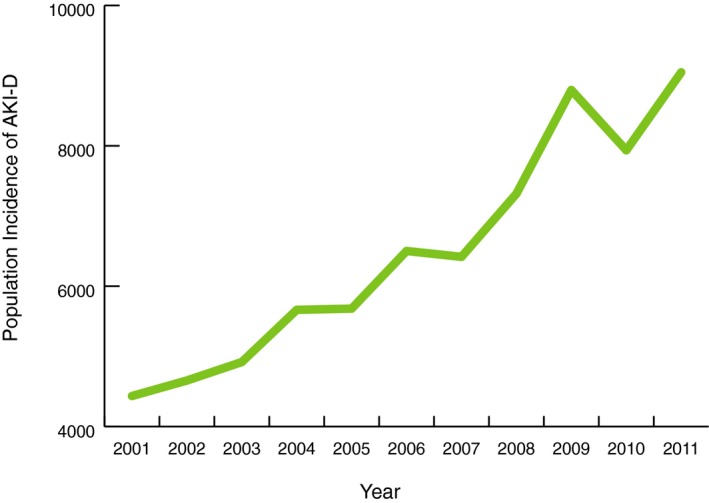
AKI‐D incidence: population incidence of dialysis‐requiring acute kidney injury among cardiac catheterization and percutaneous coronary intervention patients in the United States from 2001 to 2011. AKI‐D indicates dialysis‐requiring acute kidney injury.
Table 2.
Crude and Adjusted ORs of Developing AKI and AKI‐D Relative to the Previous Year Among Patients Undergoing Cardiac Catheterization or PCI in the United States
| Population at Risk | Crude OR/Year | Adjusted OR/Year |
|---|---|---|
| 95% CI | 95% CI | |
| AKI | ||
| Overall, per y | 1.17 (1.16–1.18) | 1.11 (1.10–1.12) |
| Age groups, y | ||
| 0 to 19 | 1.05 (0.99–1.10) | 1.02 (0.97–1.08) |
| 20 to 44 | 1.24 (1.22–1.26) | 1.19 (1.17–1.20) |
| 45 to 64 | 1.20 (1.18–1.21) | 1.14 (1.13–1.15) |
| 65 to 74 | 1.16 (1.15–1.18) | 1.11 (1.10–1.12) |
| 75+ | 1.15 (1.14–1.17) | 1.09 (1.08–1.10) |
| Sex | ||
| Male | 1.18 (1.17–1.19) | 1.12 (1.11–1.13) |
| Female | 1.16 (1.15–1.17) | 1.10 (1.10–1.11) |
| AKI‐D | ||
| Overall, per y | 1.11 (1.09–1.13) | 1.01 (0.99–1.02) |
| Age groups | ||
| 0 to 19 | 1.01 (0.92–1.10) | 0.98 (0.90–1.08) |
| 20 to 44 | 1.16 (1.12–1.20) | 1.07 (1.03–1.10) |
| 45 to 64 | 1.15 (1.13–1.17) | 1.05 (1.03–1.07) |
| 65 to 74 | 1.12 (1.10–1.14) | 1.02 (1.00–1.04) |
| 75+ | 1.07 (1.05–1.09) | 0.95 (0.93–0.97) |
| Sex | ||
| Male | 1.12 (1.10–1.14) | 1.01 (0.99–1.03) |
| Female | 1.10 (1.08–1.12) | 1.01 (0.99–1.02) |
Please note that we use survey methods with population weights and adjust for age, sex, race, congestive heart failure, pulmonary circulation disorders, peripheral vascular disease, hypertension, other neurological disorders, chronic pulmonary disease, diabetes without chronic complications, diabetes with chronic complications, renal failure, obesity, fluid and electrolyte disorders, blood loss anemia, deficiency anemias, sepsis, cardiac catheterization, yearly median length of stay, and the proportion of patients discharged to skilled nursing facilities. AKI indicates acute kidney injury; AKI‐D, dialysis‐requiring acute kidney injury; OR, odds ratio; PCI, percutaneous coronary intervention.
Figure 3.
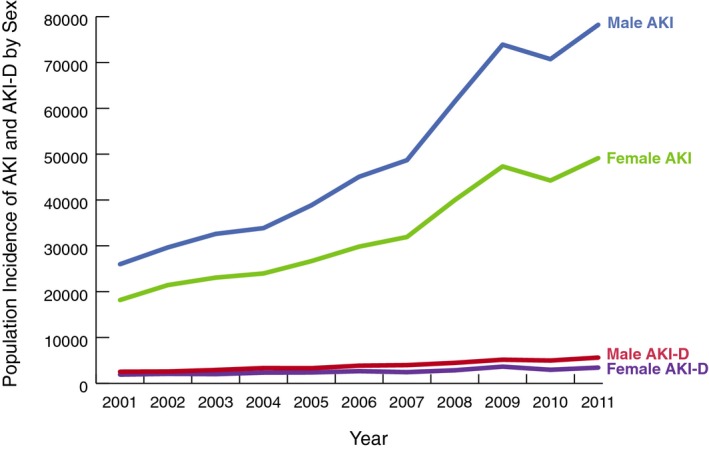
AKI and AKI‐D incidence by sex: population incidence of acute kidney injury and dialysis‐requiring acute kidney injury among cardiac catheterization and percutaneous coronary intervention patients by sex in the United States from 2001 to 2011. AKI indicates acute kidney injury; AKI‐D, dialysis‐requiring acute kidney injury.
Figure 4.
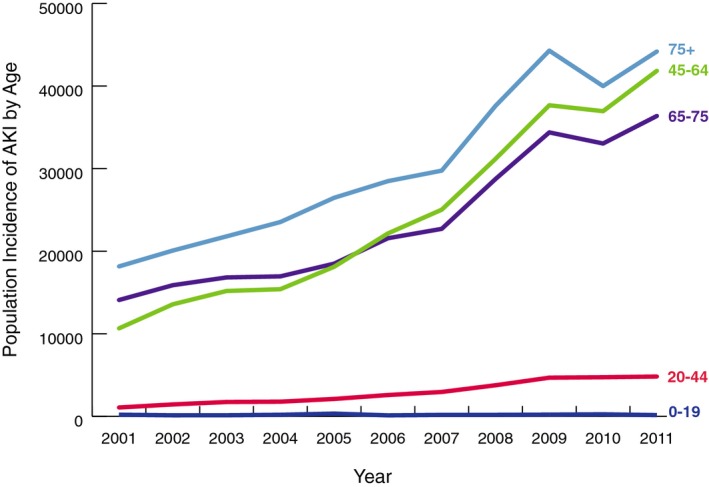
AKI incidence by age: population incidence of acute kidney injury among cardiac catheterization and percutaneous coronary intervention patients by age group in the United States from 2001 to 2011. AKI indicates acute kidney injury.
In‐hospital mortality for cardiac catheterization or PCI patients with AKI decreased from 19.6% in 2001 to 9.2% in 2011 (unadjusted odds ratio [OR], 0.42; 95% CI, 0.38–0.46; adjusted OR, 0.50; 95% CI, 0.45–0.56; Table 3). Despite a decrease in yearly mortality rates for these patients (adjusted OR=0.91 in 2001 to adjusted OR=0.50 in 2011; Table 3), the number dying after developing AKI after cardiac catheterization or PCI increased over the study period (population‐attributable risk [PAR]=25.8 in 2001 to PAR=41.1 in 2011; Table 4). However, this increase was masked by an even larger yearly increase in total AKI incidence after cardiac catheterization or PCI. The population‐attributable risk of mortality associated with developing AKI after cardiac catheterization or PCI was 25.8% in 2001 compared to 41.1% in 2011 (Table 4).
Table 3.
Crude and Adjusted ORs of In‐Hospital Mortality Among AKI and AKI‐D Patients Undergoing Cardiac Catheterization or PCI in the United States
| Year | Crude OR | Adjusted OR |
|---|---|---|
| 95% CI | 95% CI | |
| Odds of mortality—AKI | ||
| 2001 | Referent | |
| 2002 | 0.89 (0.80–0.98) | 0.91 (0.82–1.02) |
| 2003 | 0.79 (0.72–0.80) | 0.89 (0.80–0.98) |
| 2004 | 0.68 (0.62–0.76) | 0.73 (0.65–0.81) |
| 2005 | 0.61 (0.55–0.68) | 0.66 (0.59–0.74) |
| 2006 | 0.56 (0.51–0.61) | 0.66 (0.60–0.73) |
| 2007 | 0.51 (0.46–0.67) | 0.61 (0.54–0.68) |
| 2008 | 0.50 (0.45–0.55) | 0.59 (0.53–0.66) |
| 2009 | 0.44 (0.40–0.49) | 0.54 (0.49–0.60) |
| 2010 | 0.41 (0.37–0.45) | 0.50 (0.45–0.56) |
| 2011 | 0.42 (0.38–0.46) | 0.50 (0.45–0.56) |
| Odds of mortality—AKI‐D | ||
| 2001 | Referent | |
| 2002 | 1.02 (0.81–1.30) | 1.16 (0.90–1.49) |
| 2003 | 0.82 (0.64–1.04) | 0.85 (0.65–1.11) |
| 2004 | 0.72 (0.57–0.91) | 0.74 (0.58–0.96) |
| 2005 | 0.74 (0.58–0.95) | 0.75 (0.57–0.97) |
| 2006 | 0.72 (0.57–0.91) | 0.82 (0.64–1.06) |
| 2007 | 0.73 (0.58–0.92) | 0.78 (0.61–1.00) |
| 2008 | 0.78 (0.61–1.00) | 0.80 (0.62–1.04) |
| 2009 | 0.69 (0.55–0.87) | 0.77 (0.60–0.99) |
| 2010 | 0.64 (0.50–0.82) | 0.71 (0.55–0.93) |
| 2011 | 0.63 (0.50–0.80) | 0.70 (0.55–0.93) |
Please note that we use survey methods with population weights and adjust for age, sex, race, congestive heart failure, pulmonary circulation disorders, peripheral vascular disease, hypertension, other neurological disorders, chronic pulmonary disease, diabetes without chronic complications, diabetes with chronic complications, renal failure, obesity, fluid and electrolyte disorders, blood loss anemia, deficiency anemias, sepsis, cardiac catheterization, yearly median length of stay, and the proportion of patients discharged to skilled nursing facilities. AKI indicates acute kidney injury; AKI‐D, dialysis‐requiring acute kidney injury; OR, odds ratio; PCI, percutaneous coronary intervention.
Table 4.
Population‐Attributable Risk of Mortality Associated With AKI and AKI‐D Patients Undergoing Cardiac Catheterization or PCI in the United States, 2001 Through 2011
| Year | Population‐Attributable Risk of Mortality AKI | Population‐Attributable Risk of Mortality AKI‐D |
|---|---|---|
| 2001 | 25.8 | 3.8 |
| 2002 | 28.6 | 4.4 |
| 2003 | 28.0 | 3.8 |
| 2004 | 28.9 | 4.4 |
| 2005 | 30.9 | 4.8 |
| 2006 | 31.0 | 5.1 |
| 2007 | 32.9 | 5.5 |
| 2008 | 36.8 | 6.0 |
| 2009 | 39.0 | 6.5 |
| 2010 | 37.8 | 6.1 |
| 2011 | 41.1 | 6.5 |
Please note that we use survey methods with population weights and adjust for age, sex, race, congestive heart failure, pulmonary circulation disorders, peripheral vascular disease, hypertension, other neurological disorders, chronic pulmonary disease, diabetes without chronic complications, diabetes with chronic complications, renal failure, obesity, fluid and electrolyte disorders, blood loss anemia, deficiency anemias, sepsis, cardiac catheterization, yearly median length of stay, and the proportion of patients discharged to skilled nursing facilities. AKI indicates acute kidney injury; AKI‐D, dialysis‐requiring acute kidney injury; PCI, percutaneous coronary intervention.
Because discharges to skilled nursing facilities remained static over the study period, it is unlikely that variability in hospital characteristics impacted mortality estimates. Length of stay decreased among AKI patients in the study period from a median of 11 (interquartile range [IQR], 7–19) days in 2001 to 7 (IQR, 4–13) days in 2011. This may indicate more‐efficient care management after cardiac catheterization or PCI, where AKI may have been resolved more quickly and patients discharged earlier.
AKI‐D among cardiac catheterization or PCI patients accounted for 14 896 (71 368 population‐weighted) hospitalizations during the study period (22 per 1 000 000). From 2001 to 2011, the number of cases of cardiac catheterization or PCI resulting in AKI‐D more than doubled in the United States, from 877 to 1915 (4435–9047 population‐weighted; 16–30 per 1 000 000; Figure 1). At‐risk patients had 1.11 (95% CI, 1.09–1.13) times the odds of AKI‐D per 1‐year increase. After adjustment for patient, cardiac procedure, and hospital characteristics, odds for developing AKI‐D were only 1.01 times the previous year (95% CI, 0.99–1.02) and were no longer statistically significant (Table 2). AKI‐D incidence increased similarly in men and women and across age groups, though incidence was more variable by age (Figures 3 and 5).
Figure 5.
AKI‐D incidence by age: population incidence of dialysis‐requiring acute kidney injury among cardiac catheterization and percutaneous coronary intervention patients by age group in the United States from 2001 to 2011. AKI‐D indicates dialysis‐requiring acute kidney injury.
In‐hospital mortality for postcardiac catheterization or PCI AKI‐D patients decreased from 28.3% in 2001 to 19.9% in 2011 (unadjusted OR=0.63; 95% CI, 0.50–0.80; adjusted OR=0.70; 95% CI, 0.55–0.93; Table 3). The number who died after developing AKI‐D postcardiac catheterization or PCI actually increased during the study period (1256 deaths in 2001 to 1801 deaths in 2011), but was obscured by a larger increase in yearly AKI‐D incidence after cardiac catheterization or PCI (adjusted yearly OR=1.01; Table 2). The population‐attributable risk of mortality associated with AKI‐D after cardiac catheterization or PCI rose from 3.8% in 2001 to 6.5% in 2011. Median length of stay and proportion of patients discharged to skilled nursing facilities remained static across the study period. Figure 6 depicts the relatively unchanging median length of stay over time.
Figure 6.
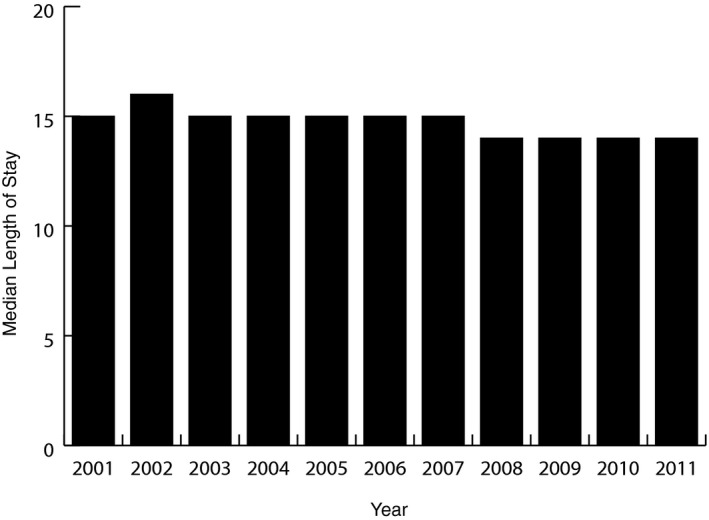
Median length of stay: the median length of stay remains relatively static from 2001 to 2011.
Additionally, we calculated overall unweighted AKI and AKI‐D rates for (1) patients who have undergone cardiac catheterization alone (AKI, 6.44%; AKI‐D, 0.55%), (2) patients who have undergone cardiac catheterization and PCI (AKI, 3.61%; AKI‐D, 0.25%), and (3) patients who have undergone PCI only (with no diagnostic catheterization immediately beforehand [AKI, 2.60%; AKI‐D, 0.23%]; Table 5). We observed similar trends to the overall study, confirming increased rates of both AKI and AKI‐D among procedure subgroups for cardiac catheterization only, PCI only, and cardiac catheterization with PCI.
Table 5.
Incidence of AKI and AKI‐D by Procedure Type From 2001 to 2011
| AKI | AKI‐D | |||||
|---|---|---|---|---|---|---|
| Catheterization Only (%) | PCI Only (%) | Catheterization and PCI (%) | Catheterization Only (%) | PCI Only (%) | Catheterization and PCI (%) | |
| 2001 | 3.06 | 1.24 | 1.71 | 0.30 | 0.18 | 0.17 |
| 2002 | 3.71 | 1.14 | 1.98 | 0.35 | 0.12 | 0.18 |
| 2003 | 4.03 | 1.37 | 2.05 | 0.37 | 0.13 | 0.17 |
| 2004 | 4.42 | 1.72 | 2.32 | 0.46 | 0.21 | 0.19 |
| 2005 | 5.30 | 2.07 | 2.54 | 0.49 | 0.17 | 0.19 |
| 2006 | 5.76 | 1.99 | 2.71 | 0.55 | 0.15 | 0.18 |
| 2007 | 6.82 | 2.79 | 3.55 | 0.59 | 0.23 | 0.24 |
| 2008 | 8.53 | 3.65 | 4.50 | 0.69 | 0.24 | 0.27 |
| 2009 | 10.18 | 5.15 | 5.89 | 0.78 | 0.39 | 0.39 |
| 2010 | 10.73 | 6.66 | 6.86 | 0.78 | 0.54 | 0.43 |
| 2011 | 11.88 | 8.10 | 7.55 | 0.88 | 0.68 | 0.49 |
| Total | 6.44 | 2.60 | 3.61 | 0.55 | 0.23 | 0.25 |
Please note that these are rates based on unweighted data. AKI indicates acute kidney injury; AKI‐D, dialysis‐requiring acute kidney injury.
Discussion
Rates of AKI and AKI‐D in this study population rose significantly between 2001 and 2011. AKI incidence increased 3‐fold during the study period, whereas AKI‐D incidence increased 2‐fold. Although the proportion of AKI and AKI‐D patients dying in‐hospital decreased, both the absolute number of deaths and the population‐attributable risk of death for AKI and AKI‐D increased from 2001 to 2011. Over 40% of deaths after cardiac catheterization or PCI occur in combination with AKI, whereas 6.5% occur in combination with AKI‐D. Based on these findings, a significant opportunity exists to prevent and manage AKI and AKI‐D among cardiac catheterization and PCI patients in the United States.
Epidemiological investigations indicate that AKI and AKI‐D incidence is increasing among hospitalized patients.16, 17, 21, 22 Using the NIS, Hsu found that the odds of developing AKI‐D increased by 10% annually among hospitalized patients in the United States between 2000 and 2009.17 Similarly, Lenihan and Khera utilized the NIS to investigate the temporal incidence of AKI and AKI‐D, but among cardiac surgery and elderly PCI patients.16, 22 Compared to 1999, the adjusted odds of AKI and AKI‐D in 2008 for cardiac surgery patients were 3.30 and 2.23, respectively.16 Among elderly PCI patients (≥75 years), the adjusted odds of AKI and AKI‐D in 2010 compared to 2002 were 1.87 and 0.20, respectively. We found similar, though smaller, odds of AKI among cardiac catheterization and PCI patients from 2001 to 2011 using NIS discharge data. We expected slightly smaller odds of AKI in our cohort, compared to the Lenihan and Khera studies, because cardiac surgery and elderly PCI patients have an increased risk of AKI attributed to age and comorbidity burden.16, 22 Unlike other studies, we found that cardiac catheterization and PCI patients did not have significantly different odds of AKI‐D in 2011 versus 2001, despite the doubling of such cases over the study period.
Not all studies show AKI and AKI‐D increases in the United States. In an analysis of acute myocardial infarction patients across 56 health care centers, Amin found that AKI incidence declined from 27% to 20% from 2000 to 2008.23 However, this study reported trends in hospital‐based incidences for patients at experienced treatment centers, not all of which underwent coronary angiography. Nevertheless, these results highlight the importance of studying trends across different populations to identify modifiable risk factors to prevent AKI and AKI‐D.24
There are several possible explanations for our observed increase in AKI and AKI‐D incidence between 2001 and 2011. Whereas PCI patient age distribution remained relatively constant, we did notice a trend toward increasing comorbidity burden over time, including specific AKI risk factors such as hypertension, obesity, and diabetes. However, adjusting for these risk factors only partially accounted for the observed growth. Another potential contributor is the increasing complexity of procedures being performed, whether attributed to the complexity of the procedures themselves or to increasingly complex settings. Improvements in sensitivity attributed to increasing provider awareness over time may have also partially explained the observed temporal increase in AKI incidence.25, 26, 27, 28, 29, 30 Recently, Grams et al. demonstrated an increase in sensitivity of administrative codes for AKI from 10% to 24% over a similar time interval as our study with a high, constant specificity.29, 31, 32, 33 Though this increase in code sensitivity likely accounts for some of the increase in AKI, research that uses consistent creatinine‐based definitions for AKI over the duration of their studies (rather than administrative codes) has suggested that the increase in AKI incidence is real.34 Such consistent definitions provide argument against a higher false‐positive rate. Additionally, assuming 10% of AKI cases were coded correctly at the beginning of our study period and a constant population‐based incidence rate over time, an increase in sensitivity would also not explain the observed increase in AKI‐D, which is a condition more tightly linked to billing with lower rates of misclassification.
Evidence also suggests that clinicians may be taking a more aggressive approach to dialysis. Siddiqui et al. found that median time to dialysis after major elective surgery decreased from 5 to 2 days, indicating that changing practice patterns may be playing a role.35 Inclusion of additional hospitals in the NIS over the study period (n=63) may have also contributed to the observed increase in AKI cases. For cardiac catheterization and PCI procedures, the contrast media used for imaging is nephrotoxic and was likely a significant driver behind the increasing rates of AKI and AKI‐D observed here from 2001 to 2011. The proportion of AKI and AKI‐D patients undergoing dual cardiac catheterization and PCI in our study grew by 6% and 4%, respectively.
Several studies have demonstrated that the proportion of AKI and AKI‐D patients experiencing in‐hospital mortality is declining in the United States.16, 17, 22 However, the number of AKI and AKI‐D cases is growing at an alarming rate, masking a smaller, yet significant, absolute mortality increase for these patients. For example, Khera et al. found that the adjusted odds of mortality among elderly PCI patients who developed AKI was 0.74 in 2010 compared to 2002, a 11.6% reduction in the proportion of AKI patients experiencing in‐hospital mortality.22 However, the raw number of patient deaths for this population increased more than 3‐fold during the same time.22 Our analysis shows similar findings. Despite a decrease in the odds of death among cardiac catheterization or PCI patients with AKI or AKI‐D from 2001 to 2011, the population‐attributable risk for mortality increased by 15.3% and 2.7%, respectively. The proportion of potentially preventable deaths associated with AKI and AKI‐D among cardiac catheterization and PCI patients is on the rise.
Our main strength is the use of a large, multiyear, nationally representative sample of cardiac catheterization and PCI patients in the United States. The advantages of using such a data set include increased statistical power, improved outcome estimation accuracy, and wider generalizability of results. In addition, our study was conducted on patients undergoing cardiac catheterization or PCI, procedures that are increasingly applied to patients at risk for AKI. Although some reports indicate a decline in PCI use, catheterization capacity in the United States continues to grow and the cumulative use of PCI and other types of cardiac catheterization is on the rise, as demonstrated in this analysis.36, 37
Our study has a number of limitations. First, we used ICD‐9‐CM administrative billing codes to identify patients in our sample with a diagnosis of AKI or AKI‐D, and the sensitivity of these codes has increased over time, which could exaggerate the increase in AKI incidence.29 Clinical or laboratory data, such as serum creatinine, would have provided the most accurate indicator for renal dysfunction had it been available.38 Given the known sensitivity limitations of administrative codes for AKI, our results may underestimate its true incidence.
Another limitation to our study is that the NIS also does not provide granular detail about the underlying cause of AKI post‐PCI. Though AKI is most frequently caused by ischemia and/or direct nephrotoxicity, there are many other causes that we were unable to distinguish in this study, such as medications, viruses, bacteria, systemic illnesses, extra‐ and intrarenal obstructions, cardiorenal syndrome, hepatorenal syndrome, systemic vasodilation, and volume depletion.39
Unmeasured variation between in‐ and outpatient medical regimens may also have affected our results. Other factors, such as atheroembolic disease, may have contributed. In addition, the NIS database was limited in 2001 and may under‐represent a national sample for that year; however, trends for AKI and AKI‐D persist in subsequent years with larger samples.
It is also possible that we did not account for a potential underlying national decrease in in‐hospital mortality, outside of cardiac catheterization and PCI. It is possible that such a trend would partially or wholly explain the decrease in mortality that we found, but identifying determinants of potential decreases in hospital mortality over time was beyond the scope of this work.
Additionally, because of the causal relationship between contrast media use and AKI, we assumed that cardiac catheterization or PCI temporally preceded AKI or AKI‐D.
Finally, despite using the same data abstraction code for every year in the study period, there is a great deal of comorbidity information missing for 2001. We are unsure why this data are lacking.
Determining the incidence of, and mortality risk associated with, AKI and AKI‐D among cardiac catheterization or PCI patients allows health care providers to understand the clinical significance of this adverse outcome. Although specific therapies for treatment of AKI are nonexistent, hospitals with cardiac catheterization capability should invest in implementing and standardizing prevention measures and avoiding further kidney damage to address mortality in this population.6, 13, 40, 41, 42, 43, 44, 45 Moving forward, additional research is needed to examine differences in AKI and AKI‐D incidence across additional cardiac catheterization or PCI patient subgroups, including geographical and socioeconomic subclasses.
Our analysis demonstrates that incidence of AKI and AKI‐D among cardiac catheterization or PCI patients increased drastically from 2001 to 2011. Over 40% of all deaths after cardiac catheterization or PCI occur in combination with AKI. Efforts to prevent AKI or AKI‐D after cardiac catheterization or PCI would result in significant reductions in mortality risk for these patients.
Sources of Funding
This study was supported, in part, by grants from the AHRQ K01HS018443, Rockville, MD (Brown), and the Veterans Health Administration HSR&D CDA‐08‐020 Washington, DC (Matheny), HSR&D IIR‐11‐292 Washington, DC (Matheny, Brown). Siew is support by VHA HSR&D IIR‐13‐073. The content is solely the responsibility of the authors and does not necessarily represent the official views of the Agency for Healthcare Research and Quality, the National Institutes of Health, or the Veterans Administration.
Disclosures
None.
(J Am Heart Assoc. 2016;5:e002739 doi: 10.1161/JAHA.115.002739)
References
- 1. Go AS, Mozaffarian D, Roger VL, Benjamin EJ, Berry JD, Borden WB, Bravata DM, Dai S, Ford ES, Fox CS, Franco S, Fullerton HJ, Gillespie C, Hailpern SM, Heit JA, Howard VJ, Huffman MD, Kissela BM, Kittner SJ, Lackland DT, Lichtman JH, Lisabeth LD, Magid D, Marcus GM, Marelli A, Matchar DB, McGuire DK, Mohler ER, Moy CS, Mussolino ME, Nichol G, Paynter NP, Schreiner PJ, Sorlie PD, Stein J, Turan TN, Virani SS, Wong ND, Woo D, Turner MB. Heart disease and stroke statistics–2013 update: a report from the American Heart Association. Circulation. 2013;127:e6–e245. [DOI] [PMC free article] [PubMed] [Google Scholar]
- 2. Hassan A, Newman A, Ko DT, Rinfret S, Hirsch G, Ghali WA, Tu JV. Increasing rates of angioplasty versus bypass surgery in Canada, 1994–2005. Am Heart J. 2010;160:958–965. [DOI] [PubMed] [Google Scholar]
- 3. Epstein AJ, Polsky D, Yang F, Yang L, Groeneveld PW. Coronary revascularization trends in the United States, 2001–2008. JAMA. 2011;305:1769–1776. [DOI] [PMC free article] [PubMed] [Google Scholar]
- 4. Serruys PW, Morice MC, Kappetein AP, Colombo A, Holmes DR, Mack MJ, Stahle E, Feldman TE, van den Brand M, Bass EJ, Van Dyck N, Leadley K, Dawkins KD, Mohr FW. Percutaneous coronary intervention versus coronary‐artery bypass grafting for severe coronary artery disease. N Engl J Med. 2009;360:961–972. [DOI] [PubMed] [Google Scholar]
- 5. Farkouh ME, Domanski M, Sleeper LA, Siami FS, Dangas G, Mack M, Yang M, Cohen DJ, Rosenberg Y, Solomon SD, Desai AS, Gersh BJ, Magnuson EA, Lansky A, Boineau R, Weinberger J, Ramanathan K, Sousa JE, Rankin J, Bhargava B, Buse J, Hueb W, Smith CR, Muratov V, Bansilal S, King S III, Bertrand M, Fuster V. Strategies for multivessel revascularization in patients with diabetes. N Engl J Med. 2012;367:2375–2384. [DOI] [PubMed] [Google Scholar]
- 6. Brown JR, Robb JF, Block CA, Schoolwerth AC, Kaplan AV, O'Connor GT, Solomon RJ, Malenka DJ. Does safe dosing of iodinated contrast prevent contrast‐induced acute kidney injury? Circ Cardiovasc Interv. 2010;3:346–350. [DOI] [PMC free article] [PubMed] [Google Scholar]
- 7. Chertow GM, Burdick E, Honour M, Bonventre JV, Bates DW. Acute kidney injury, mortality, length of stay, and costs in hospitalized patients. J Am Soc Nephrol. 2005;16:3365–3370. [DOI] [PubMed] [Google Scholar]
- 8. James MT, Samuel SM, Manning MA, Tonelli M, Ghali WA, Faris P, Knudtson ML, Pannu N, Hemmelgarn BR. Contrast‐induced acute kidney injury and risk of adverse clinical outcomes after coronary angiography: a systematic review and meta‐analysis. Circ Cardiovasc Interv. 2013;6:37–43. [DOI] [PubMed] [Google Scholar]
- 9. Liangos O, Wald R, O'Bell JW, Price L, Pereira BJ, Jaber BL. Epidemiology and outcomes of acute renal failure in hospitalized patients: a national survey. Clin J Am Soc Nephrol. 2006;1:43–51. [DOI] [PubMed] [Google Scholar]
- 10. Hsu CY, Chertow GM, McCulloch CE, Fan D, Ordonez JD, Go AS. Nonrecovery of kidney function and death after acute on chronic renal failure. Clin J Am Soc Nephrol. 2009;4:891–898. [DOI] [PMC free article] [PubMed] [Google Scholar]
- 11. McCullough PA, Wolyn R, Rocher LL, Levin RN, O'Neill WW. Acute renal failure after coronary intervention: incidence, risk factors, and relationship to mortality. Am J Med. 1997;103:368–375. [DOI] [PubMed] [Google Scholar]
- 12. Rihal CS, Textor SC, Grill DE, Berger PB, Ting HH, Best PJ, Singh M, Bell MR, Barsness GW, Mathew V, Garratt KN, Holmes DR Jr. Incidence and prognostic importance of acute renal failure after percutaneous coronary intervention. Circulation. 2002;105:2259–2264. [DOI] [PubMed] [Google Scholar]
- 13. Finn WF. The clinical and renal consequences of contrast‐induced nephropathy. Nephrol Dial Transplant. 2006;21:i2–i10. [DOI] [PubMed] [Google Scholar]
- 14. Persson PB, Hansell P, Liss P. Pathophysiology of contrast medium‐induced nephropathy. Kidney Int. 2005;68:14–22. [DOI] [PubMed] [Google Scholar]
- 15. Project HCaU . Introduction to the HCUP nationwide inpatient sample (NIS). 2013.
- 16. Lenihan CR, Montez‐Rath ME, Mora Mangano CT, Chertow GM, Winkelmayer WC. Trends in acute kidney injury, associated use of dialysis, and mortality after cardiac surgery, 1999 to 2008. Ann Thorac Surg. 2013;95:20–28. [DOI] [PMC free article] [PubMed] [Google Scholar]
- 17. Hsu RK, McCulloch CE, Dudley RA, Lo LJ, Hsu CY. Temporal changes in incidence of dialysis‐requiring AKI. J Am Soc Nephrol. 2013;24:37–42. [DOI] [PMC free article] [PubMed] [Google Scholar]
- 18. Healthcare Cost and Utilization Project . HCUP comorbidity software. 2013;2014.
- 19. Waikar SS, Curhan GC, Wald R, McCarthy EP, Chertow GM. Declining mortality in patients with acute renal failure, 1988 to 2002. J Am Soc Nephrol. 2006;17:1143–1150. [DOI] [PubMed] [Google Scholar]
- 20. Johnson TP. Handbook of Health Survey Methods In: Copeland KR, Ganesh N, eds. Sample Weighting for Health Surveys. Hoboken, NJ: John Wiley & Sons, Inc; 2014:686–700. [Google Scholar]
- 21. Hoste EA, Schurgers M. Epidemiology of acute kidney injury: how big is the problem? Crit Care Med. 2008;36:S146–S151. [DOI] [PubMed] [Google Scholar]
- 22. Khera S, Kolte D, Aronow WS, Palaniswamy C, Mujib M, Ahmed A, Chugh SS, Balasubramaniyam N, Edupuganti M, Frishman WH, Fonarow GC. Trends in acute kidney injury and outcomes after early percutaneous coronary intervention in patients >/=75 years of age with acute myocardial infarction. Am J Cardiol. 2013;112:1279–1286. [DOI] [PubMed] [Google Scholar]
- 23. Amin AP, Salisbury AC, McCullough PA, Gosch K, Spertus JA, Venkitachalam L, Stolker JM, Parikh CR, Masoudi FA, Jones PG, Kosiborod M. Trends in the incidence of acute kidney injury in patients hospitalized with acute myocardial infarction. Arch Intern Med. 2012;172:246–253. [DOI] [PubMed] [Google Scholar]
- 24. Hsu RK, Hsu CY. Acute kidney injury: comment on “trends in the incidence of acute kidney injury in patients hospitalized with acute myocardial infarction”. Arch Intern Med. 2012;172:253–254. [DOI] [PMC free article] [PubMed] [Google Scholar]
- 25. Boyle JM, Moualla S, Arrigain S, Worley S, Bakri MH, Starling RC, Heyka R, Thakar CV. Risks and outcomes of acute kidney injury requiring dialysis after cardiac transplantation. Am J Kidney Dis. 2006;48:787–796. [DOI] [PubMed] [Google Scholar]
- 26. Mangano CM, Diamondstone LS, Ramsay JG, Aggarwal A, Herskowitz A, Mangano DT. Renal dysfunction after myocardial revascularization: risk factors, adverse outcomes, and hospital resource utilization. The Multicenter Study of Perioperative Ischemia Research Group. Ann Intern Med. 1998;128:194–203. [DOI] [PubMed] [Google Scholar]
- 27. Hoste EA, Clermont G, Kersten A, Venkataraman R, Angus DC, De Bacquer D, Kellum JA. Rifle criteria for acute kidney injury are associated with hospital mortality in critically ill patients: a cohort analysis. Crit Care. 2006;10:R73. [DOI] [PMC free article] [PubMed] [Google Scholar]
- 28. Mehta RL, Kellum JA, Shah SV, Molitoris BA, Ronco C, Warnock DG, Levin A. Acute kidney injury network: report of an initiative to improve outcomes in acute kidney injury. Crit Care. 2007;11:R31. [DOI] [PMC free article] [PubMed] [Google Scholar]
- 29. Grams ME, Waikar SS, MacMahon B, Whelton S, Ballew SH, Coresh J. Performance and limitations of administrative data in the identification of aki. Clin J Am Soc Nephrol. 2014;9:682–689. [DOI] [PMC free article] [PubMed] [Google Scholar]
- 30. Hsu CY, McCulloch CE, Fan D, Ordonez JD, Chertow GM, Go AS. Community‐based incidence of acute renal failure. Kidney Int. 2007;72:208–212. [DOI] [PMC free article] [PubMed] [Google Scholar]
- 31. Hwang YJ, Shariff SZ, Gandhi S, Wald R, Clark E, Fleet JL, Garg AX. Validity of the International Classification of Diseases, Tenth Revision code for acute kidney injury in elderly patients at presentation to the emergency department and at hospital admission. BMJ Open. 2012;2:e001821. [DOI] [PMC free article] [PubMed] [Google Scholar]
- 32. James M, Pannu N. Methodological considerations for observational studies of acute kidney injury using existing data sources. J Nephrol. 2009;22:295–305. [PubMed] [Google Scholar]
- 33. Vlasschaert ME, Bejaimal SA, Hackam DG, Quinn R, Cuerden MS, Oliver MJ, Iansavichus A, Sultan N, Mills A, Garg AX. Validity of administrative database coding for kidney disease: a systematic review. Am J Kidney Dis. 2011;57:29–43. [DOI] [PubMed] [Google Scholar]
- 34. Siew ED, Davenport A. The growth of acute kidney injury: a rising tide or just closer attention to detail? Kidney Int. 2015;87:46–61. [DOI] [PMC free article] [PubMed] [Google Scholar]
- 35. Siddiqui NF, Coca SG, Devereaux PJ, Jain AK, Li L, Luo J, Parikh CR, Paterson M, Philbrook HT, Wald R, Walsh M, Whitlock R, Garg AX. Secular trends in acute dialysis after elective major surgery—1995 to 2009. CMAJ. 2012;184:1237–1245. [DOI] [PMC free article] [PubMed] [Google Scholar]
- 36. Langabeer JR, Henry TD, Kereiakes DJ, Dellifraine J, Emert J, Wang Z, Stuart L, King R, Segrest W, Moyer P, Jollis JG. Growth in percutaneous coronary intervention capacity relative to population and disease prevalence. J Am Heart Assoc. 2013;2:e000370 doi: 10.1161/JAHA.113.000370. [DOI] [PMC free article] [PubMed] [Google Scholar]
- 37. Riley RF, Don CW, Powell W, Maynard C, Dean LS. Trends in coronary revascularization in the United States from 2001 to 2009: recent declines in percutaneous coronary intervention volumes. Circ Cardiovasc Qual Outcomes. 2011;4:193–197. [DOI] [PMC free article] [PubMed] [Google Scholar]
- 38. Waikar SS, Wald R, Chertow GM, Curhan GC, Winkelmayer WC, Liangos O, Sosa MA, Jaber BL. Validity of International Classification of Diseases, Ninth Revision, clinical modification codes for acute renal failure. J Am Soc Nephrol. 2006;17:1688–1694. [DOI] [PubMed] [Google Scholar]
- 39. Rahman M, Shad F, Smith MC. Acute kidney injury: a guide to diagnosis and management. Am Fam Physician. 2012;86:631–639. [PubMed] [Google Scholar]
- 40. Brown JR, McCullough PA, Splaine ME, Davies L, Ross CS, Dauerman HL, Robb JF, Boss R, Goldberg DJ, Fedele FA, Kellett MA, Phillips WJ, Ver Lee PN, Nelson EC, MacKenzie TA, O'Connor GT, Sarnak MJ, Malenka DJ. How do centres begin the process to prevent contrast‐induced acute kidney injury: a report from a new regional collaborative. BMJ Qual Saf. 2012;21:54–62. [DOI] [PMC free article] [PubMed] [Google Scholar]
- 41. Brown JR, Thompson CA. Contrast‐induced acute kidney injury: the at‐risk patient and protective measures. Curr Cardiol Rep. 2010;12:440–445. [DOI] [PubMed] [Google Scholar]
- 42. Parida S, Badhe AS. Cardiac surgery‐associated acute kidney injury. J Anesth. 2013;27:433–446. [DOI] [PubMed] [Google Scholar]
- 43. Ponce D, Zorzenon Cde P, dos Santos NY, Balbi AL. Early nephrology consultation can have an impact on outcome of acute kidney injury patients. Nephrol Dial Transplant. 2011;26:3202–3206. [DOI] [PubMed] [Google Scholar]
- 44. Tsai TT, Patel UD, Chang TI, Kennedy KF, Masoudi FA, Matheny ME, Kosiborod M, Amin AP, Messenger JC, Rumsfeld JS, Spertus JA. Contemporary incidence, predictors, and outcomes of acute kidney injury in patients undergoing percutaneous coronary interventions: insights from the NCDR Cath‐PCI registry. JACC Cardiovasc Interv. 2014;7:1–9. [DOI] [PMC free article] [PubMed] [Google Scholar]
- 45. Brown JR, Solomon RJ, Sarnak MJ, McCullough PA, Splaine ME, Davies L, Ross CS, Dauerman HL, Stender JL, Conley SM, Robb JF, Chaisson K, Boss R, Lambert P, Goldberg DJ, Lucier D, Fedele FA, Kellett MA, Horton S, Phillips WJ, Downs C, Wiseman A, MacKenzie TA, Malenka DJ. Reducing contrast‐induced acute kidney injury using a regional multicenter quality improvement intervention. Circ Cardiovasc Qual Outcomes. 2014;7:693–700. [DOI] [PMC free article] [PubMed] [Google Scholar]