

Abstract
Background
Light chain (AL) and transthyretin (ATTR) amyloidosis have a similar effect on myocardial function but very different disease trajectories and survival. However, limited data are available evaluating subtype‐specific predictors of outcomes in a large contemporary cohort.
Methods and Results
We retrospectively investigated 360 patients at the time of initial diagnosis of cardiac amyloidosis (191 AL and 169 ATTR) from 2002 to 2014. Clinical, laboratory, electrical, and morphologic covariates were evaluated based upon amyloid subtype. ATTR etiology was associated with older age, more chronic medical conditions, and the use of standard heart failure medical therapy. Left ventricular mass index and electrocardiographic voltage were higher in ATTR, while there was no difference in ejection fraction or markers of diastology between subtypes. A multivariable Cox model was generated using previously identified predictors of negative outcomes in cardiac amyloidosis and analyzed after stratification for subsequent amyloid‐specific treatment. An AL etiology was the most predictive variable (hazard ratio 3.143, P<0.001) of 3‐year all‐cause mortality. The only covariate that showed a significantly greater magnitude of effect on mortality in 1 amyloid subtype versus the other was amyloid‐specific treatment in AL (P=0.015). The magnitude of effect of other variables on mortality did not significantly differ between subtypes.
Conclusions
Clinical, morphological, electrical, and biomarker data do not significantly interact with amyloid subtype in its association with mortality, despite the fact that the prognosis in each subtype differs greatly. This suggests an additional factor or factors (such as light chain toxicity) contributing to poorer outcomes in AL amyloid.
Keywords: amyloid, cardiomyopathy, echocardiography, electrocardiography, prognosis
Subject Categories: Echocardiography, Nuclear Cardiology and PET, Electrocardiology (ECG), Heart Failure, Cardiomyopathy
Introduction
Amyloidosis is a protein‐misfolding disorder characterized by the deposition of insoluble abnormal amyloid fibrils into tissues, leading to organ dysfunction. Cardiac amyloid infiltration is most commonly due to immunoglobulin light chains (AL) secreted by clonal plasma cells or by transthyretin (ATTR), a protein produced by the liver (formerly called prealbumin).
The “gold standard” to diagnose cardiac amyloidosis is an endomyocardial biopsy. In cases of histologically confirmed extracardiac amyloid, echocardiographic criteria of septal thickness >12 mm in the absence of hypertension or valvular heart disease was used to define cardiac involvement.1 However, in the era of multimodality imaging, cardiac magnetic resonance imaging (CMR),2 echocardiography with strain,3 and technetium‐99m‐pyrophosphate [(99m)Tc‐PYP] scintigraphy4 are commonly relied upon to confirm the diagnosis of cardiac amyloidosis in the absence of a cardiac biopsy.
The prognosis for cardiac amyloidosis has notoriously been poor. Few studies have examined predictors of mortality at the time of a cardiac diagnosis of amyloidosis. Diastolic filling velocity and deceleration time,5 New York Heart Association (NHYA) class III‐IV symptoms,6, 7 low ECG voltage,8 global longitudinal strain,7 and estimated glomerular filtration rate7 have all been found to predict mortality in combined amyloidosis cohorts. However, there are significant differences between the 2 types of cardiac amyloidosis with respect to treatment options and prognosis, underscoring the importance of differentiating the 2 types. When compared to ATTR amyloidosis, patients with AL have a more rapid development of cardiac disease and worse survival.7, 9 Prognostic staging scores have been developed to recognize early cardiac involvement in AL and include troponin T (or high‐sensitivity troponin T), N‐terminal prohormone of brain natriuretic peptide (NT‐proBNP), and the serum free light chain difference.10 In ATTR, troponin T has been found to be the strongest predictor of mortality.11
A major limitation in previously published literature is that small sample size and event rate limited the ability to determine differences in predictors of mortality between the AL and ATTR subtypes. We sought to comprehensively describe clinical, laboratory, echocardiographic, and electrocardiographic variables in patients with newly diagnosed cardiac amyloidosis and compare subtype‐specific interactions and prognosis.
Methods
Study Population
The study cohort consisted of consecutive patients seen at our institution from 2002 to 2014 with confirmed cardiac amyloidosis of AL or ATTR type. A comprehensive baseline assessment was done on all patients including initial clinical evaluation and follow‐up as well as laboratory, electrocardiographic, and echocardiographic parameters. Data were adjudicated based upon the date of diagnosis of cardiac amyloidosis. Exclusion criteria included patients with an incomplete clinical assessment, unavailable laboratory or ECG data, or uninterpretable echocardiography at the time of cardiac diagnosis. Additionally, patients with AL amyloidosis who had previously undergone treatment with chemotherapy (for multiple myeloma, for example) were excluded. Informed consent was waived due to the retrospective nature of the trial.
Cardiac amyloid involvement was diagnosed based upon an appropriate clinical presentation coupled with endomyocardial biopsy or advanced imaging with CMR, echocardiography with strain, or (99m)Tc‐PYP scintigraphy. CMR was considered positive for amyloid cardiomyopathy if there were morphologic and structural abnormalities consistent with the diagnosis (wall thickening of the left ventricular [LV], right ventricular [RV], or interatrial septum and biatrial enlargement) coupled with abnormal myocardial nulling and diffuse or irregular delayed gadolinium enhancement of the LV myocardium. Echocardiographic criteria were met based upon structural and functional changes consistent with amyloid infiltration (increased anteroseptal or posterior wall thickness >12 mm without another cause of LV hypertrophy, biatrial enlargement, low tissue Doppler velocities, and short deceleration time) along with an apical sparing pattern of peak systolic longitudinal strain.3 Results of (99m)Tc‐PYP were considered positive or negative based upon expert clinician interpretation.
In patients included based upon an endomyocardial biopsy, tissue typing was used to differentiate AL from ATTR. In patients included based upon advanced imaging criteria, serum free light chains as well as bone marrow and/or extracardiac biopsy were used to diagnose AL. A diagnosis of ATTR was made after positive (99m)Tc‐PYP scintigraphy and/or TTR genetic testing. In cases where (99m)Tc‐PYP or genetic testing were unavailable, the diagnosis of ATTR was made based upon confirmatory CMR or echocardiography with strain along with a normal free light chain ratio and serum immunofixation.
Measurement Techniques
Electronic medical records were retrospectively reviewed for data within 3 months of the cardiac diagnosis. Laboratory data were measured in standard fashion. Estimated glomerular filtration rate was calculated by using the Chronic Kidney Disease Epidemiology Collaboration formula.12 Serum free light chain difference was defined as the level of the affected minus the unaffected light chain.
Twelve‐lead ECGs were performed using standard equipment and retrospectively reviewed for evidence of heart rate, rhythm, and voltage. Low limb lead voltage was defined as total QRS amplitude ≤0.5 mV in each of the standard limb leads I, II, and III. Sokolow voltage criteria was defined as a sum of the S wave voltage in V1 plus the R wave in lead V5 or V6 with ≤1.5 mV being considered low precordial voltage. Patients with ventricular pacing were excluded from the ECG analysis.
Transthoracic echocardiography was performed using commercially available Vivid 7 or Vivid 9 (GE Medical, Milwaukee, WI) or EPIQ (Philips Medical Systems, Bothell, WA) ultrasound systems. Echocardiographic parameters were prospectively measured in standard fashion as described by the American Society of Echocardiography guidelines.13 Anteroseptal and posterior wall thickness was assessed by 2‐dimensional measurements in the parasternal long axis view at the level of the mitral valve leaflet tips. Longitudinal strain measurements were performed offline using automated software in a subset of patients (EchoPAC Version 113, Advanced Analysis Technologies; GE Medical Systems) as previously described.3
Endomyocardial biopsy histology was reviewed by 2 cardiac pathologists experienced in cardiac amyloidosis. CMR was performed using 1.5 T or 3 T MR scanners (Philips Achieva, Best, Netherlands). CMR steady‐state free precession (SSFP) cine images were analyzed using Syngo imaging (Siemens AG Medical Solutions). (99m)Tc‐PYP scans were performed using single‐photon emission computed tomography with Siemens Symbia T6 cameras after patients received 20 mCi of (99m)Tc‐PYP intravenously.
Mortality was assessed by electronic medical records, and patients with incomplete follow‐up data were contacted by telephone.
Statistical Analysis
All data were tested for normal distribution using the Kolmogorov–Smirnov test. Categorical variables are presented as a percentage. Continuous variables are expressed as mean±SD or median with interquartile range. Categorical variables were analyzed for the difference between amyloid types using the Fisher's exact test and continuous variables using a 2‐tailed Student t test.
Survival analysis was performed individually for the AL and ATTR amyloid subtypes using an end point of all‐cause mortality. Patients were censored at the time of last follow‐up or at the time of heart transplantation or LV assist device. The unadjusted association between each variable and mortality was assessed using univariable Cox proportional hazards models. Subsequently, a test of interaction was used to assess the effect modification of amyloid subtype (AL or ATTR) on individual variables. Hazard ratios, 95% CIs, and P values of the tested variables were calculated. Univariable survival analyses are graphically represented using Kaplan–Meier curves.
A multivariable Cox model for mortality was developed in the subset of patients with complete data. The model was chosen by selecting variables that were clinically relevant and previously shown to suggest prediction in cardiac amyloidosis. The final model included estimated glomerular filtration rate, NYHA class ≥III, atrial fibrillation, ejection fraction, LV mass index, deceleration time, and Sokolow voltage. The area under the Receiver Operating Characteristics curve using the Harrell's C‐statistic was used to compare model discrimination. The interaction between amyloid subtype and each covariate was again tested in the multivariable model. In addition, each variable was stratified by the presence of subsequent amyloid‐specific treatment.
Patients with available data were divided into tertiles by Troponin T, NT‐proBNP, and free light chain difference values and mortality per month was calculated. Nested models were then used to compare the base model with sequential models after adding amyloid type and the cardiac biomarkers NT‐proBNP and Troponin T.
All statistical tests were 2‐sided and P<0.05 was considered significant. Data assembly and basic statistical comparisons were performed with JMP version 10.0 (JMP, Cary, NC) and advanced statistical analysis was performed using Stata (version 13; StataCorp LP, College Station, TX). The study was approved by the Cleveland Clinic Institutional Review Board.
Results
Patient Characteristics
A total of 427 patients with cardiac amyloidosis were screened for inclusion (Figure 1). The final study cohort consisted of 360 patients: 191 with AL and 169 with ATTR amyloidosis. There were 254 (71%) patients included based upon endomyocardial biopsy (Figure 2). The baseline demographic data are summarized in Table 1. Patients with ATTR were significantly older (75.3 versus 64.7 years old) and more likely to have chronic medical conditions such as hypertension (63.9% versus 47.1%), hyperlipidemia (58% versus 43.5%), atrial fibrillation (55% versus 34%), and impaired renal function (estimated glomerular filtration rate 59.9 versus 65.4 mL/min per 1.73 m²). They were also more likely to be on standard systolic heart failure therapy of β‐blockers (57.4% versus 38.3%) or angiotensin‐converting enzyme inhibitors or angiotensin receptor blockers (43.8% versus 31.9%). The baseline severity of functional heart failure symptoms was similar in the 2 groups as represented by NYHA class and diuretic use.
Figure 1.
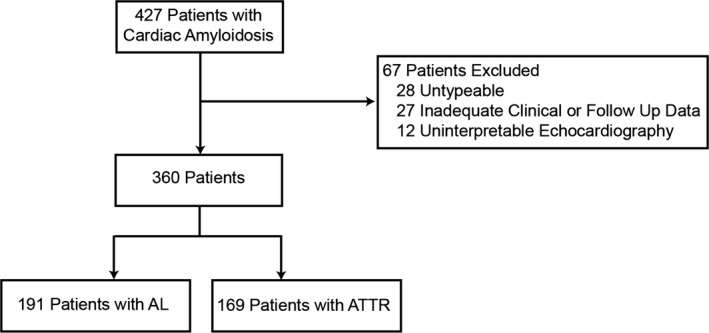
CONSORT flow chart detailing study population. AL indicates immunoglobulin light chains; ATTR, transthyretin; CONSORT, Consolidated Standards of Reporting Trials.
Figure 2.
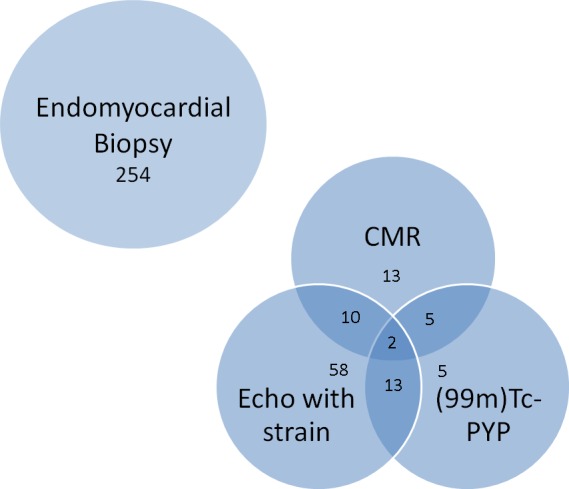
Diagnostic method for inclusion of 360 total patients. CMR, cardiac magnetic resonance imaging; (99m)Tc‐PYP, technetium‐99m‐pyrophosphate.
Table 1.
Baseline Clinical Characteristics
| Variable | AL (n=191) | ATTR (n=169) | P Value |
|---|---|---|---|
| Age, y | 64.7±11.0 | 75.3±8.9 | <0.001 |
| Male | 116 (61) | 136 (81) | <0.001 |
| White | 157 (82) | 112 (66) | <0.001 |
| Body surface area, m2 | 1.92±0.26 | 2.00±0.24 | 0.005 |
| Hypertension | 90 (47) | 108 (64) | 0.002 |
| Hyperlipidemia | 80 (44) | 98 (58) | 0.006 |
| Diabetes mellitus | 47 (25) | 48 (28) | 0.472 |
| Smoking | 92 (48) | 93 (55) | 0.197 |
| Atrial fibrillation | 65 (34) | 93 (55) | <0.001 |
| Anemia | 80 (44) | 80 (47) | 0.525 |
| CAD requiring PCI or CABG | 33 (17) | 42 (25) | 0.091 |
| NYHA class ≥3 | 122 (64) | 104 (61) | 0.743 |
| eGFR, mL/min per 1.73 m² | 65.4±26.4 | 59.9±23.4 | 0.039 |
| β‐Blocker | 73 (38) | 97 (57) | <0.001 |
| ACEI/ARB | 61 (32) | 74 (44) | 0.022 |
| Antihypertensive | 118 (62) | 126 (75) | 0.013 |
| Diuretic | 158 (83) | 139 (82) | 1.000 |
| Amyloid‐specific treatment | 135 (71) | 44 (26) | <0.001 |
Data were summarized as frequency n (%) for descriptive data. Continuous variables were expressed as either mean±SD or median (interquartile range). ACEI indicates angiotensin‐converting enzyme inhibitor; AL, immunoglobulin light chains; ARB, angiotensin II receptor blocker; ATTR, transthyretin; CABG, coronary artery bypass graft; CAD, coronary artery disease; eGFR, estimated glomerular filtration rate; NYHA, New York Heart Association; PCI, percutaneous coronary intervention.
Table 2 depicts the baseline echocardiographic, electrocardiographic, and biomarker characteristics of the cohort. The mean ejection fraction was mildly reduced (47.4% AL, 46.1% ATTR), while longitudinal function as assessed by global longitudinal strain was severely impaired in both groups (−9.4 AL, −8.1 ATTR). Patients with ATTR had a significantly greater septal wall thickness, LV mass index, QRS duration, and ECG voltage. However, diastolic parameters and right‐sided pressures were similar between amyloid subtypes. The cohort with AL amyloidosis had a significantly higher NT‐proBNP and a trend toward an increased Troponin T at presentation as compared to those with ATTR.
Table 2.
Baseline Echocardiographic, Electrocardiographic, and Biomarker Parameters
| Variable | AL (n=191) | ATTR (n=169) | P Value | P Valuea |
|---|---|---|---|---|
| Echocardiography | ||||
| Ejection fraction (%) | 50 [40, 57] | 50 [35, 57] | 0.423 | 0.344 |
| Anteroseptal thickness, mm | 17.2±3.7 | 19.1±4.3 | <0.001 | 0.034 |
| Posterior wall thickness, mm | 15.3±3.1 | 16.9±3.3 | <0.001 | 0.002 |
| LVEDD, mm | 40.2±7.0 | 41.3±6.7 | 0.159 | 0.145 |
| LVESD, mm | 29.3±7.5 | 31.3±7.2 | 0.013 | 0.221 |
| MR grade ≥3 | 10 (5) | 11 (7) | 0.657 | 0.619 |
| TR grade ≥3 | 24 (13) | 28 (17) | 0.296 | 0.624 |
| RVSP, mm Hg | 37.8±13.0 | 40.0±13.0 | 0.132 | 0.423 |
| MV deceleration time, ms | 170.8±49.4 | 172.9±53.6 | 0.718 | 0.685 |
| Average E/e′ | 22.0±9.8 | 20.6±9.1 | 0.221 | 0.081 |
| LV mass index, g/m2 | 137.5 [110.5, 167.5] | 159.0 [128.8, 201.0] | <0.001 | 0.004 |
| Global LSb | −9.42 [−7.08, −12.06] | −8.10 [−6.55, −10.58] | 0.166 | 0.500 |
| Electrocardiographyc | ||||
| QRS duration, ms | 100.8±21.3 | 112.9±27.8 | <0.001 | 0.010 |
| Total limb voltage, mm | 13.2±6.9 | 16.9±7.3 | <0.001 | 0.001 |
| Sokolow voltage, mm | 11.7±6.7 | 14.0±8.1 | 0.009 | 0.003 |
| Low limb voltage, mm | 119 (70) | 75 (53) | 0.004 | 0.001 |
| Biomarkers | ||||
| Troponin T, ng/mLd | 0.08 [0.03, 0.15] | 0.06 [0.02, 0.12] | 0.200 | 0.967 |
| NT‐proBNP, pg/mLb | 7159 [3431, 13 778] | 3478 [1842, 7726] | 0.001 | 0.003 |
| FLC‐diff, mg/Le | 291 [149, 848] | |||
AL indicates immunoglobulin light chains; ATTR, transthyretin; E/e', ratio of mitral valve early filling wave to early diastolic annular velocity; FLC‐diff, free light chain difference (affected minus unaffected light chain level); LS, longitudinal strain; LV, left ventricle; LVEDD, left ventricular end diastolic diameter; LVESD, left ventricular end systolic diameter; MR, mitral regurgitation; MV, mitral valve; NT‐proBNP, N‐terminal prohormone of brain natriuretic peptide; RVSP, right ventricular systolic pressure; TR, tricuspid regurgitation.
Controlled for age, sex, eGFR, race, hypertension, and diabetes.
AL=97, ATTR=101.
AL=170, ATTR=141.
AL=133, ATTR=106.
N=137.
In patients with AL amyloidosis, 38 (20%) had coexisting multiple myeloma while 135 (71%) went on to receive chemotherapy. Dexamethasone was used in all treated cases with the addition of additional agents depending upon the clinical scenario. Sixteen underwent stem cell transplantation. In the ATTR cohort, 26% subsequently received amyloid‐specific treatment including doxycycline, diflunisal, green tea extract, tafamidis, or small interfering RNA. Of the 126 patients who had genetic testing, 40.5% were classified as hereditary (ATTRm) and 59.5% wild type (ATTRwt). The most common genetic variant was Val122Ile, which was found in 37 patients (64%) of those who were gene positive (Table S1).
Outcomes
Overall, there were 545.5 patient years of follow‐up. Median follow‐up for the combined cohort was 337 days (68–843). The group of patients with an AL etiology of cardiac amyloidosis had a median follow‐up of 159 days (31–561), while the ATTR cohort had a median follow‐up of 498 days (185–969) (P<0.001).
After censoring follow‐up at 3 years, 56% of all patients met the end point of mortality. In the patients with AL amyloidosis, 138 died corresponding to a 72% mortality rate, while there were 65 deaths in ATTR translating to a 38% mortality rate. Thirteen patients received a heart transplant or LV assist device over the course of the study period: 3 in the AL group and 10 in the ATTR group. The 1‐year mortality rate was 41% overall, with 113 deaths in patients with AL subtype (59%) and 34 with ATTR subtype (20%).
Predictors of Outcome
Univariable Cox models were performed with results seen in Table 3. Predictors of mortality common to both etiologies were age, ejection fraction, NYHA class ≥3, severe tricuspid regurgitation, global longitudinal strain, low voltage by either limb or precordial criteria, Troponin T, and NT‐proBNP. The cohort of patients with AL cardiac amyloidosis showed worse outcomes in those with diabetes, atrial fibrillation, and a lower average E/e′. In those with ATTR cardiac amyloidosis, higher body surface area, QRS duration, and LV end diastolic dimension and lower LV mass index were additional predictors of mortality. Amyloid‐specific treatment was highly predictive of improved outcomes in AL (P<0.001) and trended towards significance in ATTR (P=0.064). The interaction between amyloid‐specific treatment and subtype was significant, suggesting that treatment is more associated with decreased mortality in the AL subtype (P=0.015).
Table 3.
Univariable Association With Mortality by Amyloid Subtype
| Variable | AL (n=191) | ATTR (n=169) | Total Cohort (n=360) | P Valuea | |||
|---|---|---|---|---|---|---|---|
| HR (95% CI) | P Value | HR (95% CI) | P Value | HR (95% CI) | P Value | ||
| AL subtype | 2.734 (2.038–3.667) | <0.001 | |||||
| Age | 1.021 (1.005–1.036) | 0.009 | 1.035 (1.004–1.067) | 0.028 | 0.997 (0.985–1.009) | 0.632 | 0.677 |
| eGFR | 0.996 (0.990–1.003) | 0.240 | 0.988 (0.977–1.000) | 0.058 | 0.997 (0.991–1.003) | 0.339 | 0.427 |
| Atrial fibrillation | 1.515 (1.073–2.140) | 0.018 | 1.208 (0.743–1.964) | 0.445 | 1.073 (0.815–1.414) | 0.615 | 0.345 |
| Diabetes mellitus | 1.708 (1.168–2.497) | 0.006 | 1.381 (0.823–2.318) | 0.221 | 1.404 (1.036–1.902) | 0.029 | 0.296 |
| NYHA Class ≥3 | 2.360 (1.628–3.419) | <0.001 | 2.665 (1.516–4.686) | 0.001 | 2.277 (1.674–3.098) | <0.001 | 0.954 |
| Body surface area (per Δ 0.1) | 0.933 (0.865–1.001) | 0.072 | 0.831 (0.749–0.922) | <0.001 | 0.873 (0.821–0.927) | <0.001 | 0.172 |
| Anemia | 1.376 (0.984–1.925) | 0.062 | 1.570 (0.970–2.543) | 0.066 | 1.375 (1.045–1.810) | 0.023 | 0.738 |
| Antihypertensive | 0.862 (0.612–1.214) | 0.395 | 0.916 (0.515–1.629) | 0.765 | 0.737 (0.551–0.984) | 0.039 | 0.689 |
| Amyloid‐specific treatment | 0.258 (0.179–0.371) | <0.001 | 0.554 (0.297–1.036) | 0.064 | 0.829 (0.630–1.091) | 0.180 | 0.015 |
| Echocardiography | |||||||
| Ejection fraction | 0.974 (0.963–0.985) | <0.001 | 0.968 (0.952–0.984) | <0.001 | 0.976 (0.967–0.985) | <0.001 | 0.812 |
| LVEDD | 1.000 (0.975–1.026) | 0.985 | 0.955 (0.918–0.994) | 0.023 | 0.980 (0.960–1.001) | 0.064 | 0.054 |
| LVESD | 1.022 (0.998–1.046) | 0.077 | 0.996 (0.962–1.031) | 0.816 | 1.001 (0.982–1.021) | 0.918 | 0.170 |
| LV mass index | 1.000 (0.997–1.004) | 0.784 | 1.005 (1.001–1.010) | 0.030 | 1.000 (0.997–1.002) | 0.764 | 0.132 |
| TR grade ≥3 | 2.183 (1.347–3.539) | 0.002 | 2.404 (1.396–4.139) | 0.002 | 1.840 (1.291–2.623) | 0.001 | 0.785 |
| Deceleration time | 0.997 (0.993–1.001) | 0.105 | 0.998 (0.993–1.003) | 0.367 | 0.997 (0.994–1.000) | 0.065 | 0.687 |
| Average E/e′ | 1.024 (1.006–1.043) | 0.009 | 1.000 (0.972–1.030) | 0.987 | 1.018 (1.003–1.034) | 0.022 | 0.127 |
| Global LSb | 1.136 (1.026–1.259) | 0.015 | 1.165 (1.034–1.313) | 0.012 | 1.081 (1.011–1.156) | 0.023 | 0.920 |
| Electrocardiographyc | |||||||
| Limb voltage | 0.942 (0.912–0.973) | <0.001 | 0.954 (0.915–0.994) | 0.025 | 0.933 (0.910–0.957) | <0.001 | 0.464 |
| Sokolow voltage | 0.964 (0.937–0.993) | 0.015 | 0.953 (0.914–0.993) | 0.023 | 0.955 (0.932–0.978) | <0.001 | 0.784 |
| QRS duration | 1.004 (0.996–1.011) | 0.302 | 1.013 (1.005–1.022) | 0.003 | 1.003 (0.997–1.008) | 0.300 | 0.167 |
| Biomarkers | |||||||
| Log Troponin Td | 1.490 (1.258–1.764) | <0.001 | 1.659 (1.328–2.073) | <0.001 | 1.549 (1.354–1.772) | <0.001 | 0.605 |
| Log NT‐proBNPe | 1.527 (1.225–1.903) | <0.001 | 1.741 (1.265–2.396) | 0.001 | 1.707 (1.422–2.050) | <0.001 | 0.680 |
| Log FLC‐diff | 1.155 (0.992–1.346) | 0.064 | |||||
AL indicates immunoglobulin light chains; ATTR, transthyretin; E/e', ratio of mitral valve early filling wave to early diastolic annular velocity; eGFR, estimated glomerular filtration rate; FLC‐diff, free light chain difference (affected minus unaffected light chain level); HR, hazard ratio; LS, longitudinal strain; LV, left ventricle; LVEDD, left ventricular end diastolic diameter; LVESD, left ventricular end systolic diameter; NT‐proBNP, N‐terminal prohormone of brain natriuretic peptide; NYHA, New York Heart Association; TR, tricuspid regurgitation.
For association of the interaction term between amyloid type and covariate with the composite end point of all‐cause mortality.
n=137.
AL=170, ATTR=141.
AL=133, ATTR=106.
AL=97, ATTR=101.
The multivariable model (Table 4) after stratifying the results by amyloid‐specific treatment demonstrated that AL amyloid type, ejection fraction, and NYHA class ≥III were associated with mortality. The discrimination of the overall model as measured by the C‐statistic was 0.730 (95% CI 0.692–0.769, P<0.001). When the multivariable model in the total cohort was re‐examined using only variables found to be significant in the univariable analysis, the above variables remained associated with mortality. Additional variables associated with mortality included a lower body surface area and presence of anemia.
Table 4.
Multivariable Model Stratified by Amyloid‐Specific Treatment
| Variable | AL (n=158) | ATTR (n=133) | Total Cohort (n=291) | P Valuea | |||
|---|---|---|---|---|---|---|---|
| HR (95% CI) | P Value | HR (95% CI) | P Value | HR (95% CI) | P Value | ||
| AL subtype | 5.803 (3.734–9.021) | <0.001 | |||||
| eGFR | 0.997 (0.989–1.006) | 0.537 | 0.991 (0.978–1.004) | 0.165 | 0.997 (0.990–1.004) | 0.415 | 0.638 |
| NYHA class ≥3 | 1.538 (0.971–2.436) | 0.067 | 2.125 (1.096–4.122) | 0.026 | 1.822 (1.253–2.651) | 0.002 | 0.910 |
| Atrial fibrillation | 1.496 (1.003–2.231) | 0.048 | 1.272 (0.710–2.279) | 0.419 | 1.356 (0.974–1.888) | 0.071 | 0.430 |
| Ejection fraction | 0.987 (0.970–1.004) | 0.142 | 0.975 (0.955–0.996) | 0.020 | 0.985 (0.972–0.997) | 0.019 | 0.421 |
| LV mass index | 1.001 (0.997–1.005) | 0.628 | 1.005 (0.999–1.012) | 0.105 | 1.002 (0.998–1.006) | 0.261 | 0.161 |
| Deceleration time | 1.000 (0.995–1.005) | 0.888 | 1.001 (0.996–1.006) | 0.759 | 1.000 (0.996–1.003) | 0.993 | 0.993 |
| Sokolow voltage | 0.975 (0.942–1.009) | 0.151 | 0.979 (0.938–1.021) | 0.322 | 0.976 (0.950–1.002) | 0.071 | 0.912 |
Harrell's C‐statistic 0.730 (95% CI 0.692–0.769, P<0.001). AL indicates immunoglobulin light chains; ATTR, transthyretin; eGFR, estimated glomerular filtration rate; HR, hazard ratio; LV, left ventricle; NYHA, New York Heart Association.
For association of the interaction term between amyloid type and the covariate with the composite end point of all‐cause mortality, heart transplantation or LV assist device after controlling for the other variables in the multivariable model.
Survival curves by amyloid subtype are displayed in Figure 3A after adjusting for the covariates in the multivariable model. Figure 3B shows survival curves stratified by subsequent amyloid‐specific treatment. The year of diagnosis was not associated with mortality after adjusting for variables in the multivariable model (hazard ratio 0.979, 95% CI 0.933–1.027, P=0.382). In addition, there was no difference in time to mortality in ATTRm versus ATTRwt (hazard ratio 1.01, 95% CI 0.56–1.80, P=0.979).
Figure 3.
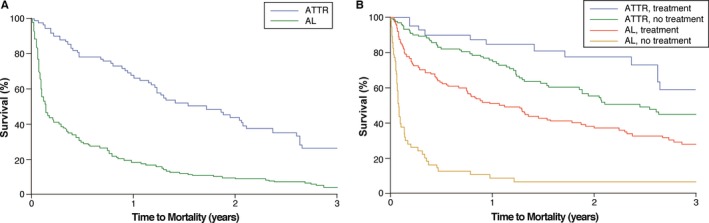
Kaplan–Meier survival curves by amyloid subtype. A, Survival curves by amyloid subtype after adjustment for eGFR, NYHA class ≥III, atrial fibrillation, ejection fraction, LV mass index, deceleration time, and Sokolow voltage index. B, Survival curves stratified by amyloid‐specific treatment. AL indicates immunoglobulin light chains; ATTR, transthyretin; eGFR, estimated glomerular filtration rate; LV, left ventricular; NYHA, New York Heart Association.
Tests of interaction between covariates and amyloid subtype are also seen in Tables 3 and 4. The only covariate that showed a significantly greater magnitude of effect on mortality in 1 amyloid subtype versus the other was amyloid‐specific treatment in AL. When covariates in the multivariable model were analyzed, none were found to act differently between amyloid subtypes.
Figure 4 demonstrates the association between tertile of Troponin T, NT‐proBNP, and free light chain difference and the monthly mortality rate. Increased levels of Troponin T and NT‐proBNP were correlated with a higher monthly mortality. There was incremental utility in amyloid subtype and cardiac biomarkers as compared to the base model. The χ2 for a nested model incorporating amyloid subtype was significantly improved (24.6 versus 15.7, P=0.003) and the addition of cardiac biomarkers improved it further (χ2 31.1, P=0.039).
Figure 4.
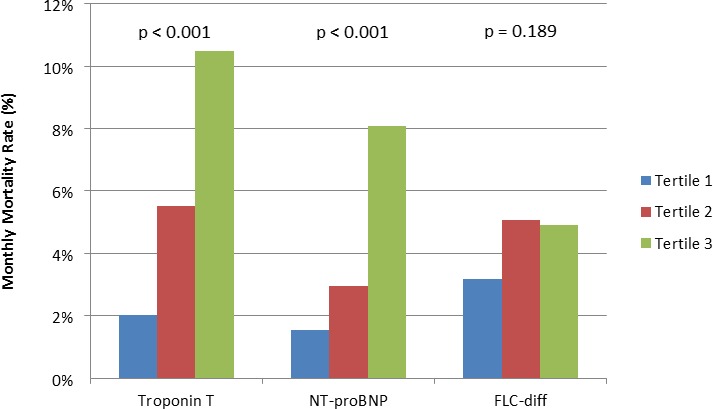
Monthly mortality by biomarker tertile for all patients with cardiac amyloidosis. Troponin T: tertile 1 ≤0.04, tertile 2 0.04 to 0.1, tertile 3 ≥0.10. NT‐proBNP: tertile 1 <3075, tertile 2 3075 to 7930, tertile 3 >7930. FLC‐diff: tertile 1 <199.84, tertile 2 199.84 to 561.88, tertile 3 >561.88. FLC‐diff, free light chain difference; NT‐proBNP, N‐terminal prohormone of brain natriuretic peptide.
Discussion
This study describes a large contemporary cohort of patients with cardiac amyloidosis and examines the characteristics associated with mortality between amyloid subtypes. The only covariate that showed a significantly greater magnitude of effect on mortality in 1 amyloid subtype versus the other was the use of amyloid‐specific treatment in AL. After multivariable analysis while controlling for amyloid‐specific therapy, atrial fibrillation was significantly prognostic in AL while NYHA class III‐IV symptoms at presentation as well as LV ejection fraction were associated with mortality in ATTR. AL amyloid etiology (as compared to ATTR) is the strongest predictive variable; however, effect modification analysis did not show that any covariate significantly interacted with amyloid subtype in the prediction of mortality.
The longevity of patients with amyloidosis is directly related to cardiac involvement. Significant cardiac involvement may limit a patient's ability to qualify for invasive therapy targeting the underlying disease process such as stem cell transplantation for AL14 or liver transplantation for ATTR.15 Predictors of mortality in patients at the time of diagnosis of cardiac involvement are not well established. There are few studies examining such predictors, and these studies have been generally underpowered to detect differences between amyloid subtypes. This is an important distinction to make as AL amyloid behaves very differently from ATTR with a more acute presentation, rapid progression, and worse overall prognosis. This study is able to more adequately evaluate this question with a multivariable model given the larger sample size and high event rate.
Comparisons of the baseline clinical characteristics of amyloid subtypes reveals that, as expected, patients with an ATTR etiology of cardiac amyloidosis were more likely to be older with more chronic medical conditions such as hypertension, hyperlipidemia, atrial fibrillation, prolonged QRS duration, and chronic kidney disease. They were also more commonly prescribed standard systolic heart failure therapy of angiotensin‐converting enzyme inhibitors, angiotensin II receptor blockers, and β‐blockers, despite the fact that these have not been rigorously studied in the amyloid population. Our cohort did not find that β‐blocker use at baseline was associated with mortality; however we feel that this therapy may be detrimental in some patients due the suppression of heart rate and heart rate response in the setting of a restricted ventricle with a fixed stroke volume.6 Analysis of echocardiographic parameters showed a significantly increased LV mass and ECG voltage in ATTR versus AL etiology, while ejection fraction and diastolic function were comparable.
In multivariable analysis, AL amyloid type, ejection fraction, and NYHA class ≥III were associated with mortality, corroborating prior data. Troponin T and NT‐proBNP were also found to be predictive of mortality, while free light chain difference trended towards significance in the AL population. When amyloid subtype and cardiac biomarkers were added to the base model, there was a significant improvement in χ2 from 15.7 to 31.1.
Differences Between Amyloid Subtypes
Given the large sample size and high event rate, we were able to create multivariable models for each amyloid subtype and assess the association with mortality. Ejection fraction and NYHA class ≥III were associated with mortality in ATTR, while only atrial fibrillation was significant in AL with a trend towards significance for NYHA class. These results were stratified by amyloid‐specific treatment, which was not taken into account in prior studies. This suggests that the prevalence of atrial fibrillation in AL amyloidosis is especially detrimental and correlated with mortality. On the other hand, markers of functional capacity and LV systolic function were more associated with death in ATTR.
Interaction testing was also used to discern whether the magnitude of the effect of a given variable on mortality differed between amyloid subtypes. No variable was shown to hold differential prognostic ability between subtypes. Though there was a striking difference in mortality rates between AL and ATTR subtypes, no clinical, echocardiographic, electrocardiographic, or biomarker covariate showed a significantly greater magnitude of effect on mortality in 1 disease as opposed to the other. Hypotension and inability to tolerate antihypertensive therapy is more common in the AL subtype and may be postulated to be detrimental; however, it was not significantly associated with mortality in our cohort.
These findings add to the emerging notion that light chain cardiac toxicity may at least partially explain the acute illness seen in many patients with AL amyloidosis. The degree of light chain abnormality is indeed prognostic in this and prior cohorts.10 We have anecdotally seen improvements in echocardiographic parameters and heart failure symptoms after initiation of chemotherapy. However, it is currently unknown whether treatment with chemotherapy affects diastolic or longitudinal strain parameters; this is an area for future research.
Moreover, we found no difference in 3‐year mortality when patients were stratified by year of diagnosis. The lack of improvement in outcomes over time speaks to the disease severity of this population and the extremely poor prognosis despite novel treatments. Patients with AL amyloidosis presenting to a cardiologist with heart failure symptoms have not been studied by current chemotherapeutic regimens. There is a need for clinical trials in AL disease using novel agents in the setting of cardiac involvement.
Our study has several strengths. First, we include only patients with biopsy‐proven cardiac amyloidosis or a high clinical suspicion of cardiac involvement plus confirmation with advanced multimodality imaging and genetic testing. Prior studies used less stringent inclusion criteria, including patients with interventricular septal thickness >12 mm without a history of severe hypertension or valvular heart disease.4, 7, 8, 9, 11 This may have led to an overinclusion of lower‐risk patients thought to have amyloid cardiomyopathy. In this era of advanced multimodality imaging sensitive and specific for the diagnosis of cardiac amyloidosis, we feel that these modalities should be the minimum diagnostic standard of care in both clinical practice and research investigation. Second, we have followed patients for mortality while several previous studies have used broader composite end points including hospitalization,8 incident heart failure,7 and other major adverse cardiac events.9 In addition, we stratify patients by the presence of amyloid‐specific treatment, which was not taken into account in prior work. Patients who were subsequently treated for AL and ATTR had decreased mortality in our cohort. This is hypothesis generating in our retrospective analysis and warrants further study. Finally, we have sufficient patients and events to adequately power a multivariable prediction model.
Study Limitations
This study was retrospective in nature and conducted at a large tertiary referral center, which may introduce selection bias and limit generalizability. Assessment of baseline characteristics was done via chart review, limiting data acquisition to that which was documented. Patients may have been diagnosed at different phases of the disease (lead time bias), thus clouding the interpretation of baseline characteristics and the natural history of disease. Our study takes into account therapy for AL and ATTR; however, it does not account for changes in heart failure or amyloid‐specific therapy, which may have affected outcomes.
We did not further subdivide the ATTR cohort into wild type (senile) versus hereditary cardiac amyloidosis for the primary analysis; however, we included baseline characteristics in Table S1. While studies have made the case for differentiating AL from ATTR, there is not the same evidence for differences in the disease course or predictors of mortality between wild type and hereditary etiologies. The 2 subtypes of ATTR have been postulated to act differently; however, recent analyses have shown no difference in outcomes.7, 9, 11 There was no difference in the mortality rate between genetically positive and negative patients in our study.
Conclusions
Clinical, morphological, electrical, and biomarker data do not significantly interact with amyloid subtype in its association with mortality, despite the fact that the prognosis in each subtype differs greatly. This suggests an additional factor or factors (such as light chain toxicity) contributing to poorer outcomes in AL amyloid.
Disclosures
None.
Supporting information
Table S1. Comparison of Hereditary and Wild Type (Senile) Transthyretin Cardiac Amyloidosis
(J Am Heart Assoc. 2016;5:e002877 doi: 10.1161/JAHA.115.002877)
An accompanying Table S1 is available at http://jaha.ahajournals.org/content/5/3/e002877/suppl/DC1
References
- 1. Guidelines Working Group of UKMF, British Committee for Standards in Haematology BSfH . Guidelines on the diagnosis and management of AL amyloidosis. Br J Haematol. 2004;125:681–700. [DOI] [PubMed] [Google Scholar]
- 2. Austin BA, Tang WH, Rodriguez ER, Tan C, Flamm SD, Taylor DO, Starling RC, Desai MY. Delayed hyper‐enhancement magnetic resonance imaging provides incremental diagnostic and prognostic utility in suspected cardiac amyloidosis. JACC Cardiovasc Imaging. 2009;2:1369–1377. [DOI] [PubMed] [Google Scholar]
- 3. Phelan D, Collier P, Thavendiranathan P, Popovic ZB, Hanna M, Plana JC, Marwick TH, Thomas JD. Relative apical sparing of longitudinal strain using two‐dimensional speckle‐tracking echocardiography is both sensitive and specific for the diagnosis of cardiac amyloidosis. Heart. 2012;98:1442–1448. [DOI] [PubMed] [Google Scholar]
- 4. Bokhari S, Castano A, Pozniakoff T, Deslisle S, Latif F, Maurer MS. (99m)Tc‐pyrophosphate scintigraphy for differentiating light‐chain cardiac amyloidosis from the transthyretin‐related familial and senile cardiac amyloidoses. Circ Cardiovasc Imaging. 2013;6:195–201. [DOI] [PMC free article] [PubMed] [Google Scholar]
- 5. Klein AL, Hatle LK, Taliercio CP, Oh JK, Kyle RA, Gertz MA, Bailey KR, Seward JB, Tajik AJ. Prognostic significance of Doppler measures of diastolic function in cardiac amyloidosis. A Doppler echocardiography study. Circulation. 1991;83:808–816. [DOI] [PubMed] [Google Scholar]
- 6. Austin BA, Duffy B, Tan C, Rodriguez ER, Starling RC, Desai MY. Comparison of functional status, electrocardiographic, and echocardiographic parameters to mortality in endomyocardial‐biopsy proven cardiac amyloidosis. Am J Cardiol. 2009;103:1429–1433. [DOI] [PubMed] [Google Scholar]
- 7. Quarta CC, Solomon SD, Uraizee I, Kruger J, Longhi S, Ferlito M, Gagliardi C, Milandri A, Rapezzi C, Falk RH. Left ventricular structure and function in transthyretin‐related versus light‐chain cardiac amyloidosis. Circulation. 2014;129:1840–1849. [DOI] [PubMed] [Google Scholar]
- 8. Cyrille NB, Goldsmith J, Alvarez J, Maurer MS. Prevalence and prognostic significance of low QRS voltage among the three main types of cardiac amyloidosis. Am J Cardiol. 2014;114:1089–1093. [DOI] [PubMed] [Google Scholar]
- 9. Rapezzi C, Merlini G, Quarta CC, Riva L, Longhi S, Leone O, Salvi F, Ciliberti P, Pastorelli F, Biagini E, Coccolo F, Cooke RM, Bacchi‐Reggiani L, Sangiorgi D, Ferlini A, Cavo M, Zamagni E, Fonte ML, Palladini G, Salinaro F, Musca F, Obici L, Branzi A, Perlini S. Systemic cardiac amyloidoses: disease profiles and clinical courses of the 3 main types. Circulation. 2009;120:1203–1212. [DOI] [PubMed] [Google Scholar]
- 10. Kumar S, Dispenzieri A, Lacy MQ, Hayman SR, Buadi FK, Colby C, Laumann K, Zeldenrust SR, Leung N, Dingli D, Greipp PR, Lust JA, Russell SJ, Kyle RA, Rajkumar SV, Gertz MA. Revised prognostic staging system for light chain amyloidosis incorporating cardiac biomarkers and serum free light chain measurements. J Clin Oncol. 2012;30:989–995. [DOI] [PMC free article] [PubMed] [Google Scholar]
- 11. Kristen AV, Scherer K, Buss S, aus dem Siepen F, Haufe S, Bauer R, Hinderhofer K, Giannitsis E, Hardt S, Haberkorn U, Katus HA, Steen H. Noninvasive risk stratification of patients with transthyretin amyloidosis. JACC Cardiovasc Imaging. 2014;7:502–510. [DOI] [PubMed] [Google Scholar]
- 12. Levey AS, Stevens LA, Schmid CH, Zhang YL, Castro AF III, Feldman HI, Kusek JW, Eggers P, Van Lente F, Greene T, Coresh J. A new equation to estimate glomerular filtration rate. Ann Intern Med. 2009;150:604–612. [DOI] [PMC free article] [PubMed] [Google Scholar]
- 13. Lang RM, Badano LP, Mor‐Avi V, Afilalo J, Armstrong A, Ernande L, Flachskampf FA, Foster E, Goldstein SA, Kuznetsova T, Lancellotti P, Muraru D, Picard MH, Rietzschel ER, Rudski L, Spencer KT, Tsang W, Voigt JU. Recommendations for cardiac chamber quantification by echocardiography in adults: an update from the American Society of Echocardiography and the European Association of Cardiovascular Imaging. J Am Soc Echocardiogr. 2015;28:1–39.e14. [DOI] [PubMed] [Google Scholar]
- 14. Gertz MA, Lacy MQ, Dispenzieri A, Kumar SK, Dingli D, Leung N, Hogan WJ, Buadi FK, Hayman SR. Refinement in patient selection to reduce treatment‐related mortality from autologous stem cell transplantation in amyloidosis. Bone Marrow Transplant. 2013;48:557–561. [DOI] [PubMed] [Google Scholar]
- 15. Okamoto S, Wixner J, Ericzon BG, Friman S, Lindqvist P, Henein M, Suhr OB. Prognostic value of pre‐transplant cardiomyopathy in Swedish liver transplanted patients for familial amyloidotic polyneuropathy. Amyloid. 2011;18(suppl 1):171–173. [DOI] [PubMed] [Google Scholar]
Associated Data
This section collects any data citations, data availability statements, or supplementary materials included in this article.
Supplementary Materials
Table S1. Comparison of Hereditary and Wild Type (Senile) Transthyretin Cardiac Amyloidosis