

Abstract
Background
The electrocardiogram (ECG) is an objective tool for cardiovascular disease (CVD) risk assessment.
Methods and Results
We evaluated distribution of ECG abnormalities and risk factors for developing new abnormalities in 1314 patients with type 1 diabetes (T1D) from the Epidemiology of Diabetes Interventions and Complications (EDIC) study. Annual ECGs were centrally read. ECG abnormalities were classified as major and minor according to the Minnesota ECG Classification. At EDIC year 1 (baseline), 356 (27.1%) of the participants had at least 1 ECG abnormality (major or minor) whereas 26 (2%) had at least one major abnormality. During 16 years of follow‐up, 1016 (77.3%) participants developed at least 1 new ECG abnormality (major or minor), whereas 172 (13.1%) developed at least 1 new major abnormality. Independent risk factors for developing new major ECG abnormalities were: age, current smoking, increased systolic blood pressure, and higher glycosylated hemoglobin (hazard ratio [HR] [95% CI]: 1.04 [1.02–1.06] per 1‐year increase, 1.75 [1.22–2.53], 1.03 [1.01–1.05] per 1 mm Hg increase, and 1.16 [1.04–1.29] per 10% increase, respectively). Independent risk factors for developing any new ECG abnormalities (major or minor) were age and systolic blood pressure (HR [95% CI]: 1.02 [1.01–1.03] per 1‐year increase and 1.01 [1.00–1.02] per 1 mm Hg increase, respectively).
Conclusions
New ECG abnormalities commonly occur in the course of T1D, consistent with the recognized increasing risk for CVD as patients age. Advanced age, increased systolic blood pressure, smoking, and higher HbA1c are independent risk factor for developing major ECG abnormalities, which underscores the importance of tight glucose control in T1D in addition to management of common CVD risk factors.
Keywords: electrocardiogram, The Epidemiology of Diabetes Interventions and Complications Study, type 1 diabetes
Subject Categories: Electrocardiology (ECG), Epidemiology
Introduction
The resting 12‐lead electrocardiogram (ECG) is the most accessible test for screening and detection of cardiovascular disease (CVD).1 In addition to its role in assessment of prevalent CVD, ECG abnormalities have also been used to predict poor outcomes in different populations.2, 3, 4, 5, 6, 7, 8, 9, 10, 11, 12, 13
Patients with type 1 diabetes (T1D) are at a higher risk of CVD compared with age‐matched individuals without diabetes.14, 15, 16 Understanding the determinants and risk factors for developing new ECG abnormalities in T1D could facilitate better understanding of CVD in this high‐risk population and identify those who may benefit from closer follow‐up and aggressive risk factor management. Currently, there are no reports on the progression of ECG abnormalities in patients with T1D.
Our objectives for this study were 3‐fold. First, we sought to examine the distribution of ECG abnormalities in patients with T1D at the time of enrollment in the Epidemiology of Diabetes Interventions and Complications (EDIC) study. Second, we studied the progression of these abnormalities during 16 years of follow‐up. Third, we sought to identify participants’ characteristics and CVD risk factors that are associated with the occurrence of new major or any (major or minor) new ECG abnormalities during EDIC.
Methods
The EDIC study started in 1994 (year 1 of the study, baseline herein) as an observational follow‐up of the Diabetes Control and Complications Trial (DCCT). The DCCT, previously described in detail,17 was a controlled clinical trial comparing the effects of intensive versus conventional diabetes therapy on long‐term diabetes complications, including retinopathy, nephropathy, and neuropathy. During 1983–1989, 1441 individuals ages 13 to 39 years old were enrolled; 726 participants into the primary prevention cohort (diabetes duration 1–5 years, no retinopathy, and urinary albumin excretion rate [AER] <40 mg/day) and 715 into the secondary intervention cohort (1–15 years in duration, very mild‐to‐moderate nonproliferative retinopathy, and AER ≤200 mg/day). Intensive therapy (n=711) aimed to achieve levels of glycemia as close to the nondiabetic range as safely possible, whereas conventional therapy (n=730) aimed to maintain clinical well‐being with no specific glucose targets. At the end of the DCCT (1993), participants in the conventional treatment group were instructed in intensive diabetes therapy. In 1994, all surviving DCCT participants were invited to join the EDIC observational study. The study was approved by each study site's institutional review board. All participants provided written informed consent. For the purpose of this analysis, we included the 1314 EDIC participants (93% of the surviving the DCCT cohort) with ECGs at EDIC year 1 (1994) visit and at least 1 ECG during follow‐up. Figure 1 shows the disposition of EDIC participants in this analysis.
Figure 1.
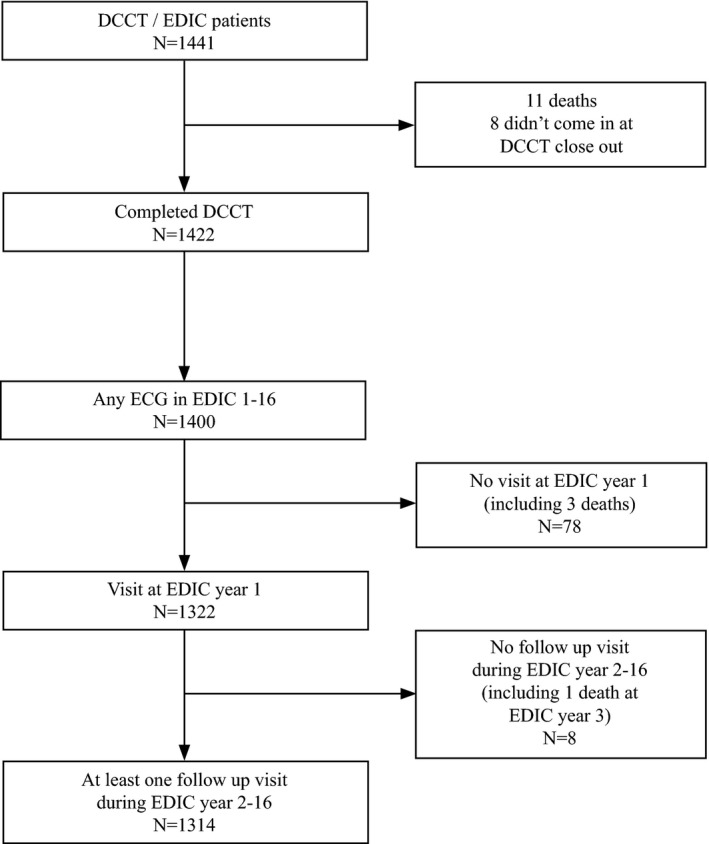
Flow chart of inclusion and exclusion criteria. DCCT indicates Diabetes Control and Complications Trial; EDIC, Epidemiology of Diabetes Interventions and Complications (EDIC) Study.
Electrocardiography
EDIC participants had annual 12‐lead resting ECG recording. ECG tracings were centrally read at an ECG core facility; initially (years 1–11) at the University of Minnesota ECG Reading Center (Minneapolis, MN), then at the Epidemiological Cardiology Research (EPICARE) Center of Wake Forest School of Medicine (Winston‐Salem, NC) (years 12–16). The change in the ECG reading center after EDIC year 11 did not affect the risk of a new abnormality (P value of interaction between reading center and DCCT treatment group for any abnormalities and major abnormalities were 0.98 and 0.65, respectively).
ECG abnormalities from all visits were classified as major and minor ECG abnormalities using the standard Minnesota ECG Classification.18 Major ECG abnormalities included major ventricular conduction defects (complete left or right bundle branch block, major ventricular conduction delay with QRS ≥120 ms), definite myocardial infarction (defined as the presence of major Q‐wave abnormalities), possible myocardial infarction (defined as the presence of minor Q/QS‐wave plus major ST/T abnormalities), isolated major ST/T‐wave abnormalities, left ventricular hypertrophy with strain pattern, advanced atrioventricular (AV) conduction abnormalities (complete or second‐degree AV block), pacemaker, atrial fibrillation/flutter, and others. Minor ECG abnormalities included minor isolated Q/QS‐wave abnormalities, minor isolated ST/T abnormalities, high R waves/increased QRS voltage denoting left or right ventricular hypertrophy without strain pattern, nonischemic ST segment elevation, incomplete (left or right) bundle branch block, short PR interval, left‐axis deviation, right‐axis deviation, atrial and ventricular premature beats, and others.
This analysis focuses on major ECG abnormalities (defined as presence of at least 1 major ECG abnormality) and on any ECG abnormalities (at least 1 major or minor ECG abnormality) during EDIC follow‐up.
Covariates
Demographic variables (age and sex) were self‐reported. Hypertension was defined as systolic blood pressure ≥140 mm Hg, diastolic blood pressure ≥90 mm Hg, or use of antihypertensive medications. Fasting lipid profile was assessed biannually. Hyperlipidemia was defined as low‐density lipoprotein (LDL)‐cholesterol level ≥130 mg/dL or use of lipid‐lowering agents. Weighted mean values of body mass index, blood pressure, lipids, and glycosylated hemoglobin (HbA1c) over the combined DCCT and EDIC study duration were computed with weights proportional to the time interval between values owing to the differences in the intervals between visits during DCCT and EDIC. Microalbuminuria was defined as AER ≥30 mg/24 hours (at baseline or ever during DCCT/EDIC).
Statistical Analysis
Participants’ characteristics were compared using Wilcoxon rank‐sum tests for quantitative variables and chi‐square tests for categorical variables.19 The advantage of the Wilcoxon over the t test in this situation is its greater power under distributions other than the normal, and it has a power trivially less than the t test when the distributions are normal. The Kaplan–Meier method estimated the cumulative incidence of the new ECG abnormalities (major abnormality and any abnormality, separately).20
The EDIC baseline evaluation herein refers to the EDIC year 1 visit, 1 year after the close of the DCCT randomized treatment phase. Each risk factor was entered as a baseline variable and as a time‐varying covariate, separately, in models initially adjusted for age and sex. Hazard ratios (HRs) associated with baseline and time‐varying covariates were estimated using separate Cox proportional hazards models21 aimed to examine the association between baseline participants’ characteristics and CVD risk factors with developing new ECG abnormalities (major abnormality and any abnormality, separately) during EDIC follow‐up. In multivariate risk factor models, the most significant risk factor for the multivariate association among similar variables (eg, systolic or diastolic blood pressure) was used in the final multivariable models to avoid collinearity. The proportional hazards assumption was tested by adding time‐dependent interaction terms between the covariates and log (time).20
All analyses were performed using SAS software (version 9.3; SAS Institute Inc., Cary, NC). P<0.05 was considered significant.
Results
Table 1 shows the baseline (EDIC year 1) characteristics of the 1314 patients with T1D included in these analyses who were 35.1±7.0 years old, 47.3% female, and 96.3% white. At baseline, 356 (27.1%) participants had at least 1 ECG abnormality whereas 26 (2%) had at least 1 major ECG abnormality. The most common minor ECG abnormalities at baseline were short PR interval (n=96; 7.3%), and nonischemic ST elevation (n=61; 4.6%). The most common major ECG abnormalities at baseline were ECG evidence of definite or possible myocardial infarction (n=13; 1%) and isolated major ST/T abnormalities (n=10; 0.8%).
Table 1.
Participants Characteristics at Baseline, EDIC Study Year 1
| All Participants | Major Abnormality | Any Abnormality | |||||
|---|---|---|---|---|---|---|---|
| Yes (N=26) | No (N=1288) | P Valuea | Yes (N=356) | No (N=958) | P Valuea | ||
| Age, yr | 35.1±7.0 | 36.1±7.8 | 35.1±7.0 | 0.46 | 34.7±7.1 | 35.2±6.9 | 0.30 |
| Female (%) | 47.5 | 53.9 | 47.4 | 0.51 | 41.6 | 49.7 | 0.009 |
| Race (% white) | 96.3 | 92.3 | 96.4 | 0.66 | 94.7 | 96.9 | 0.13 |
| Intensive treatment group (%) | 49.9 | 42.3 | 50.1 | 0.43 | 50.3 | 49.8 | 0.87 |
| Primary cohort (%) | 49.7 | 38.5 | 49.9 | 0.25 | 51.4 | 49.1 | 0.45 |
| Duration of diabetes, yr | 13.6±4.9 | 13.9±4.7 | 13.5±4.9 | 0.63 | 13.3±5.3 | 13.6±4.8 | 0.07 |
| Current smoking (%) | 19.2 | 23.1 | 19.1 | 0.61 | 16.6 | 20.2 | 0.14 |
| Body mass index, kg/m2 | 26.1±4.0 | 26.4±4.5 | 26.1±4.0 | 0.91 | 25.7±3.7 | 26.3±4.1 | 0.030 |
| Body mass index ≥30 kg/m2 (%) | 13.7 | 15.4 | 13.7 | 0.80 | 11.5 | 14.5 | 0.16 |
| Systolic blood pressure, mm Hg | 117±12 | 123±17 | 117±12 | 0.11 | 118±13 | 117±12 | 0.97 |
| Diastolic blood pressure, mm Hg | 75±9 | 74±8 | 75±9 | 0.51 | 75±9 | 75±9 | 0.18 |
| HbA1c (%) | 8.1±1.4 | 8.2±1.4 | 8.1±1.4 | 0.90 | 8.1±1.4 | 8.1±1.3 | 0.20 |
| Weighted mean HbA1c (%) | 8.1±1.3 | 8.4±1.5 | 8.1±1.3 | 0.41 | 8.1±1.4 | 8.2±1.3 | 0.29 |
| HDL cholesterol, mg/dL | 54±14 | 58±16 | 54±14 | 0.18 | 54±14 | 54±14 | 0.63 |
| Non‐HDL cholesterol, mg/dL | 133±37 | 131±27 | 133±37 | 0.89 | 130±37 | 134±37 | 0.010 |
| LDL cholesterol, mg/dL | 115±31 | 113±22 | 115±31 | 0.91 | 113±32 | 116±31 | 0.021 |
| Total cholesterol, mg/dL | 187±36 | 190±25 | 187±36 | 0.43 | 183±36 | 188±36 | 0.008 |
| Triglyceride, mg/dL | 91±75 | 103±86 | 90±75 | 0.86 | 87±75 | 92±75 | 0.07 |
| Microalbuminuria (%) | 16.0 | 19.2 | 15.9 | 0.65 | 15.2 | 16.3 | 0.62 |
EDIC indicates Epidemiology of Diabetes Interventions and Complications (EDIC) Study; HbA1c, glycosylated hemoglobin; HDL, high‐density lipoprotein; LDL, low‐density lipoprotein.
P value is based on chi‐square test for categorical variables and Wilcoxon rank sum test for continuous variables.
Those with and without baseline major ECG abnormalities did not differ in any initial characteristics. On the other hand, there were more men, and lower body mass index, non‐high‐density lipoprotein (HDL)‐cholesterol, LDL‐cholesterol, and total cholesterol levels among EDIC participants with any abnormal ECGs versus no abnormality at the initial evaluation (Table 1).
During 16 years of follow‐up, 1016 (77.3%) participants developed at least 1 new ECG abnormality (major or minor), whereas 172 (13.1%) participants developed at least 1 new major abnormality. Median time of the occurrence of these abnormalities was EDIC year 8 (95% CI, 7–10 years). Figure 2 shows the cumulative incidence of any new ECG abnormalities during follow‐up. Rates of occurrence of new ECG abnormalities did not differ by sex, study cohort, or previous DCCT treatment assignment. On the other hand, patients age 40 years and older or with higher baseline HbA1c were more likely to develop new major ECG abnormalities (Table 2).
Figure 2.
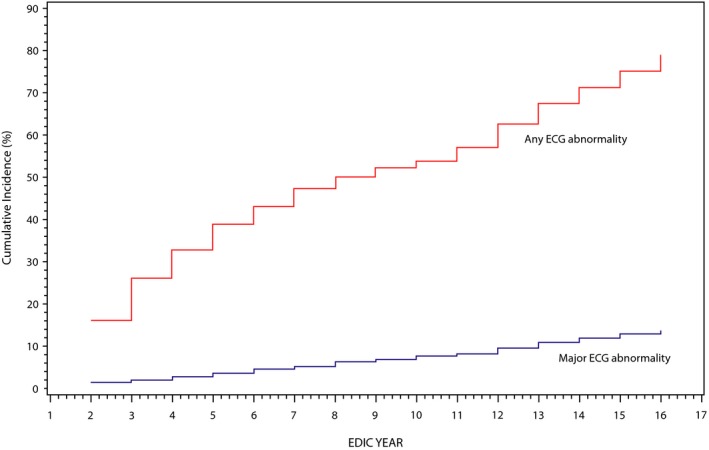
Cumulative incidence of ECG abnormalities during 16 years of EDIC follow‐up. ECG indicates electrocardiogram; EDIC, Epidemiology of Diabetes Interventions and Complications (EDIC) Study.
Table 2.
Distribution of Occurrence of New ECG Abnormalities During EDIC Follow‐up by Baseline Characteristics
| Baseline Characteristics | New Major ECG Abnormality, N (%) | Any New ECG Abnormality, N (%) |
|---|---|---|
| All (n=1314) | 172 (13.1) | 1016 (77.3) |
| Age group, yr | ||
| <40 (n=931) | 103 (11.1) | 701 (75.3) |
| ≥40 (n=383) | 69 (18.0)a | 315 (82.3)a |
| Gender | ||
| Female (n=624) | 78 (12.5) | 481 (77.1) |
| Male (n=690) | 94 (13.6) | 535 (77.5) |
| Study cohortb | ||
| Primary (n=653) | 93 (14.2) | 506 (77.5) |
| Secondary (n=661) | 79 (12.0) | 510 (77.2) |
| DCCT treatment groupc | ||
| Intensive (n=656) | 83 (12.7) | 499 (76.1) |
| Conventional (n=658) | 89 (13.5) | 517 (78.6) |
| HbA1c | ||
| <8.0% (n=670) | 70 (10.5) | 505 (75.4) |
| ≥8.0% (n=644) | 102 (15.8)a | 511 (79.4) |
DCCT indicates Diabetes Control and Complications Trial; EDIC, Epidemiology of Diabetes Interventions and Complications study; HbA1c, glycosylated hemoglobin.
Significant differences; P<0.05.
Primary prevention cohort includes DCCT participants with diabetes duration 1 to 5 years, no retinopathy, and urinary albumin excretion rate <40 mg/day. Secondary intervention cohort includes DCCT participants 1 to 15 years duration, very mild‐to‐moderate nonproliferative retinopathy, and albumin excretion rate <200 mg/day.
Intensive therapy aimed to achieve levels of glycemia as close to the nondiabetic range as safely possible, whereas conventional therapy aimed to maintain clinical well‐being with no specific glucose targets.
The most common new minor ECG abnormalities that occurred during follow‐up were incomplete bundle branch block (139; 10.6%) and minor isolated ST/T abnormalities (n=131; 10.0%), whereas the most common new major ECG abnormalities were isolated major ST/T abnormalities (n=69; 40.1%) and ECG evidence of definite or possible myocardial infarction (n=62; 4.7%).
In demographic adjusted Cox proportional hazard models, age (at baseline), current smoking (at baseline and as a time‐varying covariate), higher systolic and diastolic blood pressure (as a time‐varying covariates), higher LDL‐cholesterol (at baseline and as a time‐varying covariate), higher non‐HDL‐cholesterol (at baseline and as a time‐varying covariate), higher triglycerides (at baseline and as a time‐varying covariate), microalbuminuria (as a time‐varying covariate), and higher HbA1c (baseline and time‐varying covariate) were significantly associated with development of new major ECG abnormalities during follow‐up. On the other hand, only age (at baseline), systolic blood pressure (as a time‐varying covariate), and microalbuminuria (as a time‐varying covariate) were associated with development of any new ECG abnormalities (Table 3).
Table 3.
Demographic Adjusted Associations Between Participants Characteristics and Risk Factors at EDIC Baseline and as Time‐Dependent Covariates Over Time With the Occurrence of New ECG Abnormalities
| Variablea | New ECG Major Abnormality | Any New ECG Abnormality | ||
|---|---|---|---|---|
| HR (95% CI) | P Value | HR (95% CI) | P Value | |
| Baseline age, yrb | 1.05 (1.02–1.07) | <0.001 | 1.02 (1.01–1.03) | <0.001 |
| Sex (male vs female)b | 1.06 (0.78–1.43) | 0.72 | 1.09 (0.96–1.24) | 0.19 |
| Study cohort (secondary vs primary) | 0.79 (0.58–1.06) | 0.12 | 0.97 (0.85–1.10) | 0.63 |
| DCCT treatment group (conventional vs intensive) | 1.12 (0.83–1.52) | 0.45 | 1.09 (0.96–1.25) | 0.18 |
| Diabetes duration at baseline, yr | 0.97 (0.94–1.01) | 0.10 | 1.00 (0.98–1.01) | 0.66 |
| Smoking (current) | ||||
| Baseline | 1.55 (1.10–2.19) | 0.012 | 0.98 (0.83–1.15) | 0.77 |
| Current (yes vs no)c | 1.85 (1.29–2.66) | 0.001 | 1.12 (0.94–1.34) | 0.21 |
| Body mass index, kg/m2 d | ||||
| Baseline | 1.00 (0.97–1.04) | 0.93 | 1.00 (0.98–1.01) | 0.64 |
| Weighted meanc | 1.02 (0.97–1.06) | 0.49 | 1.00 (0.98–1.02) | 0.90 |
| Systolic blood pressure, mm Hg | ||||
| Baseline | 1.00 (0.99–1.02) | 0.48 | 1.00 (0.99–1.01) | 0.17 |
| Weighted meanc | 1.03 (1.01–1.05) | 0.002 | 1.01 (1.00–1.02) | 0.041 |
| Diastolic blood pressure, mm Hg | ||||
| Baseline | 1.01 (1.00–1.03) | 0.15 | 1.00 (0.99–1.01) | 0.63 |
| Weighted meanc | 1.05 (1.02–1.08) | 0.003 | 1.01 (0.99–1.02) | 0.37 |
| HDL cholesterol, mg/dLe | ||||
| Baseline | 0.99 (0.88–1.11) | 0.87 | 0.98 (0.93–1.03) | 0.49 |
| Weighted meanc | 0.95 (0.82–1.09) | 0.44 | 0.99 (0.94–1.06) | 0.82 |
| Non‐HDL cholesterol, mg/dLe | ||||
| Baseline | 1.06 (1.02–1.10) | 0.004 | 1.01 (0.99–1.03) | 0.27 |
| Weighted meanc | 1.07 (1.01–1.13) | 0.015 | 1.01 (0.99–1.04) | 0.36 |
| LDL cholesterol, mg/dLe | ||||
| Baseline | 1.06 (1.01–1.11) | 0.030 | 1.01 (0.99–1.03) | 0.46 |
| Weighted meanc | 1.07 (1.00–1.14) | 0.044 | 1.01 (0.98–1.04) | 0.56 |
| Triglyceride, mg/dLe | ||||
| Baseline | 1.02 (1.00–1.03) | 0.011 | 1.01 (0.99–1.01) | 0.25 |
| Weighted meanc | 1.04 (1.01–1.07) | 0.015 | 1.01 (0.99–1.03) | 0.15 |
| Microalbuminuria | ||||
| Baseline | 1.36 (0.93–2.00) | 0.11 | 1.20 (1.01–1.44) | 0.041 |
| Ever (Yes vs No)c | 1.50 (1.11, 2.04) | 0.009 | 1.09 (0.96, 1.25) | 0.19 |
| HbA1c (%) (per 10% increase) | ||||
| Baselinef | 1.12 (1.03–1.23) | 0.001 | 1.00 (0.96–1.04) | 0.97 |
| Weighted meanc, g | 1.20 (1.08–1.33) | 0.001 | 1.03 (0.98–1.08) | 0.22 |
ECG indicates electrocardiogram; EDIC, Epidemiology of Diabetes Interventions and Complications (EDIC) Study; HbA1c, glycosylated hemoglobin; HR, hazard ratio; HDL, high‐density lipoprotein; LDL, low‐density lipoprotein.
Each model was adjusted for age and sex.
One model included age and sex only.
Time‐dependent covariate.
Body mass index was the only covariate with a nominally significant departure from the proportional hazard assumption.
All models including lipids were fit using 10 mg/dL because of the very small coefficient.
The log HbA1c value was used so that the HR per c‐fold change in risk are c1.23056 and c−0.00791 where 1.23056 and −0.00791 are the estimated regression coefficient for major and any abnormality, respectively; c value of 1.1 corresponds to a 10% increase in the HbA1c value.
The log HbA1c value was used so that the HR per c‐fold change in risk are c1.90967 and c0.30155 where 1.90967 and 0.30155 are the estimated regression coefficient for major and any abnormality, respectively; c value of 1.1 corresponds to a 10% increase in the HbA1c value.
In a multivariable model, age (at baseline) as well as current smoking, higher systolic blood pressure and higher levels of HbA1c (all as time‐varying covariates) were significantly associated with increased risk of developing new major ECG abnormalities. On the other hand, only age (at baseline) and higher systolic blood pressure (as a time‐varying covariate) were associated with increased risk for developing any new ECG abnormalities (Table 4). Using a model free estimate, the log HR for developing new major ECG abnormalities was a strong linear function of age, weighted mean systolic blood pressure, and log mean HbA1c, whereas weaker associations were observed for developing any ECG abnormalities (Figures 3, 4 through 5).
Table 4.
Multivariable Adjusted Associations of Selected Risk Factors With Occurrence of New ECG Abnormalities
| Variablea | New Major ECG Abnormality | Any New ECG Abnormality | ||
|---|---|---|---|---|
| HR (95% CI) | P Value | HR (95% CI) | P Value | |
| Age, yr (EDIC year 1) | 1.04 (1.02–1.06) | 0.001 | 1.02 (1.01–1.03) | <0.001 |
| Sex (male vs female) | 0.92 (0.67–1.26) | 0.60 | 1.04 (0.90–1.19) | 0.61 |
| Current smokingb (yes vs no) | 1.75 (1.22–2.53) | 0.002 | 1.12 (0.93–1.33) | 0.23 |
| Weighted mean systolic blood pressureb, mm Hg | 1.03 (1.01–1.05) | 0.003 | 1.01 (1.00–1.02) | 0.045 |
| Weighted mean HbA1cb, c (per 10% increase) | 1.16 (1.04–1.29) | 0.008 | 1.02 (0.98–1.07) | 0.33 |
ECG indicates electrocardiogram; EDIC, Epidemiology of Diabetes Interventions and Complications (EDIC) Study; HbA1c, glycosylated hemoglobin; HR, hazard ratio; HDL, high‐density lipoprotein.
In addition to age and sex, the most significant variables from each category in Table 3 (smoking, blood pressure, lipid, microalbuminuria, and HbA1c) were selected to be included in building separate multivariate models. In the new major ECG abnormality model, the lipid variable (ie, non‐HDL at EDIC year 1 or weighted mean preceding event/censoring) and microalbuminuria (ever) were no longer significant and were deleted after adjusting for smoking and weighted mean systolic blood pressure. In the any new ECG abnormality model, no other risk factors were nominally significant. The proportional hazard assumption was met for all variables in the models.
Included in the models as time dependent covariate.
The log HbA1c value was used so that the hazard ratio per c‐fold change in risk are c1.51197 and c0.23687 where 1.51197 and 0.23687 are the estimated regression coefficient for major and any abnormality, respectively; a value of c that equals 1.1 corresponds to a 10% increase in the HbA1c value.
Figure 3.
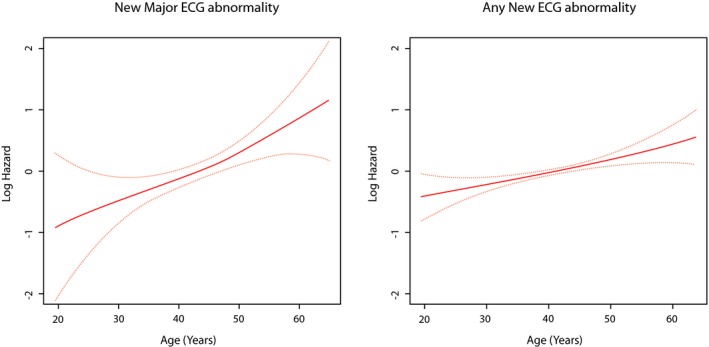
Risk of new ECG abnormalities across different levels of age. The red line represents the log hazard (Y axis) of ECG abnormalities associated with different levels of age at baseline. The yellow line represents the 95% CI of the log hazard (Y axis) of ECG abnormalities associated with different levels of age at baseline. ECG indicates electrocardiogram.
Figure 4.
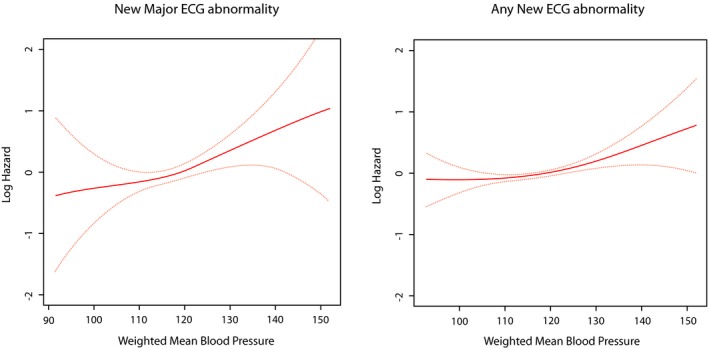
Risk of new ECG abnormalities across different levels of weighted mean systolic blood pressure. The red line represents the log hazard (Y axis) of ECG abnormalities associated with different levels of weighted mean systolic blood pressure (Y axis). The yellow line represents the 95% CI of the log hazard (Y axis) of ECG abnormalities associated with different levels of weighted mean systolic blood pressure (Y axis). ECG indicates electrocardiogram.
Figure 5.
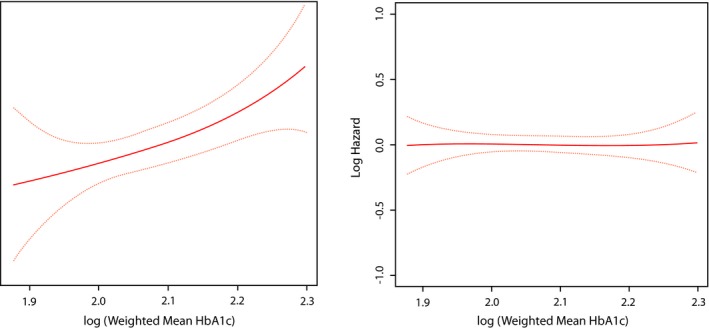
Risk of new ECG abnormalites across diffetent lelvels of weighted mean HbA1c. The red line represents the log hazard (Y axis) of ECG abnormalities associated with different levels of log weighted mean HbA1c (Y axis). The yellow line represents the 95% CI of the log hazard (Y axis) of ECG abnormalities associated with different levels of log weighted mean HbA1c (Y axis). ECG indicates electrocardiogram; HbA1c, glycosylated hemoglobin.
Discussion
In this analysis from the EDIC study, we examined prevalence and progression of ECG abnormalities in patients with T1D during 16 years of follow‐up and looked for factors associated with developing new abnormalities. There are 2 key findings from our study. First, developing new ECG abnormalities is common in the course of T1D; by 16 years of follow‐up, 77.3% of the EDIC participants developed at least 1 new ECG abnormality (major or minor), with 13.1% developing at least 1 new major ECG abnormality. Second, independent risk factors for developing new major ECG abnormalities are advancing age, increased systolic blood pressure, smoking, and higher HbA1c. On the hand, independent risk factors for any new ECG abnormalities are age and higher systolic blood pressure.
Our findings could influence care of patients with T1D in a number of ways. The increased incidence of ECG abnormalities during the course of T1D suggests a potential use for ECG to monitor progression of CVD in T1D. Also, identifying factors associated with developing these abnormalities could provide targets for prevention of CVD.
Several reports from different populations have shown that ECG abnormalities reflect increased risk of CVD.2, 3, 4, 5, 6, 7, 8, 9, 10, 11, 12, 13 Thus, our finding of higher occurrence of new ECG abnormalities in patients with T1D highlights the increased risk of CVD in this population as they age. Notably, the reported prevalence of ECG abnormalities in the general population using the same ECG classification system range from 16% to 32%,22, 23, 24, 25, 26 which is lower than rates observed in our study population of T1D. This is in accord with previous reports showing that T1D is associated with higher risk of CVD compared with age matched nondiabetic populations.14, 15, 16
In the present report, in addition to common cardiovascular risk factors (advancing age, smoking, and higher systolic blood pressure), higher HbA1c level was associated with an increased risk of developing new major ECG abnormalities. This finding underscores the importance of tight glucose control in T1D. This is consistent with our past demonstration of the salutary effects of intensive diabetes therapy compared with conventional therapy on the risk of CVD in patients with T1D.27 We have also previously demonstrated that intensive diabetes therapy reduces the progression of atherosclerosis, as measured by carotid intima‐media thickness28 and coronary artery calcification,29 which could have an impact on development of ECG abnormalities.
The association between glycemia and CVD is well established. Hyperglycemia, even below the ranges that define diabetes, has been associated with increased risk of CVD.30 Furthermore, hyperglycemia has been shown to be a risk factor for microvascular complications, some of which (eg, diabetic nephropathy) are risk factors for CVD.31, 32, 33 These reports linking hyperglycemia to CVD provide some explanation to our finding of the link between hyperglycemia and developing new abnormalities in the ECG, the objective tool to assess cardiovascular health. It is unknown, however, whether interventions aimed at reducing glycemia will reverse ECG abnormalities.
Our finding that increased systolic blood pressure and smoking are independent risk factors for developing new major ECG abnormalities is in line with the known risk of CVD associated with these factors. Whether normalization of ECG abnormalities could be used as a tool to monitor successful management of these risk factors require further investigation.
Advancing age and higher systolic blood pressure were the only independent risk factors shared by both major and any ECG abnormalities. However, despite not reaching statistical significance, the direction of associations of the other risk factors for developing new major abnormalities (higher HbA1c and smoking) was similar to that noted for developing any new ECG abnormalities. Attenuation of the effect of risk factors in case of any new abnormality is likely because of the minor abnormalities (the majority of any new ECG abnormality) being a milder form of CVD.
Our results have limitations. The majority of EDIC participants are Caucasian, which may limit the generalizability of our results to other races/ethnicities. However, the ethnic makeup of the DCCT/EDIC cohort is not substantially dissimilar from the general T1D population that is largely Caucasians. We used global classification of ECG abnormalities (major and any) rather than using individual ECG abnormalities. Arguably, different individual ECG abnormalities might have different risk factors. However, our approach of using global classification ECG abnormalities is common, and several previous reports have shown its usefulness for both assessment and prediction of CVD.2, 3, 4, 5, 6, 7, 8, 9, 10, 11, 12, 13 The main reason for us and for previous reports for using global classification of ECG abnormalities is the lack of enough power to use ECG abnormalities individually in such type of analyses.
Despite these limitations, this is the first report on the progression of ECG abnormalities in T1D. The uniform collection of data, including centrally read ECG data, and the long term follow‐up with extensive phenotyping are just a few of the many strengths of the EDIC study.
In conclusion, occurrence of new ECG abnormalities is common in the course of T1D consistent with the increasing risk for CVD with age. Independent risk factors for developing new major ECG abnormalities are older age, increased systolic blood pressure, smoking, and higher HbA1c. On the other hand, independent risk factors for any new ECG abnormalities are age and higher systolic blood pressure. Further examination is needed to determine whether interventions aimed at reducing glycemia will reverse ECG abnormalities.
Sources of Funding
The DCCT/EDIC has been supported by U01 Cooperative Agreement grants (1982–1993, 2011–2016), and contracts (1982–2011) with the Division of Diabetes Endocrinology and Metabolic Diseases of the National Institute of Diabetes and Digestive and Kidney Disease (current grant numbers U01 DK094176 and U01 DK094157), and through support by the National Eye Institute, the National Institute of Neurologic Disorders and Stroke, the Genetic Clinical Research Centers Program (1993–2007), and Clinical Translational Science Center Program (2006‐present), Bethesda, Maryland.
Disclosures
None.
Supporting information
Appendix S1. The DCCT/EDIC Study Research Group.
Acknowledgment
Industry contributors have had no role in the DCCT/EDIC study, but have provided free or discounted supplies or equipment to support participants’ adherence to the study: Abbott Diabetes Care (Alameda, CA); Animas (Westchester, PA); Bayer Diabetes Care (North America Headquarters, Tarrytown, NY); Becton Dickinson (Franklin Lakes, NJ); Eli Lilly (Indianapolis, IN); Extend Nutrition (St. Louis, MO); Insulet Corporation (Bedford, MA); Lifescan (Milpitas, CA); Medtronic Diabetes (Minneapolis, MN); Nipro Home Diagnostics (Ft. Lauderdale, FL); Nova Diabetes Care (Billerica, MA); Omron (Shelton, CT); Perrigo Diabetes Care (Allegan, MI); Roche Diabetes Care (Indianapolis, IN); and Sanofi‐Aventis (Bridgewater, NJ). The authors acknowledge the data processing and technical assistance of Wanyu Hsu at the Biostatistics Center, the George Washington University, and Charles C. Campbell at the EPICARE ECG Center, Wake Forest School of Medicine (Winston‐Salem, NC).
(J Am Heart Assoc. 2016;5:e002882 doi: 10.1161/JAHA.115.002882)
References
- 1. Chou R, Arora B, Tracy D, Fu R, Walker M, Humphrey L. Screening asymptomatic adults with resting or exercise electrocardiography: a review of the evidence for the U.S. Preventive Services Task Force. Ann Intern Med. 2011;155:375–385. [DOI] [PubMed] [Google Scholar]
- 2. Denes P, Larson JC, Lloyd‐Jones DM, Prineas RJ, Greenland P. Major and minor ECG abnormalities in asymptomatic women and risk of cardiovascular events and mortality. JAMA. 2007;297:978–985. [DOI] [PubMed] [Google Scholar]
- 3. Auer R, Bauer DC, Marques‐Vidal P, Butler J, Min LJ, Cornuz J, Satterfield S, Newman AB, Vittinghoff E, Rodondi N; Health ABC Study . Association of major and minor ECG abnormalities with coronary heart disease events. JAMA. 2012;307:1497–1505. [DOI] [PMC free article] [PubMed] [Google Scholar]
- 4. Denes P, Lloyd‐Jones D, Garside DB, Gouskova N, Soliman EZ, Ostfeld R, Zhang ZM, Camacho A, Prineas R, Raij L, Daviglus ML. Major and minor electrocardiogram abnormalities and their association with underlying cardiovascular disease and risk factors in Hispanics/Latinos (From the Hispanic Community Health Study/Study of Latinos [HCHS/SOL]). Am J Cardiol. 2013;112:1667–1675. [DOI] [PMC free article] [PubMed] [Google Scholar]
- 5. Soliman EZ, Prineas RJ, Boccara F, Duprez D, Roediger M, Stein J, Lundgren J, Boesecke C, Stephan C, Hodder S, Neaton J. Prevalence and prognostic significance of ECG abnormalities in HIV‐infected patients: results from the Strategies for Management of Antiretroviral Therapy (SMART) trial. J Electrocardiol. 2011;44:779–785. [DOI] [PMC free article] [PubMed] [Google Scholar]
- 6. Prineas RJ, Le A, Soliman EZ, Zhang ZM, Howard VJ, Ostchega Y, Howard G. US national prevalence of electrocardiographic abnormalities in black and white middle aged (45‐64 years) and older ≥ 65 years) adults (from the Reasons for Geographic and Racial Differences in Stroke Study). Am J Cardiol. 2012;109:1223–1228. [DOI] [PMC free article] [PubMed] [Google Scholar]
- 7. Sellers MB, Divers J, Lu L, Xu J, Smith SC, Bowden DW, Herrington DH, Freedman BI, Soliman EZ. Prevalence and determinants of electrocardiographic abnormalities in African Americans with type 2 diabetes. J Epidemiol Glob Health. 2014;4:289–296. [DOI] [PMC free article] [PubMed] [Google Scholar]
- 8. Moyer VA. Screening for coronary heart disease with electrocardiography: U.S. Preventive Services Task Force recommendation statement. Ann Intern Med. 2012;157:512–518. [DOI] [PubMed] [Google Scholar]
- 9. Bakhoya VN, Kurl S, Laukkanen JA. T‐wave inversion on electrocardiogram is related to the risk of acute coronary syndrome in the general population. Eur J Prev Cardiol. 2014;21:500–506. [DOI] [PubMed] [Google Scholar]
- 10. Inohara T, Kohsaka S, Okamura T, Watanabe M, Nakamura Y, Higashiyama A, Kadota A, Okuda N, Murakami Y, Ohkubo T, Miura K, Okayama A, Ueshima H; for the NIPPON DATA 80/90 Research Group . Cumulative impact of axial, structural, and repolarization ECG findings on long‐term cardiovascular mortality among healthy individuals in Japan: National Integrated Project for Prospective Observation of Non‐Communicable Disease and its Trends in the Aged, 1980 and 1990. Eur J Prev Cardiol. 2014;21:1501–1508. [DOI] [PubMed] [Google Scholar]
- 11. Schröder K, Wegscheider K, Wenger NK, Vettorazzi E, Schröder R. Resting electrocardiogram predicts mortality in postmenopausal women with coronary heart disease or with risk factors for coronary heart disease. Eur J Prev Cardiol. 2012;21:749–757. [DOI] [PubMed] [Google Scholar]
- 12. Zhang ZM, Prineas RJ, Soliman EZ, Baggett C, Heiss G; ARIC Research Group . Prognostic significance of serial Q/ST‐T changes by the Minnesota Code and Novacode in the Atherosclerosis Risk in Communities (ARIC) study. Eur J Prev Cardiol. 2012;19:1430–1436. [DOI] [PMC free article] [PubMed] [Google Scholar]
- 13. Greenland P, Alpert JS, Beller GA, Benjamin EJ, Budoff MJ, Fayad ZA, Foster E, Hlatky MA, Hodgson JM, Kushner FG, Lauer MS, Shaw LJ, Smith SC Jr, Taylor AJ, Weintraub WS, Wenger NK, Jacobs AK, Smith SC Jr, Anderson JL, Albert N, Buller CE, Creager MA, Ettinger SM, Guyton RA, Halperin JL, Hochman JS, Kushner FG, Nishimura R, Ohman EM, Page RL, Stevenson WG, Tarkington LG, Yancy CW; American College of Cardiology Foundation; American Heart Association . 2010 ACCF/AHA guideline for assessment of cardiovascular risk in asymptomatic adults: a report of the American College of Cardiology Foundation/American Heart Association Task Force on Practice Guidelines. J Am Coll Cardiol. 2010;56:e50–e103. [DOI] [PubMed] [Google Scholar]
- 14. Krolewski AS, Kosinski EJ, Warram JH, Leland OS, Busick EJ, Asmal AC, Rand LI, Christlieb AR, Bradley RF, Kahn CR. Magnitude and determinants of coronary artery disease in juvenile‐onset, insulin‐dependent diabetes mellitus. Am J Cardiol. 1987;59:750–755. [DOI] [PubMed] [Google Scholar]
- 15. Laing SP, Swerdlow AJ, Slater SD, Burden AC, Morris A, Waugh NR, Gatling W, Bingley PJ, Patterson CC. Mortality from heart disease in a cohort of 23,000 patients with insulin‐treated diabetes. Diabetologia. 2003;46:760–765. [DOI] [PubMed] [Google Scholar]
- 16. Dorman JS, LaPorte RE, Kuller LH, Cruickshanks KJ, Orchard TJ, Wagener DK, Becker DJ, Cavender DE, Drash AL. The Pittsburgh insulin‐dependent diabetes mellitus (IDDM) morbidity and mortality study: mortality results. Diabetes. 1984;33:271–276. [DOI] [PubMed] [Google Scholar]
- 17. The Diabetes Control and Complications Trial Research Group . The effect of intensive treatment of diabetes on the development and progression of long‐term complications in insulin dependent diabetes mellitus. N Engl J Med. 1993;329:977–986. [DOI] [PubMed] [Google Scholar]
- 18. Prineas RJ, Blackburn H. The Minnesota Code Manual of Electrocardiographic Findings: Standards and Procedures for Measurement and Classification. Boston, MA: John Wright—PSG, Inc; 1982. [Google Scholar]
- 19. Snedecor GW, Cochran WG. Statistical Methods. 7th ed Ames: Iowa State University Press; 1980. [Google Scholar]
- 20. Lachin JM. Biostatistical Methods: The Assessment of Relative Risks. 2nd ed New York: John Wiley & Sons; 2011. [Google Scholar]
- 21. Kalbfleisch JD, Prentice RL. The Statistical Analysis of Failure Time Data. 2nd ed New York: John Wiley & Sons; 2002. [Google Scholar]
- 22. Sutherland SE, Gazes PC, Keil JE, Gilbert GE, Knapp RG. Electrocardiographic abnormalities and 30‐year mortality among white and black men of the Charleston Heart Study. Circulation. 1993;88:2685. [DOI] [PubMed] [Google Scholar]
- 23. De‐Bacquer D, De‐Backer G, Kornitzer M. Prevalence of ECG findings in large population based samples of men and women. Heart. 2000;84:625. [DOI] [PMC free article] [PubMed] [Google Scholar]
- 24. Strogatz DS, Tyroler HA, Watkins LO, Hames CG. Electrocardiographic abnormalities and mortality among middle‐aged black men and white men of Evans County, Georgia. J Chronic Dis. 1987;40:149. [DOI] [PubMed] [Google Scholar]
- 25. De‐Bacquer D, Pereira M, De‐Backer G, De‐Henauw S, Kornitzer M. Prevalence and correlate of ECG abnormalites in the adult Belgian population. J Electrocardiol. 1995;28:1. [DOI] [PubMed] [Google Scholar]
- 26. Vitelli LL, Crow RS, Shahar E, Hutchinson RG, Rautaharju PM, Folsom AR. Electrocardiographic findings in a healthy biracial population. Atherosclerosis Risk in Communities (ARIC) Study Investigators. Am J Cardiol. 1998;81:453. [DOI] [PubMed] [Google Scholar]
- 27. Nathan DM, Cleary PA, Backlund JY, Genuth SM, Lachin JM, Orchard TJ, Raskin P, Zinman B; Diabetes Control and Complications Trial/Epidemiology of Diabetes Interventions and Complications (DCCT/EDIC) Study Research Group . Intensive diabetes treatment and cardiovascular disease in patients with type 1 diabetes. N Engl J Med. 2005;353:2643–2653. [DOI] [PMC free article] [PubMed] [Google Scholar]
- 28. Diabetes Control and Complications Trial/Epidemiology of Diabetes Interventions, Complications Research Group . Intensive diabetes therapy and carotid intima‐media thickness in type 1 diabetes mellitus. N Engl J Med. 2003;348:2294–2903. [DOI] [PMC free article] [PubMed] [Google Scholar]
- 29. Cleary PA, Orchard TA, Genuth S, Wong ND, Detrano R, Backlund JC, Zinman B, Jacobson A, Sun W, Lachin JM, Nathan DM; for the DCCT/EDIC Research Group . The effect of intensive glycemic treatment on coronary artery calcification in type 1 diabetic participants of the Diabetes Control and Complications Trial/Epidemiology of Diabetes Interventions and Complications (DCCT/EDIC) study. Diabetes. 2006;55:3556–3565. [DOI] [PMC free article] [PubMed] [Google Scholar]
- 30. Khaw KT, Wareham N, Bingham S, Luben R, Welch A, Day N. Association of hemoglobin A1c with cardiovascular disease and mortality in adults: the European Prospective Investigation into Cancer in Norfolk. Ann Intern Med. 2004;141:413–420. [DOI] [PubMed] [Google Scholar]
- 31. Vlassara H, Palace MR. Diabetes and advanced glycation endproducts. J Intern Med. 2002;251:87–101. [DOI] [PubMed] [Google Scholar]
- 32. Monnier VM, Bautista O, Kenny D, Sell DR, Fogarty J, Dahms W, Cleary PA, Lachin J, Genuth S. Skin collagen glycation, glycoxidation, and crosslinking are lower in subjects with long‐term intensive versus conventional therapy of type 1 diabetes: relevance of glycated collagen products versus HbA1c as markers of diabetic complications. Diabetes. 1999;48:870–880. [DOI] [PMC free article] [PubMed] [Google Scholar]
- 33. Basta G, Schmidt AM, De Caterina R. Advanced glycation end products and vascular inflammation: implications for accelerated atherosclerosis in diabetes. Cardiovasc Res. 2004;63:582–592. [DOI] [PubMed] [Google Scholar]
Associated Data
This section collects any data citations, data availability statements, or supplementary materials included in this article.
Supplementary Materials
Appendix S1. The DCCT/EDIC Study Research Group.