

Abstract
Background
Cardiac computed tomography angiography (CCTA) reduces emergency department length of stay compared with standard evaluation in patients with low‐ and intermediate‐risk acute chest pain. Whether diabetic patients have similar benefits is unknown.
Methods and Results
In this prespecified analysis of the Rule Out Myocardial Ischemia/Infarction by Computer Assisted Tomography (ROMICAT II) multicenter trial, we randomized 1000 patients (17% diabetic) with symptoms suggestive of acute coronary syndrome to CCTA or standard evaluation. The rate of acute coronary syndrome was 8% in both diabetic and nondiabetic patients (P=1.0). Length of stay was unaffected by the CCTA strategy for diabetic patients (23.9 versus 27.2 hours, P=0.86) but was reduced for nondiabetic patients compared with standard evaluation (8.4 versus 26.5 hours, P<0.0001; P interaction=0.004). CCTA resulted in 3‐fold more direct emergency department discharge in both groups (each P≤0.0001, P interaction=0.27). No difference in hospital admissions was seen between the 2 strategies in diabetic and nondiabetic patients (P interaction=0.09). Both groups had more downstream testing and higher radiation doses with CCTA, but these were highest in diabetic patients (all P interaction≤0.04). Diabetic patients had fewer normal CCTAs than nondiabetic patients (32% versus 50%, P=0.003) and similar normalcy rates with standard evaluation (P=0.70). Notably, 66% of diabetic patients had no or mild stenosis by CCTA with short length of stay comparable to that of nondiabetic patients (P=0.34), whereas those with >50% stenosis had a high prevalence of acute coronary syndrome, invasive coronary angiography, and revascularization.
Conclusions
Knowledge of coronary anatomy with CCTA is beneficial for diabetic patients and can discriminate between lower risk patients with no or little coronary artery disease who can be discharged immediately and higher risk patients with moderate to severe disease who warrant further workup.
Clinical Trial Registration
URL: https://www.clinicaltrials.gov/. Unique identifier: NCT01084239.
Keywords: acute coronary syndrome, cardiac computed tomography, chest pain diagnosis, diabetes mellitus, emergency department
Subject Categories: Computerized Tomography (CT), Diagnostic Testing, Imaging
Introduction
Diabetes mellitus (DM) is an important risk factor for the development and severity of coronary artery disease (CAD). Although DM is considered a coronary heart disease risk equivalent for guiding preventive therapies,1 many diabetic patients do not have obstructive CAD.2 As such, the presence of DM has not been found to be diagnostically helpful in the setting of acute chest pain.3, 4, 5, 6
Cardiac computed tomography angiography (CCTA) is an advanced noninvasive imaging modality with excellent diagnostic accuracy for the detection of CAD. Three large multicenter randomized trials have shown that CCTA implemented early in the emergency department (ED) for the evaluation of acute chest pain was associated with reduced length of stay (LOS) and was a safe alternative compared with standard ED evaluation.7, 8, 9 These findings were driven mostly by CCTA's high negative predictive value for ruling out CAD by direct visualization of the coronary arteries, especially in low‐risk patients.10 It is unknown whether these findings apply to patients with DM in light of their higher pretest probability of CAD.
In this prespecified analysis from the Rule Out Myocardial Ischemia/Infarction by Computer Assisted Tomography (ROMICAT II) trial, we aimed to determine whether patients with DM and higher cardiovascular risk have benefits similar to patients without DM. Specifically, we compared the differences in effectiveness and safety, including downstream testing and radiation exposure, between an early CCTA and standard evaluation in patients with and without DM who presented to the ED with chest pain suggestive of acute coronary syndrome (ACS).
Methods
Study Population and Protocol
The randomized multicenter ROMICAT II trial enrolled 1000 patients at 9 US sites who presented to the ED during weekday daytime hours with symptoms suggestive of ACS but without ischemic ECG changes or initial positive troponin. Details on the study design, inclusion and exclusion criteria, and primary results have been reported previously.7, 11 Briefly, inclusion criteria were patient age of 40 to 74 years, chest pain or anginal equivalent of at least 5‐minute duration within 24 hours of ED presentation, sinus rhythm, and warranting further risk stratification to rule out ACS. The major exclusion criteria were known CAD, new ischemic changes on the ECG, initial troponin in >99th percentile of the local assay, impaired renal function with creatinine >1.5 mg/dL, hemodynamic or clinical instability, allergy to iodinated contrast agent, body mass index (in kg/m2) >40, or currently symptomatic asthma. The trial was approved by the institutional review board at each participating site, and all participants provided informed consent.
Patients were randomized in a 1:1 fashion to either CCTA or standard ED evaluation strategy, as dictated by local health care providers. CCTA was performed with at least 64‐slice computed tomography technology and either retrospectively ECG‐gated or prospectively ECG‐triggered CCTA protocols. The standard ED evaluation strategy included no testing, functional testing (exercise treadmill test, exercise or pharmacological nuclear imaging, stress echocardiography), or invasive coronary angiography. All imaging studies were interpreted by the local sites. Patients were contacted by telephone within 72 hours if discharged within 24 hours of ED presentation to evaluate for potential missed ACS. Patients were followed for 28 days after discharge by telephone interview and were questioned regarding repeated ED visits or hospitalizations for recurrent chest pain, diagnostic testing or interventions, and major adverse cardiac events. In this analysis, we focused on comparing differences between patients with and without DM regarding the effectiveness and safety of implementing an early CCTA strategy versus standard ED evaluation. DM was defined by self‐report if the patient had diabetes that required or did not require insulin and/or was taking either insulin or oral hypoglycemics, according to the medical history form.
End Points
The primary end point was LOS, defined as the time from ED presentation to the time of the discharge order from either the ED or the hospital. Secondary effectiveness end points included rates of direct ED discharge (defined as the proportion of patients discharged from the ED without admission to an observation unit or hospital), hospital admission, downstream testing (defined as ≥2 diagnostic tests, which included CCTA, exercise treadmill test, nuclear stress test, stress echocardiography, transthoracic echocardiography, and invasive coronary angiography), rates of invasive coronary angiography, revascularization (percutaneous coronary intervention and/or coronary arterial bypass grafting), and repeated ED visit or hospitalization for recurrent chest pain at 28 days. Safety end points included cumulative radiation exposure (in mSv) from CCTA, nuclear perfusion imaging, and invasive coronary angiography, calculated using standard methods12 during the index evaluation and follow‐up; missed ACS, defined as an unexpected cardiovascular event within 72 hours after hospital discharge in patients with a hospital stay of <24 hours; and major adverse cardiac events, defined as death, myocardial infarction, unstable angina, or urgent coronary revascularization that occurred within 28 days of the initial ED visit.
Statistical Analysis
Descriptive statistics were expressed as mean±SD or median with interquartile range for continuous variables and as frequency and percentages for categorical variables. To compare differences between groups, we used the Fisher exact test for categorical variables and the Student t test for continuous variables, as appropriate. We used logistic regression to test the interaction between DM and randomized evaluation strategies for binary outcomes and analysis of variance or quantile regression for continuous outcomes, as appropriate. For adjusted analyses of the diabetes interaction with randomized ED strategies on mean and median LOS, we controlled for variables with differences (P<0.05) between patients with and without diabetes, including age, race, ethnicity, cardiac risk factors (sex, hypertension, dyslipidemia, family history of premature CAD, systolic blood pressure, and body mass index), and medications (aspirin, beta blockers, statins). We used the Student t test to compare the mean effective radiation dose between groups and ANOVA to test the interaction between diabetes and randomized evaluation strategies. Two‐tailed P and P interaction values of <0.05 were considered to indicate statistically significance. All analyses were performed using SAS (version 9.2; SAS Institute).
Results
Study Population
Overall, 173 (17%) patients had DM and 827 (83%) did not. Of the 501 patients in the CCTA arm, 86 had DM and 415 were nondiabetic. Of the 499 patients in the standard evaluation arm, 87 had DM and 412 were nondiabetic. Among the patients with DM, 70% were on oral hypoglycemics and 25% were on insulin. Table 1 depicts the baseline characteristics of the ROMICAT II trial participants stratified by DM. Diabetic patients were older, were more frequently black and female, had additional cardiovascular risk factors (especially hypertension and dyslipidemia), took more cardiac medications (aspirin, beta blockers, and statins), and had higher body mass index than patients without DM (all P≤0.01). Patients with and without DM had the same rate of ACS as a final diagnosis (8% for both, P=1.0). In addition, there was no difference in ACS rate by diagnostic strategy (P=0.23). The differences in demographics were not statistically significant between treatment groups for patients with and without DM (all P interactions ≥0.05) (Appendix).
Table 1.
Baseline Characteristics of Patients by Diabetes
| Diabetes | No Diabetes | P Value | |
|---|---|---|---|
| Patients, n (%) | 173 (17) | 827 (83) | |
| Demographics | |||
| Age, y, mean±SD | 57.0±8.2 | 53.6±8.0 | <0.0001 |
| Female sex (%) | 96 (55) | 372 (45) | 0.01 |
| Race | |||
| Black (%) | 64 (37) | 218 (26) | 0.01 |
| White (%) | 90 (52) | 570 (69) | <0.0001 |
| Asian (%) | 9 (5) | 22 (3) | 0.09 |
| Other (%) | 11 (6) | 19 (2) | 0.01 |
| Ethnicity, Hispanic or Latino (%) | 32 (19) | 95 (11) | 0.01 |
| Cardiovascular risk factors | |||
| Hypertension (%) | 152 (88) | 389 (47) | <0.0001 |
| Dyslipidemia (%) | 128 (74) | 326 (39) | <0.0001 |
| Former or current smoking (%) | 79 (46) | 413 (50) | 0.32 |
| Family history of premature CAD (%) | 36 (21) | 235 (28) | 0.05 |
| Number of risk factors (%) | <0.001 | ||
| 0 or 1 | 2 (1) | 371 (45) | |
| 2 or 3 | 100 (58) | 428 (52) | |
| ≥4 | 71 (41) | 28 (3) | |
| Relevant prior medication | |||
| Aspirin, n (%) | 81 (47) | 147 (18) | <0.0001 |
| Beta blocker, n (%) | 50 (29) | 120 (15) | <0.0001 |
| Statins, n (%) | 92 (53) | 202 (24) | <0.0001 |
| Insulin, n (%) | 44 (25) | 0 (0) | <0.0001 |
| Oral hypoglycemics, n (%) | 121 (70) | 0 (0) | <0.0001 |
| Initial ED presentation | |||
| Chief complaint | 1.00 | ||
| CP with or without radiation (%) | 156 (90) | 740 (90) | |
| Pain in arm, jaw, shoulder, or epigastric (%) | 6 (3) | 31 (4) | |
| Shortness of breath (%) | 3 (2) | 14 (2) | |
| Other (%) | 8 (5) | 42 (5) | |
| Heart rate, bpm | 77±13 | 77±15 | 0.97 |
| Systolic blood pressure, mm Hg | 148±23 | 143±23 | 0.02 |
| Diastolic blood pressure, mm Hg | 81±13 | 83±13 | 0.06 |
| Body mass index, kg/m2 | 31.5±4.9 | 28.8±5.0 | <0.0001 |
| Serum creatinine, mg/dL | 0.84±0.22 | 0.87±0.19 | 0.21 |
| Discharge diagnosis during index | 0.09 | ||
| Noncardiac CP (%) | 144 (83) | 727 (88) | |
| Noncoronary CP (%) | 5 (3) | 10 (1) | |
| Coronary CP, not ACS (%) | 11 (6) | 28 (3) | |
| ACS (%) | 13 (8) | 62 (8) | 1.00 |
| Unstable angina pectoris (%) | 11 (6) | 41 (5) | |
| Myocardial infarction (%) | 2 (1) | 21 (3) | |
ACS indicates acute coronary syndrome; bpm, beats per minute; CAD, coronary artery disease; CP, chest pain; ED, emergency department.
Primary and Secondary Effectiveness End Points
Table 2 shows differences in end points between evaluation strategies in participants with and without DM. Among DM patients, mean and median LOS were not statistically significantly different with either strategy, whereas the CCTA strategy resulted in a marked reduction in LOS in patients without DM over standard ED evaluation (mean Δ9.4 hours, P interaction=0.08; median Δ12.2 hours, P interaction=0.004). This difference in median LOS persisted after adjustments for covariates that were different between DM and non‐DM patients (P interaction<0.0001).
Table 2.
End Points Stratified by Diabetes
| CCTA Arm (n=501; Diabetes, n=86; No Diabetes, n=415) | Standard ED Evaluation (n=499; Diabetes, n=87; No Diabetes, n=412) | P Value | P interaction | |
|---|---|---|---|---|
| Primary end point | ||||
| Length of stay, hours | ||||
| Diabetes, mean±SD | 32.2±43.2 | 32.0±20.1 | 0.97 | 0.08/0.004a |
| Mediana [25th, 75th percentile] | 23.9 [6.7, 32.9] | 27.2 [23.8, 31.2] | 0.86 | |
| No diabetes, mean±SD | 21.3±35.3 | 30.6±29.4 | <0.0001 | |
| Mediana [25th, 75th percentile] | 8.4 [6.3, 25.7] | 26.5 [20.0, 30.2] | <0.0001 | |
| Secondary end points | ||||
| Direct ED discharge | ||||
| Diabetes, n (%) | 34 (40) | 12 (14) | 0.0001 | 0.27 |
| No diabetes, n (%) | 205 (49) | 54 (13) | <0.0001 | |
| Hospital admission | ||||
| Diabetes, n (%) | 30 (35) | 25 (29) | 0.41 | 0.09 |
| No diabetes, n (%) | 78 (19) | 101 (25) | 0.05 | |
| Downstream testing | ||||
| Index visit | ||||
| Diabetes, n (%) | 33 (38) | 4 (5) | <0.0001 | 0.001 |
| No diabetes, n (%) | 83 (20) | 49 (12) | 0.002 | |
| At 28‐day follow‐up | ||||
| Diabetes, n (%) | 36 (42) | 6 (7) | <0.0001 | 0.002 |
| No diabetes, n (%) | 97 (23) | 54 (13) | 0.0001 | |
| Invasive coronary angiography | ||||
| Index visit | ||||
| Diabetes, n (%) | 16 (19) | 5 (6) | 0.01 | 0.06 |
| No diabetes, n (%) | 38 (9) | 31 (8) | 0.45 | |
| At 28‐day follow‐up | ||||
| Diabetes, n (%) | 17 (20) | 6 (7) | 0.01 | 0.08 |
| No diabetes, n (%) | 42 (10) | 34 (8) | 0.40 | |
| PCI | ||||
| Index visit | ||||
| Diabetes, n (%) | 6 (7) | 2 (2) | 0.17 | 0.41 |
| No diabetes, n (%) | 18 (4) | 12 (3) | 0.35 | |
| At 28‐day follow‐up | ||||
| Diabetes, n (%) | 6 (7) | 2 (2) | 0.17 | 0.37 |
| No diabetes, n (%) | 21 (5) | 15 (4) | 0.40 | |
| PCI/CABG at 28 days | ||||
| Diabetes, n (%) | 7 (8) | 2 (2) | 0.10 | 0.26 |
| No diabetes, n (%) | 25 (6) | 18 (4) | 0.35 | |
| Repeat ED/hospitalizations for CP | ||||
| Diabetes, n (%) | 0 (0) | 4 (5) | 0.25 | 0.97 |
| No diabetes, n (%) | 14 (3) | 15 (4) | 0.55 | |
| Safety end points | ||||
| Cumulative radiation exposure (mSv) | ||||
| Diabetes, mean±SD | 18.4±14.7 | 6.6±10.4 | <0.0001 | 0.04 |
| No diabetes, mean±SD | 13.4±9.8 | 5.1±9.5 | <0.0001 | |
| Missed ACS | ||||
| Diabetes, n (%) | 0 (0) | 0 (0) | — | — |
| No diabetes, n (%) | 0 (0) | 0 (0) | — | |
| 28‐day MACE | ||||
| Diabetes, n (%) | 0 (0) | 1 (1) | 1.0 | 0.97 |
| No diabetes, n (%) | 2 (0.5) | 5 (1.2) | 0.29 | |
ACS indicates acute coronary syndrome; CABG, coronary artery bypass grafting; CCTA, cardiac computed tomography angiography; CP, chest pain; ED, emergency department; MACE, major adverse cardiovascular events; PCI, percutaneous coronary intervention.
P interaction for median length of stay.
Direct ED discharge was similarly 3 times as high with early CCTA as with standard evaluation in both DM and non‐DM groups (both P≤0.0001, P interaction=0.27). There was no significant difference in hospital admissions between DM and non‐DM groups (P interaction=0.09), although a trend was seen toward fewer admissions for non‐DM patients in the CCTA arm compared with the standard ED arm (P=0.05). Downstream testing at both the index visit and at 28‐day follow‐up was more common in the CCTA arm in both DM and non‐DM participants, and this difference was accentuated in those with DM (P interaction≤0.002). Although there was no significant difference in the use of invasive coronary angiography in DM versus non‐DM patients (P interaction=0.06), we observed a 3‐fold higher rate of cardiac catheterization with the early CCTA strategy in DM patients (P=0.01) that was not seen in those without DM (P=0.45). In addition, there were no differences in revascularization rate with percutaneous coronary intervention and/or coronary artery bypass grafting or repeated ED visit or hospitalization for recurrent chest pain with either ED strategy or diabetes status (all P interactions≥0.26). There was no difference in mean total cost of stay between diabetic and nondiabetic patients when comparing randomized triaged strategies (P interaction=0.26).
Safety End Points
Radiation exposure
The early CCTA strategy resulted in higher estimated cumulative radiation exposure by 28‐day follow‐up in both the DM group (18.4 versus 6.6 mSv; P<0.0001) and the non‐DM group (13.4 versus 5.1 mSv; P<0.0001), with even slightly higher radiation in DM than non‐DM patients (P interaction=0.04) (Table 2).
Table 3 summarizes the effective radiation dose by initial testing modality and subsequent testing stratified by diabetes status. Among patients using the CCTA strategy, DM patients had radiation exposure during their index CCTA scan similar to non‐DM patients (P=0.07); ultimately, however, they incurred higher radiation exposure than non‐DM patients during index hospitalization and follow‐up (both P≤0.006). In the standard ED arm, among patients with an initial nuclear stress test, DM patients had an initially higher radiation dose than non‐DM patients (P=0.002), but this difference was attenuated at the index visit or 28‐day follow‐up (both P=0.11). Of note, DM patients who underwent a nuclear stress test first had comparable radiation exposure by 28‐day follow‐up as those who had an initial CCTA test (16.5 versus 17.2 mSv, P=0.71).
Table 3.
Effective Radiation Dose (in mSv) by Randomization Strategy and Initial Testing Modality With Radiation Exposure and the Cumulative 28‐Day Dose Stratified by Diabetes
| Diabetes | No Diabetes | P Value | |||
|---|---|---|---|---|---|
| n (%) | Mean±SD | n (%) | Mean±SD | ||
| ETT, n=140 | 25 (18) | 115 (82) | |||
| Initial ETT test | 0 | 0 | — | ||
| Index visit | 0.0±0.0 | 1.8±5.2 | 0.0003 | ||
| 28‐day follow‐up | 0.8±3.9 | 2.7±7.4 | 0.06 | ||
| Nuclear stress test, n=116 | 27 (23) | 89 (77) | |||
| Initial nuclear test | 16.5±5.2 | 13.5±4.2 | 0.002 | ||
| Index visit | 16.5±5.2 | 14.4±6.3 | 0.11 | ||
| 28‐day follow‐up | 16.5±5.2 | 14.4±6.3 | 0.11 | ||
| Stress echo, n=106 | 19 (18) | 87 (82) | |||
| Initial stress echo test | 0 | 0 | — | ||
| Index visit | 0.2±1.1 | 0.2±1.1 | 0.82 | ||
| 28‐day follow‐up | 0.2±1.1 | 0.2±1.1 | 0.82 | ||
| CCTA, n=474 | 79 (17) | 395 (83) | |||
| Initial CCTA test | 10.8±4.7 | 9.7±5.0 | 0.07 | ||
| Index visit | 16.4±12.8 | 12.1±9.2 | 0.006 | ||
| 28‐day follow‐up | 17.2±14.3 | 12.4±9.5 | 0.005 | ||
CCTA indicates cardiac computed tomography angiography; echo, echocardiography; ETT, exercise treadmill test.
Missed ACS and major adverse cardiac events
There was no missed ACS event in the trial. There was no interaction between diabetes status and randomized ED strategy for 28‐day major adverse cardiac events (interaction P=0.97), although the number of events was very small in each group.
Initial Diagnostic Testing Results
Table 4 shows the test results stratified by diabetes status. Patients with DM were less likely to have a normal CCTA (32% versus 50%, P=0.003) and had a higher rate of obstructive CAD with severe stenosis (19% versus 9%, P=0.02) than those without DM. In contrast, among the 346 patients with functional testing in the standard evaluation arm, patients with and without DM had similar rates of normal results (83% versus 85%, P=0.70).
Table 4.
Initial Diagnostic Testing Results Stratified by Diabetes Within the Treatment Groups
| Diabetes | No Diabetes | P Value | |
|---|---|---|---|
| CCTA arm | |||
| CCTA (n=473), n | 79 | 394 | 0.005 |
| No CAD (%) | 25 (32) | 198 (50) | 0.003 |
| Mild (1–49%) stenosis (%) | 27 (34) | 122 (31) | 0.60 |
| Moderate (50–69%) stenosis (%) | 7 (9) | 22 (6) | 0.30 |
| Severe (≥50% LM or ≥70%) stenosis (%) | 15 (19) | 37 (9) | 0.02 |
| Indeterminate (%) | 5 (6) | 15 (4) | 0.35 |
| Standard evaluation arm | |||
| Any diagnostic testing (n=346), na | 66 | 280 | |
| Normal (%) | 55 (83) | 239 (85) | 0.70 |
| ETT (n=138) | 24 | 114 | |
| Normal (%) | 23 (96) | 106 (93) | 1.0 |
| Nuclear (n=108), n | 24 | 84 | |
| Normal (%) | 18 (75) | 68 (81) | 0.57 |
| Stress echo (n=100), n | 18 | 82 | |
| Normal (%) | 14 (78) | 65 (79) | 1.0 |
CAD indicates coronary artery disease; CCTA, cardiac computed tomography angiography; echo, echocardiography; ETT, exercise treadmill test; LM, left main.
Includes ETT, nuclear, and stress echo.
CCTA Subgroup Analysis
Table 5 shows the LOSs of patients with and without DM, as categorized by their CCTA findings. Notably, 66% of diabetic patients who underwent CCTA had either no CAD or mild nonobstructive stenosis of <50% (32% no CAD and 34% mild [1–49%] stenosis on CCTA). For these patients, median LOS was short, <8 hours, and similar to the LOS of their non‐DM counterparts (all P values not significant) (Figure). Similar results of short LOS were found when limiting the comparison between DM and non‐DM for those with normal CCTA (P=0.21). When examining the drivers of LOS using CCTA results, having >50% stenosis and indeterminate examinations resulted in a minimum of an overnight stay for both DM and non‐DM patients (Table 5). As expected, DM patients with >50% stenosis by CCTA had high prevalence of ACS, invasive coronary angiography, and revascularization (Table 5).
Table 5.
Length of Stay and Rates of Acute Coronary Syndrome, Invasive Coronary Angiography, and Revascularization During Index Visit Based on CCTA Results Stratified by Diabetes Status
| Diabetes | No Diabetes | P Value | |
|---|---|---|---|
| Length of stay, hours | |||
| No CAD (n=223) | n=25 | n=198 | |
| Mean±SD | 10.2±8.4 | 13.7±31.1 | 0.21 |
| Median [25th, 75th percentile] | 7.0 [5.4, 9.0] | 7.1 [5.8, 9.5] | 0.89 |
| Mild (1–49%) stenosis (n=149) | n=27 | n=122 | |
| Mean±SD | 23.6±33.1 | 13.2±12.2 | 0.12 |
| Median [25th, 75th percentile] | 8.6 [6.5, 28.5] | 8.0 [6.2, 19.7] | 0.71 |
| Moderate (50–69%) stenosis (n=29) | n=7 | n=22 | |
| Mean±SD | 35.6±16.8 | 39.0±31.6 | 0.71 |
| Median [25th, 75th percentile] | 36.3 [27.6, 54.6] | 28.7 [20.6, 49.0] | 0.38 |
| Severe (≥50% LM or ≥70%) stenosis (n=52) | n=15 | n=37 | |
| Mean±SD | 81.8±73.0 | 70.8±64.3 | 0.61 |
| Median [25th, 75th percentile] | 49.3 [29.2, 101.7] | 50.1 [30.4, 76.8] | 0.98 |
| Indeterminate (n=20) | n=5 | n=15 | |
| Mean±SD | 33.8±10.9 | 28.4±25.6 | 0.52 |
| Median [25th, 75th percentile] | 28.2 [26.7, 35.5] | 24.8 [11.0, 28.2] | 0.76 |
| Acute coronary syndrome | |||
| No CAD (n=223) | 0 | 1 (0.5) | 1.0 |
| Mild (1–49%) stenosis (n=149) | 0 | 0 | — |
| Moderate (50–69%) stenosis (n=29) | 1 (14) | 2 (9) | 1.0 |
| Severe (≥50% LM or ≥70%) stenosis (n=52) | 6 (40) | 27 (73) | 0.05 |
| Indeterminate (n=20) | 0 | 1 (7) | 1.0 |
| Invasive coronary angiography | |||
| No CAD (n=223) | 0 | 2 (1) | 1.0 |
| Mild (1–49%) stenosis (n=149) | 1 (4) | 2 (2) | 0.45 |
| Moderate (50–69%) stenosis (n=29) | 3 (43) | 6 (27) | 0.64 |
| Severe (≥50% LM or ≥70%) stenosis (n=52) | 11 (73) | 24 (65) | 0.75 |
| Indeterminate (n=20) | 0 | 2 (13) | 1.0 |
| Revascularization with PCI or CABG | |||
| No CAD (n=223) | 0 | 1 (0.5) | 1.0 |
| Mild (1–49%) stenosis (n=149) | 0 | 0 | — |
| Moderate (50–69%) stenosis (n=29) | 1 (14) | 2 (9) | 1.0 |
| Severe (≥50% LM or ≥70%) stenosis (n=52) | 5 (33) | 17 (46) | 0.23 |
| Indeterminate (n=20) | 0 | 1 (7) | 1.0 |
CABG indicates coronary artery bypass grafting; CAD, coronary artery disease; CCTA, cardiac computed tomography angiography; LM, left main; PCI, percutaneous coronary intervention.
Figure 1.
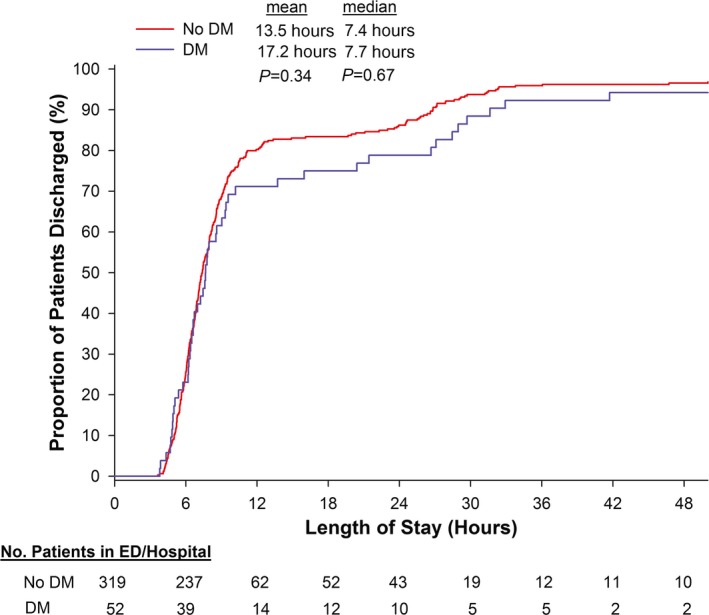
Length of stay for patients with no or mild coronary atherosclerosis (<50% stenosis) by cardiac computed tomography angiography, stratified by diabetes. DM indicates diabetes mellitus; ED, emergency department.
Discussion
In this analysis of the ROMICAT II trial, patients with DM had similar LOS when early CCTA was used in the ED evaluation compared with standard ED evaluation of acute chest pain suggestive of ACS. In contrast, patients without diabetes had reduced LOS by a median of 12 hours with an early CCTA strategy compared with standard ED evaluation. Although all patients in the early CCTA arm had 3‐fold more direct ED discharges, there was also increased downstream testing and unwanted higher cumulative radiation exposure, which were accentuated among those with DM, despite similar cost differences between strategies. Importantly, two‐thirds of DM patients who underwent CCTA had no or mild CAD and benefited from short LOS similar to their non‐DM counterpart.
The efficient diagnosis and management of diabetic patients with acute chest pain and without known CAD has remained a challenge for decades. Prior studies of such patients have not found the presence of diabetes or other cardiovascular risk factors to be predictive of ACS.3, 4, 5, 6 Nevertheless, given the association between CAD and DM, it is likely that many physicians feel uncomfortable discharging diabetic patients without time‐consuming confirmatory testing. Older literature found that diabetic patients with acute chest pain were more likely to be hospitalized than nondiabetic patients.3 Although a strategy of using resting myocardial perfusion imaging in patients with acute chest pain reduced hospital admissions,13 this was not found to be true in diabetic patients.14 CCTA has demonstrated great promise in reducing LOS and hospital admissions for patients with acute chest pain,7, 8, 9 largely as a result of the excellent negative predictive value of a normal scan. CCTA studies comparing diabetic and nondiabetic patients, however, have consistently demonstrated higher rates of plaque, plaque severity, obstructive CAD, and multivessel CAD in the former group.15, 16, 17 In ROMICAT II, patients without diabetes had a median 12‐hour reduction in LOS if early CCTA was used compared with standard ED evaluation. Regardless of diabetes status, patients with >50% stenosis by CCTA rightfully required an overnight stay with >24 hours in the hospital and had a high prevalence of ACS as well as greater use of invasive coronary angiography and revascularization. The decrease in efficiency of LOS in diabetic patients may be explained by the increased prevalence and severity of CAD, as detected by CCTA, over their non‐DM counterparts.
In contrast, the surprisingly high prevalence of diabetic patients in the CCTA arm who had no or mild CAD of <50% stenosis by CCTA is noteworthy. These DM patients accounted for two‐thirds of those scanned; had a median short LOS of <8 hours, similar to nondiabetic patients; and had a 3‐fold increase in direct ED discharge compared with those in the standard ED arm. Although the attenuation of LOS reduction in diabetic patients reflects a clinically relevant increase in testing to identify those at higher risk with moderate to severe CAD, those without obstructive disease are effectively discharged home from the ED. Our findings provide support and should reassure health care providers that although DM patients have higher rates of CAD than patients without DM,15, 16, 17 a large proportion have no or mild CAD and can be discharged from the ED.
Limitations
Our study had several notable limitations. Patients with diabetes composed only 17% of the sample, and the overall number of major adverse events was low. The interactions between diabetes status and treatment on the secondary or safety end points were unadjusted because of the limitations of having few events in our study; therefore, the interaction may not be due to diabetes but to a confounding variable. This prevalence of diabetes, however, is similar to that in other large randomized CCTA trials. In addition, the tradeoff for increased CAD detection by CCTA is likely greater utilization of downstream testing,7 which is especially prominent in diabetic patients, although the trial was not designed to capture the outcomes of downstream interventions or longer follow‐up periods beyond 28 days. Another limitation to CCTA implementation is increased radiation exposure, which was accentuated among patients with DM in ROMICAT II; however, compared with DM patients who underwent nuclear imaging first, those who underwent CCTA first incurred similar radiation exposure. The radiation dose exposure reported for CCTA in ROMICAT II is higher than is typical in current practice, given the availability of newer imaging acquisition protocols and scanner technology. More recent improvements in CCTA technology have reduced radiation doses to submillisievert ranges,18, 19 so the increased radiation dose may be most relevant for those with moderate to severe CAD, who will likely incur downstream tests and procedures that requires ionizing radiation, such as nuclear imaging or cardiac catheterization.
Conclusion
In ED patients with acute chest pain, an early CCTA strategy compared with standard ED evaluation was associated with shorter LOS in nondiabetic patients but similar LOS in diabetic patients. Nevertheless, two‐third of diabetic patients had no or mild coronary atherosclerosis by CCTA and benefited similarly with short LOS and high rate of direct ED discharge. Direct visualization of higher prevalent CAD by CCTA may explain the increased downstream testing and radiation exposure with CCTA that were accentuated in patients with diabetes. Knowledge of coronary anatomy with CCTA is beneficial for the DM cohort and can discriminate between lower risk patients with no or little CAD who can be discharged immediately and higher risk patients with moderate to severe disease who warrant further investigation and therapy.
Sources of Funding
The study was supported by the NIH/NHLBI (U01HL092040 and U01HL092022). Dr Truong was supported by the NIH (K23HL098370 and L30HL093896).
Disclosures
Dr Truong reports grants from NIH/NHLBI, other from American College of Radiology, other from Society of Cardiovascular Computed Tomography, outside the submitted work. Dr Udelson reports grants from NHLBI/NIH, during the conduct of the study. Dr Schoenfeld reports grants from NHLBI, during the conduct of the study. Dr Hoffmann reports grants from NIH/NHLBI, during the conduct of the study; grants from Siemens Healthcare, grants from American College of Radiology, grants from Genentech, grants from HeartFlow, personal fees from American Heart Association, outside the submitted work. Dr Woodard reports grants from National Institutes of Health, during the conduct of the study; grants from ACR Imaging Network (ACRIN), grants from Bayer, grants from Guerbet, grants from Biotronik, personal fees from Medtronic, outside the submitted work; In addition, Dr Woodard has a patent US8436140 issued.
Baseline Characteristics of Patients by Diabetes and Randomized ED Strategies
| Diabetes | No Diabetes | P interaction | |||
|---|---|---|---|---|---|
| CCTA Arm | Standard ED Evaluation | CCTA Arm | Standard ED Evaluation | ||
| n (%) | 86 (17) | 87 (17) | 415 (83) | 412 (83) | |
| Demographics | |||||
| Age, y (mean±SD) | 56.6±8.5 | 57.4±7.9 | 53.5±7.9 | 53.8±8.0 | 0.75 |
| Female (%) | 46 (53) | 50 (57) | 193 (47) | 179 (43) | 0.40 |
| Race | |||||
| Black (%) | 30 (35) | 34 (39) | 111 (27) | 107 (26) | 0.53 |
| White (%) | 43 (50) | 47 (54) | 287 (69) | 283 (69) | 0.59 |
| Asian (%) | 6 (7) | 3 (4) | 12 (3) | 10 (2) | 0.51 |
| Other (%) | 7 (8) | 4 (5) | 5 (1) | 14 (3) | 0.05 |
| Ethnicity, Hispanic or Latino (%) | 17 (20) | 15 (17) | 42 (10) | 53 (13) | 0.33 |
| Cardiovascular risk factors | |||||
| Hypertension (%) | 78 (91) | 74 (85) | 191 (46) | 198 (48) | 0.21 |
| Dyslipidemia (%) | 67 (78) | 61 (70) | 163 (39) | 163 (40) | 0.27 |
| Former or current smoking (%) | 36 (42) | 43 (49) | 213 (51) | 200 (49) | 0.22 |
| Family history of premature CAD (%) | 14 (16) | 22 (25) | 121 (29) | 114 (28) | 0.13 |
| Number of risk factors (%) | 0.95 | ||||
| 0 to 1 | 0 (0) | 2 (2) | 182 (44) | 189 (46) | |
| 2 to 3 | 54 (63) | 46 (53) | 217 (52) | 211 (51) | |
| ≥4 | 32 (37) | 39 (45) | 16 (4) | 12 (3) | |
| Relevant prior medication | |||||
| Aspirin, n (%) | 40 (47) | 41 (47) | 75 (18) | 72 (17) | 0.85 |
| Beta blocker, n (%) | 24 (28) | 26 (30) | 64 (15) | 56 (14) | 0.53 |
| Statins, n (%) | 50 (58) | 42 (48) | 93 (22) | 109 (26) | 0.08 |
| Insulin, n (%) | 24 (28) | 20 (23) | 0 (0) | 0 (0) | 0.90 |
| Oral hypoglycemics, n (%) | 58 (67) | 63 (72) | 0 (0) | 0 (0) | 0.91 |
| Initial ED presentation | |||||
| Chief complaint | 0.46 | ||||
| CP with or without radiation (%) | 74 (86) | 82 (94) | 370 (89) | 370 (90) | |
| Pain in arm, jaw, shoulder, or epigastric (%) | 4 (5) | 2 (2) | 17 (4) | 14 (3) | |
| Shortness of breath (%) | 2 (2) | 1 (1) | 5 (1) | 9 (2) | |
| Other (%) | 6 (7) | 2 (2) | 23 (6) | 19 (5) | |
| Heart rate, bpm | 78±14 | 77±13 | 78±15 | 77±15 | 0.94 |
| Systolic blood pressure, mm Hg | 149±23 | 147±22 | 143±23 | 144±23 | 0.42 |
| Diastolic blood pressure, mm Hg | 82±11 | 80±15 | 83±14 | 84±13 | 0.26 |
| Body mass index, kg/m2 | 31.9±4.7 | 31.1±5.1 | 28.8±5.2 | 28.7±4.7 | 0.49 |
| Serum creatinine, mg/dL | 0.85±0.23 | 0.84±0.21 | 0.87±0.19 | 0.87±0.19 | 0.79 |
| Discharge diagnosis during index | 0.13 | ||||
| Noncardiac CP (%) | 65 (76) | 79 (91) | 361 (87) | 366 (89) | |
| Noncoronary CP (%) | 2 (2) | 3 (3) | 5 (1) | 5 (1) | |
| Coronary CP, not ACS (%) | 10 (12) | 1 (1) | 15 (4) | 13 (3) | |
| ACS (%) | 9 (10) | 4 (5) | 34 (8) | 28 (7) | 0.31 |
| Unstable angina pectoris (%) | 8 (9) | 3 (3) | 27 (7) | 14 (3) | |
| Myocardial infarction (%) | 1 (1) | 1 (1) | 7 (2) | 14 (3) | |
(J Am Heart Assoc. 2016;5:e003137 doi: 10.1161/JAHA.115.003137)
The content of this manuscript is solely the responsibility of the authors and does not necessarily reflect the official views of the National Institutes of Health or the Department of Health and Human Services.
References
- 1. Stone NJ, Robinson JG, Lichtenstein AH, Bairey Merz CN, Blum CB, Eckel RH, Goldberg AC, Gordon D, Levy D, Lloyd‐Jones DM, McBride P, Schwartz JS, Shero ST, Smith SC Jr, Watson K, Wilson PW, Eddleman KM, Jarrett NM, LaBresh K, Nevo L, Wnek J, Anderson JL, Halperin JL, Albert NM, Bozkurt B, Brindis RG, Curtis LH, DeMets D, Hochman JS, Kovacs RJ, Ohman EM, Pressler SJ, Sellke FW, Shen WK, Smith SC Jr, Tomaselli GF; American College of Cardiology/American Heart Association Task Force on Practice G . 2013 ACC/AHA guideline on the treatment of blood cholesterol to reduce atherosclerotic cardiovascular risk in adults: a report of the American College of Cardiology/American Heart Association Task Force on Practice Guidelines. Circulation. 2014;129:S1–S45. [DOI] [PubMed] [Google Scholar]
- 2. Howard BV, Best LG, Galloway JM, Howard WJ, Jones K, Lee ET, Ratner RE, Resnick HE, Devereux RB. Coronary heart disease risk equivalence in diabetes depends on concomitant risk factors. Diabetes Care. 2006;29:391–397. [DOI] [PubMed] [Google Scholar]
- 3. Lopez‐Jimenez F, Goldman L, Johnson PA, Polanczyk CA, Cook EF, Fleischmann KE, Orav EJ, Lee TH. Effect of diabetes mellitus on the presentation and triage of patients with acute chest pain without known coronary artery disease. Am J Med. 1998;105:500–505. [DOI] [PubMed] [Google Scholar]
- 4. Jayes RL Jr, Beshansky JR, D'Agostino RB, Selker HP. Do patients’ coronary risk factor reports predict acute cardiac ischemia in the emergency department? A multicenter study J Clin Epidemiol. 1992;45:621–626. [DOI] [PubMed] [Google Scholar]
- 5. Han JH, Lindsell CJ, Storrow AB, Luber S, Hoekstra JW, Hollander JE, Peacock WF IV, Pollack CV, Gibler WB; Investigators Eit . The role of cardiac risk factor burden in diagnosing acute coronary syndromes in the emergency department setting. Ann Emerg Med. 2007;49:145–152, 152.e141. [DOI] [PubMed] [Google Scholar]
- 6. Body R, McDowell G, Carley S, Mackway‐Jones K. Do risk factors for chronic coronary heart disease help diagnose acute myocardial infarction in the Emergency Department? Resuscitation. 2008;79:41–45. [DOI] [PubMed] [Google Scholar]
- 7. Hoffmann U, Truong QA, Schoenfeld DA, Chou ET, Woodard PK, Nagurney JT, Pope JH, Hauser TH, White CS, Weiner SG, Kalanjian S, Mullins ME, Mikati I, Peacock WF, Zakroysky P, Hayden D, Goehler A, Lee H, Gazelle GS, Wiviott SD, Fleg JL, Udelson JE; Investigators R‐I . Coronary CT angiography versus standard evaluation in acute chest pain. N Engl J Med. 2012;367:299–308. [DOI] [PMC free article] [PubMed] [Google Scholar]
- 8. Litt HI, Gatsonis C, Snyder B, Singh H, Miller CD, Entrikin DW, Leaming JM, Gavin LJ, Pacella CB, Hollander JE. CT angiography for safe discharge of patients with possible acute coronary syndromes. N Engl J Med. 2012;366:1393–1403. [DOI] [PubMed] [Google Scholar]
- 9. Goldstein JA, Chinnaiyan KM, Abidov A, Achenbach S, Berman DS, Hayes SW, Hoffmann U, Lesser JR, Mikati IA, O'Neil BJ, Shaw LJ, Shen MY, Valeti US, Raff GL. The CT‐STAT (Coronary Computed Tomographic Angiography for Systematic Triage of Acute Chest Pain Patients to Treatment) trial. J Am Coll Cardiol. 2011;58:1414–1422. [DOI] [PubMed] [Google Scholar]
- 10. Truong QA, Hayden D, Woodard PK, Kirby R, Chou ET, Nagurney JT, Wiviott SD, Fleg JL, Schoenfeld DA, Udelson JE, Hoffmann U. Sex differences in the effectiveness of early coronary computed tomographic angiography compared with standard emergency department evaluation for acute chest pain: the rule‐out myocardial infarction with Computer‐Assisted Tomography (ROMICAT)‐II Trial. Circulation. 2013;127:2494–2502. [DOI] [PMC free article] [PubMed] [Google Scholar]
- 11. Hoffmann U, Truong QA, Fleg JL, Goehler A, Gazelle S, Wiviott S, Lee H, Udelson JE, Schoenfeld D; ROMICAT II . Design of the Rule Out Myocardial Ischemia/Infarction Using Computer Assisted Tomography: a multicenter randomized comparative effectiveness trial of cardiac computed tomography versus alternative triage strategies in patients with acute chest pain in the emergency department. Am Heart J. 2012;163:330–338, 338.e331. [DOI] [PMC free article] [PubMed] [Google Scholar]
- 12. Gerber TC, Carr JJ, Arai AE, Dixon RL, Ferrari VA, Gomes AS, Heller GV, McCollough CH, McNitt‐Gray MF, Mettler FA, Mieres JH, Morin RL, Yester MV. Ionizing radiation in cardiac imaging: a science advisory from the American Heart Association Committee on Cardiac Imaging of the Council on Clinical Cardiology and Committee on Cardiovascular Imaging and Intervention of the Council on Cardiovascular Radiology and Intervention. Circulation. 2009;119:1056–1065. [DOI] [PubMed] [Google Scholar]
- 13. Udelson JE, Beshansky JR, Ballin DS, Feldman JA, Griffith JL, Handler J, Heller GV, Hendel RC, Pope JH, Ruthazer R, Spiegler EJ, Woolard RH, Selker HP. Myocardial perfusion imaging for evaluation and triage of patients with suspected acute cardiac ischemia: a randomized controlled trial. JAMA. 2002;288:2693–2700. [DOI] [PubMed] [Google Scholar]
- 14. Kapetanopoulos A, Heller GV, Selker HP, Ruthazer R, Beshansky JR, Feldman JA, Griffith JL, Hendel RC, Pope JH, Spiegler EJ, Udelson JE. Acute resting myocardial perfusion imaging in patients with diabetes mellitus: results from the Emergency Room Assessment of Sestamibi for Evaluation of Chest Pain (ERASE Chest Pain) trial. J Nucl Cardiol. 2004;11:570–577. [DOI] [PubMed] [Google Scholar]
- 15. Rana JS, Dunning A, Achenbach S, Al‐Mallah M, Budoff MJ, Cademartiri F, Callister TQ, Chang H‐J, Cheng VY, Chinnaiyan K, Chow BJW, Cury R, Delago A, Feuchtner G, Hadamitzky M, Hausleiter J, Kaufmann P, Karlsberg RP, Kim Y‐J, Leipsic J, Labounty TM, Lin FY, Maffei E, Raff G, Villines TC, Shaw LJ, Berman DS, Min JK. Differences in prevalence, extent, severity, and prognosis of coronary artery disease among patients with and without diabetes undergoing coronary computed tomography angiography: results from 10,110 individuals from the CONFIRM (COronary CT Angiography EvaluatioN For Clinical Outcomes): an InteRnational Multicenter Registry. Diabetes Care. 2012;35:1787–1794. [DOI] [PMC free article] [PubMed] [Google Scholar]
- 16. de Araujo Goncalves P, Garcia‐Garcia HM, Carvalho MS, Dores H, Sousa PJ, Marques H, Ferreira A, Cardim N, Teles RC, Raposo L, Gabriel HM, Almeida M, Aleixo A, Carmo MM, Machado FP, Mendes M. Diabetes as an independent predictor of high atherosclerotic burden assessed by coronary computed tomography angiography: the coronary artery disease equivalent revisited. Int J Cardiovasc Imaging. 2013;29:1105–1114. [DOI] [PubMed] [Google Scholar]
- 17. Kamimura M, Moroi M, Isobe M, Hiroe M. Role of coronary CT angiography in asymptomatic patients with type 2 diabetes mellitus. Int Heart J. 2012;53:23–28. [DOI] [PubMed] [Google Scholar]
- 18. Achenbach S, Marwan M, Ropers D, Schepis T, Pflederer T, Anders K, Kuettner A, Daniel WG, Uder M, Lell MM. Coronary computed tomography angiography with a consistent dose below 1 mSv using prospectively electrocardiogram‐triggered high‐pitch spiral acquisition. Eur Heart J. 2010;31:340–346. [DOI] [PubMed] [Google Scholar]
- 19. Deseive S, Pugliese F, Meave A, Alexanderson E, Martinoff S, Hadamitzky M, Massberg S, Hausleiter J. Image quality and radiation dose of a prospectively electrocardiography‐triggered high‐pitch data acquisition strategy for coronary CT angiography: the multicenter, randomized PROTECTION IV study. J Cardiovasc Comput Tomogr. 2015;9:278–285. [DOI] [PubMed] [Google Scholar]