Summary
The mammalian skeletal system harbours a hierarchical system of mesenchymal stem cells, osteoprogenitors and osteoblasts sustaining lifelong bone formation. Osteogenesis is indispensable for the homeostatic renewal of bone as well as regenerative fracture healing, but these processes frequently decline in ageing organisms leading to loss of bone mass and increased fracture incidence. There is evidence indicating that the growth of blood vessels in bone and osteogenesis are coupled, but relatively little is known about the underlying cellular and molecular mechanisms. Here we identify a new capillary subtype in the murine skeletal system with distinct morphological, molecular and functional properties. These vessels are found in specific locations, mediate growth of the bone vasculature, generate distinct metabolic and molecular microenvironments, maintain perivascular osteoprogenitors, and couple angiogenesis to osteogenesis. The abundance of these vessels and associated osteoprogenitors was strongly reduced in bone from aged animals, which was pharmacologically reversible to restore bone mass.
Keywords: Bone formation, endothelial cells, ageing, hypoxia-inducible factor
Introduction
Blood vessels mediate the transport of circulating of cells, oxygen, nutrients, and waste products, but also provide so-called angiocrine signals controlling organ growth and homeostasis1–4. In addition to well-known differences between arteries, capillaries and veins, endothelial cells (ECs) are highly heterogenous and acquire specialised functional properties in local microenvironments5,6. The nature of these specialisation processes and the underlying regulation remain largely unknown.
In the mammalian skeletal system, growth of the vascular network is regulated by signals provided by chondrocytes and other bone cells, among which the vascular endothelial growth factor (VEGF) is studied best7,8. Conversely, blood vessels are thought to influence the osteogenic generation of new bone9,10. In addition to historic studies highlighting the close proximity of vascular and osteoblastic cells, potential roles of angiogenic blood vessel growth in fracture healing have been proposed11,12. It also has been suggested that alterations in the skeletal microvasculature might be linked to compromised hematopoiesis and osteogenesis in human subjects with primary osteoporosis or at old age13,14. However, direct evidence for such disease-causing or age-related alterations is lacking and our understanding of the normal organisation, functional specialisation and precise function of the skeletal vasculature is incomplete.
Results
Vessel architecture and implications for bone oxygenation
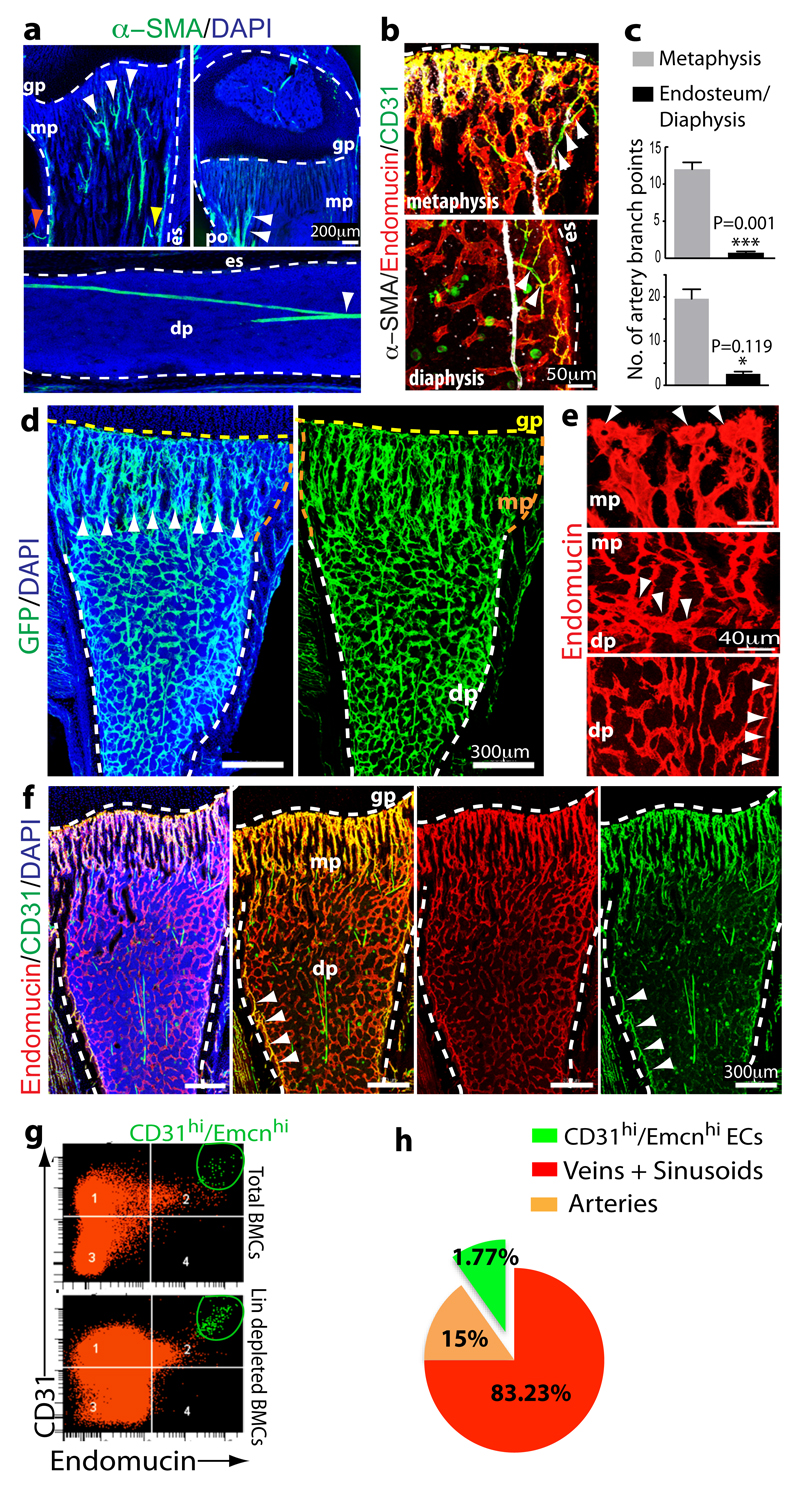
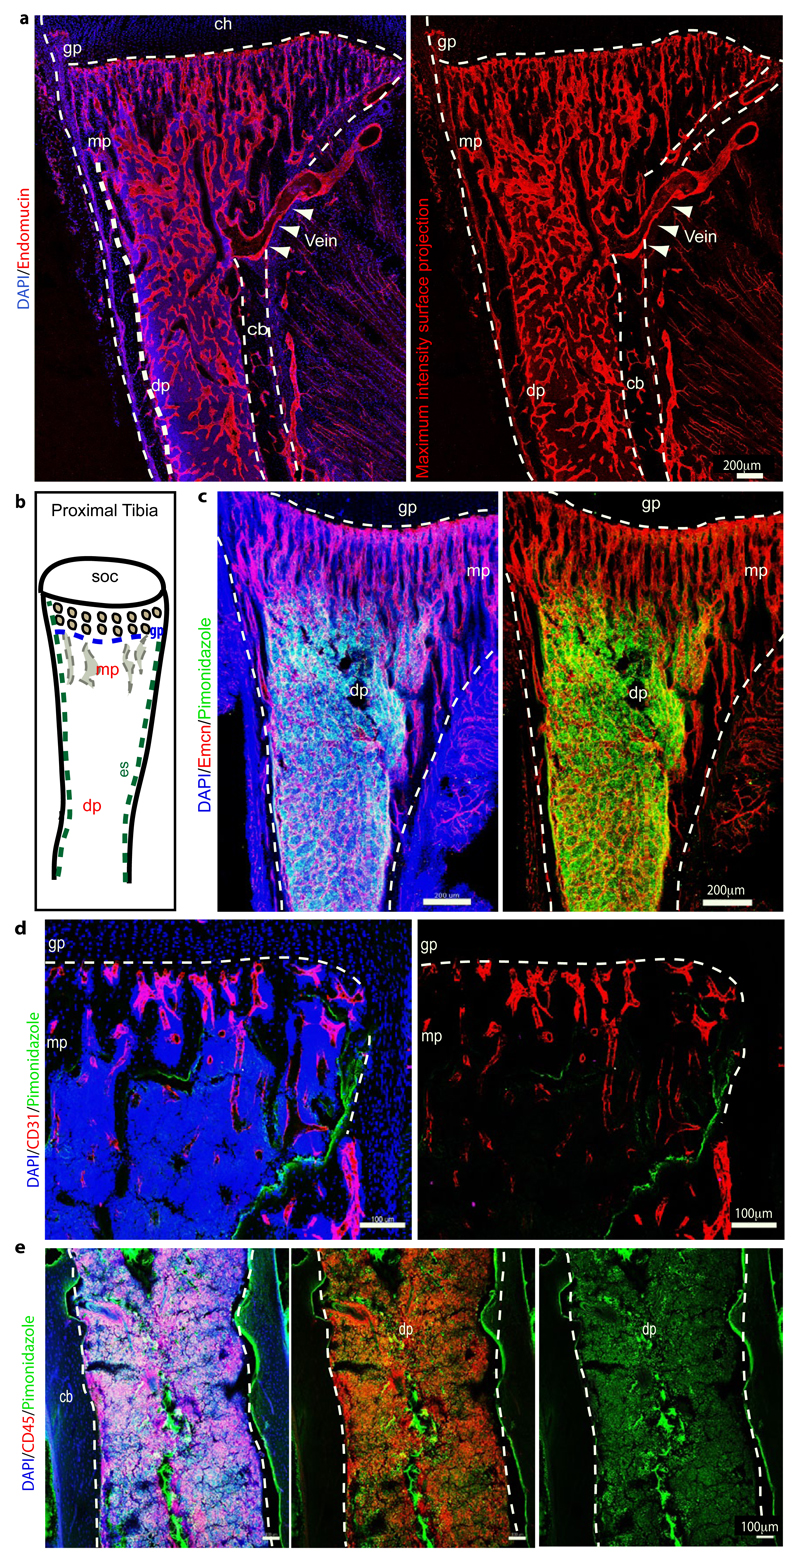
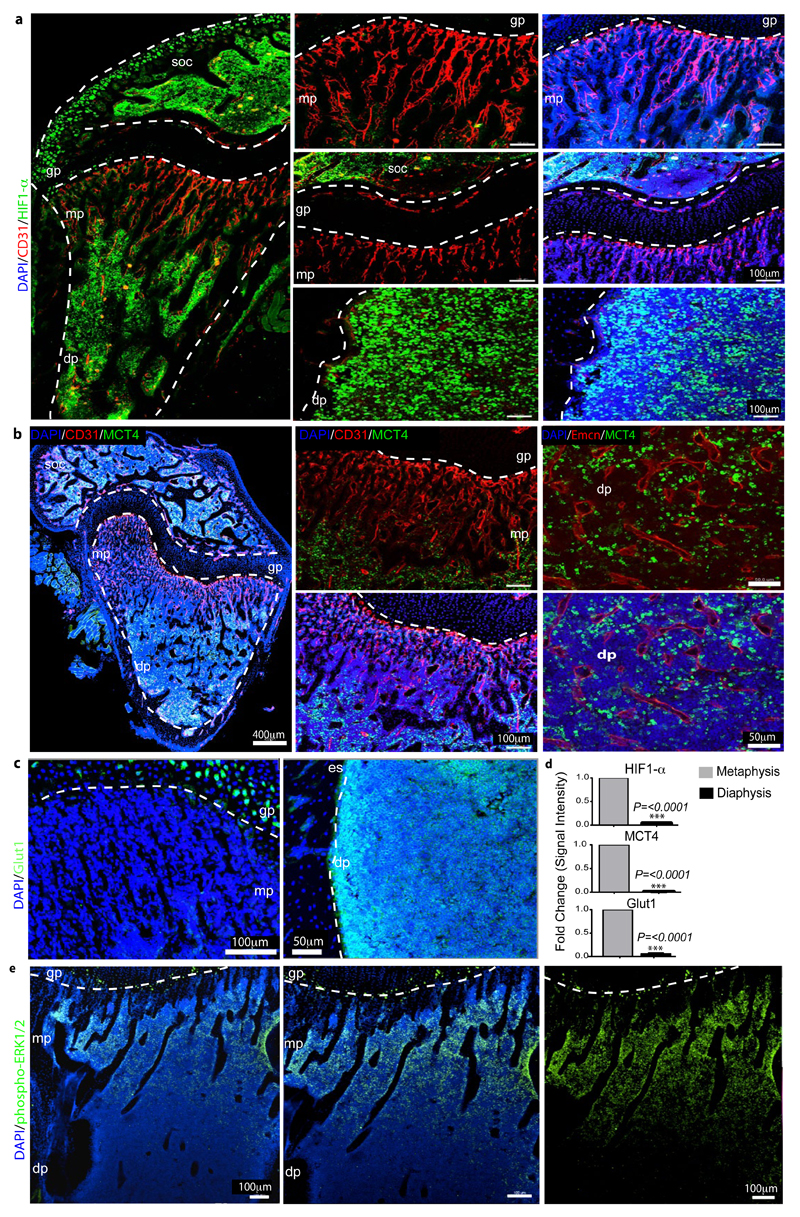
Previous work has shown that molecular and structural differences distinguish arteries and distal arterioles in bone from sinusoidal capillaries15–18. Sinusoidal capillaries form highly branched and irregular networks, and are primarily found between hematopoietic cells within the marrow cavity. Arteries contain comparably few side branches and, as historic publications19,20 have shown, preferentially enter long bone through the femoral or tibial head. The precise overall organization of the skeletal vasculature has remained poorly understood because of technical difficulties associated with the processing of bone combined with the loss of crucial 3D information in thin tissue sections. Revised immunohistochemistry protocols (see Methods) have now allowed us to image the bone vasculature at high resolution. To characterise the organisation of arteries, α-smooth muscle actin (α-SMA) staining on thick tibia sections (300 μm) was performed. As proposed previously19,20, straight and smooth muscle cell-covered arteries entered through the bone cortex (Fig. 1a). The central diaphysis contained few, largely unbranched arteries (diameter 16-27 μm). In contrast, substantial branching was seen in the metaphysis when arteries (diameter 5-15 μm) approached the growth plate (Fig. 1a), a structure that in small rodents, unlike in humans, persists into adulthood. Some distal arterioles terminated at capillaries in the endosteum (i.e., the connective tissue lining the inner surface of compact bone), whereas most termination points were found in the metaphysis near the growth plate (Fig. 1b, c; Extended Data Fig. 1a). Veins were located in the central diaphysis, connected to metaphyseal capillaries and exited through the cortical bone collar (Extended Data Fig. 2a). Thus, arterial oxygen and nutrient-rich blood is preferentially fed into capillaries near the growth plate, which might affect the local metabolic status. Analysis of tibia sections by pimonidazole staining indicated low oxygenation of the diaphysis whereas the metaphysis was not hypoxic (Extended Data Fig. 2b-e). Likewise, hypoxia-inducible factor 1-α (HIF1-α) immunostaining abundantly labelled cell nuclei throughout the diaphysis and in secondary ossification centres but not in metaphysis (Extended Data Fig. 3a). The plasma membrane lactate transporter MCT4, a hypoxia-regulated protein21, and glucose transporter-1 (Glut1), which is induced by HIF signalling and low glucose22, were abundant throughout the diaphysis but not in the metaphysis (Extended Data Fig. 3b-d). Conversely, phosphorylated mitogen-activated protein kinase (phospho-Erk1/2), a marker of cell growth and high metabolic activity23, was strongly enriched in metaphyseal cells (Extended Data Fig. 3e). These data indicate that the spatial distribution of arteries and arteriole-capillary connections determine regional differences in oxygenation and metabolic activity.
Figure 1.
Identification of bone vessel subtypes.
a, Confocal images showing α-SMA+ arteries (green) in thick sections (300μm) of juvenile 4 week-old tibia. Nuclei, DAPI (blue). Arteries enter through the cortex (red arrowhead), terminate in endosteum (yellow), and branch in the metaphysis (mp) or diaphysis (dp) (white). Dashed lines mark growth plate (gp) or endosteum (es).
b, α-SMA+ (white) arteries and α-SMA- CD31+ (green) Emcn- (red) arterioles terminate in CD31+ Emcn+ capillaries within metaphysis and endosteum (es).
c, Quantitation of α-SMA+ (top) and CD31+/Emcn- (bottom) arterial branch points in 4 week-old tibia. Data represent mean±s.e.m (n=6 mice for quantification of α-SMA+ arterial branch points from six independent experiments and n=4 for quantification of CD31+/Emcn- arterial branch points; both from four independent experiments). P values, two-tailed unpaired t-tests.
d, Representative tile scans of GFP+ (green) endothelium in juvenile Cdh5(PAC)-CreERT2 x Rosa26-mT/mG mouse tibia. Yellow dashed line marks growth plate (gp). Note distinct organisation and interconnections (arrowheads) of microvessels in metaphysis (mp) and diaphysis (dp).
e, Maximum intensity projections of EC columns in metaphysis (mp, arrowheads mark distal protrusions), which are connected (arrowheads in central panel) to highly branched sinusoids in diaphysis (dp).
f, Confocal tile scan of juvenile 3 week-old tibia showing CD31+ (green) and Emcn+ (red) ECs in metaphysis (mp) and endosteum (arrowheads).
g, Representative flow cytometry dot plots showing CD31hi/Emcnhi ECs in lineage (Lin) depleted bone marrow cells (BMCs).
h, Relative abundance of EC subtypes in 4 week-old long bone. CD31hi/Emcnhi cells represent 1.77±0.01% (mean ± s.d.m, n=7 mice from three independent experiments) of total ECs.
Identification of a distinct EC subpopulation in bone
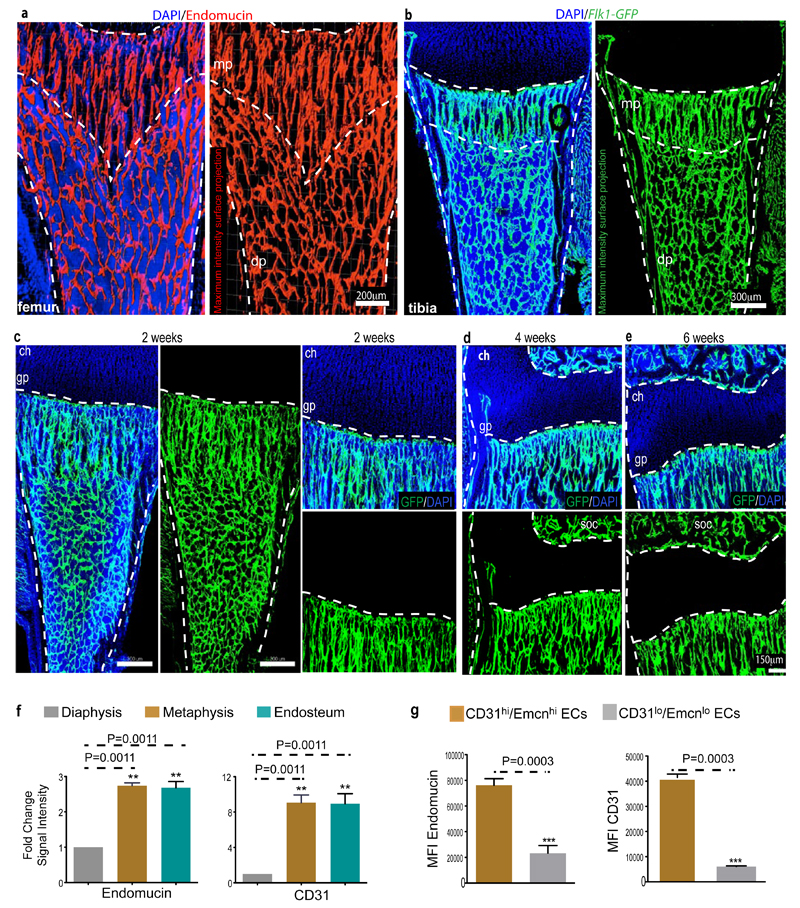
In addition to revised immunofluorescence protocols, we visualised bone vessels with a combination of EC specific, tamoxifen-inducible Cdh5(PAC)-CreERT2 and Rosa26-mT/mG Cre reporter transgenic mice24,25. Imaging of the bone microvasculature with both approaches uncovered structurally distinct capillary subsets. Consistent with historical dye injection and corrosion cast experiments10,26, endothelial tubes in the metaphysis resembled straight columns that were interconnected by distal vessel loops or arches. In contrast, diaphyseal capillaries displayed the highly branched pattern characteristic for the sinusoidal vasculature of bone marrow (Fig. 1d, e; Extended Data Fig. 4a-b). At the interface between metaphysis and diaphysis, the two vessel types were connected confirming that they were part of one continuous vascular bed (Fig. 1e). Cdh5(PAC)-CreERT2 and Rosa26-mT/mG double transgenics also validated the EC specificity of Cre and absence of GFP in chondrocytes, osteoprogenitors, osteocytes or hematopoietic cells (Extended Data Fig. 4c-e).
The different vessel types were distinguishable by immunostaining with specific cell surface markers. Columnar tubes and arches in the metaphysis and endosteal ECs were strongly positive for CD31/PECAM1 and Endomucin (Emcn), while sinusoidal vessels in the diaphysis displayed only weak CD31 staining and slightly lower Emcn expression (Fig. 1f; Extended Data Fig. 4f, g). A distinct CD31hi/Emcnhi endothelial subset could be also identified and separated from CD31lo/Emcnlo cells in single cell suspensions of long bones (see Methods) (Fig. 1g). Analysis of arteries in relation to capillary subsets indicated that distal CD31+ Emcn- arterioles terminated within the CD31hi/Emcnhi endothelium (Fig. 1b). Quantitative analysis by flow cytometry showed that CD31hi/Emcnhi cells represented only a small fraction of total ECs (Fig. 1h).
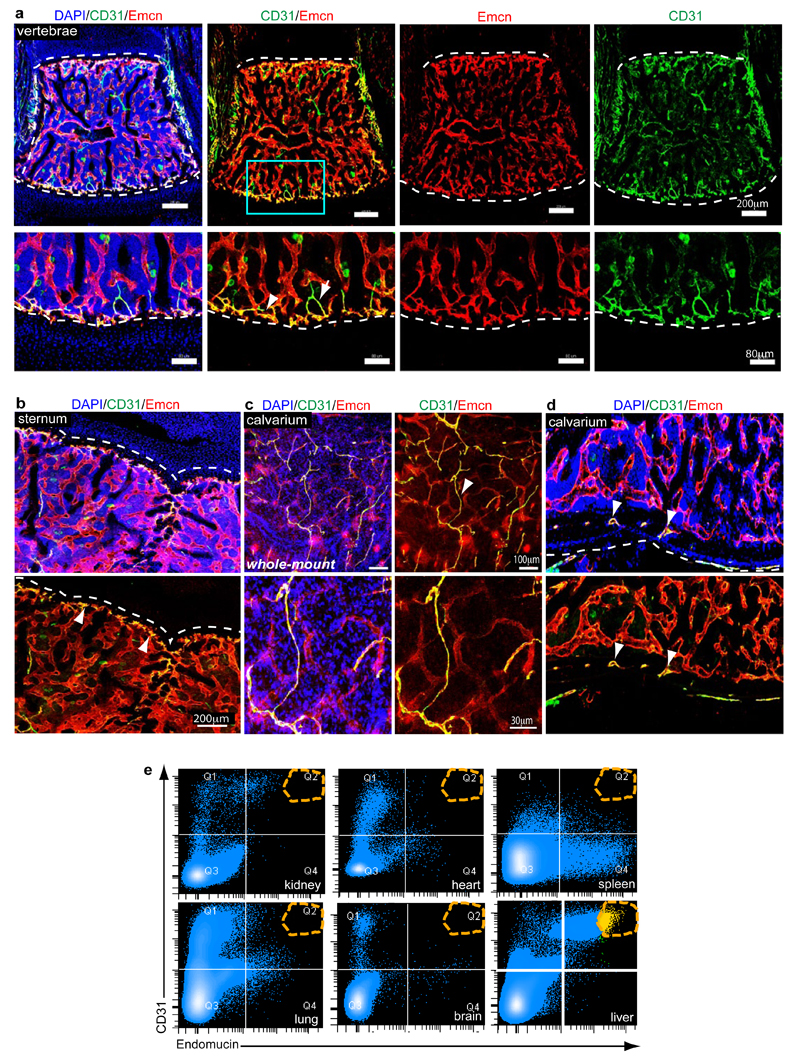
The observations above established the existence of spatial and phenotypic heterogeneity in the endothelium of long bone, which also applied to other skeletal elements in mice such as vertebra, sternum and calvarium (Extended Data Fig. 5a-d). Analysis of ECs from other organs showed that they all, with the exception of liver, lacked a CD31hi/Emcnhi subset (Extended Data Fig. 5e). On the basis of these findings, we propose the following terminology for bone microvessels: type H for the small CD31hi/Emcnhi subset and type L for the CD31lo/Emcnlo sinusoidal vessels.
Type H endothelium and osteoprogenitor cells
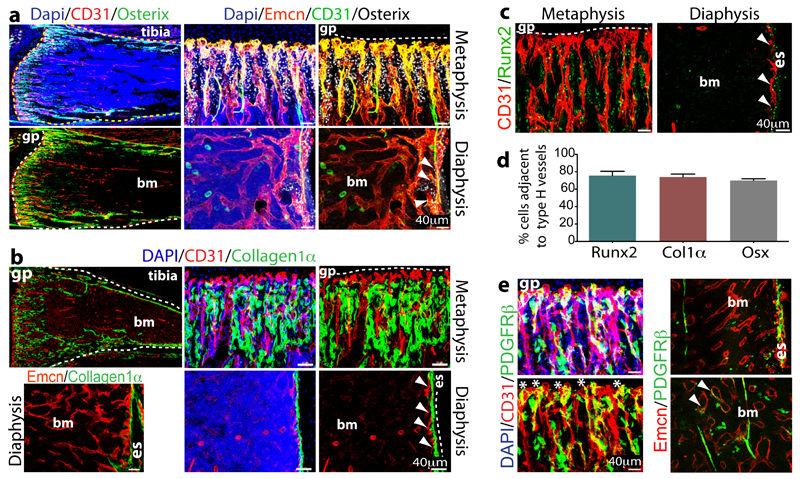
Immunostaining showed that Osterix+ osteoprogenitors, which will give rise to osteoblasts and osteocytes27, were selectively positioned around type H but not type L endothelium (Fig. 2a). Likewise, collagen type 1 α+ osteoblastic cells and Runx2+ early osteoprogenitors were abundant around the CD31+ columns in the metaphysis and CD31+ endosteal vessels, but virtually absent from the vicinity of diaphyseal type L vessels (Fig. 2b, c). Despite the low frequency (~1.77%) of type H ECs in the bone endothelial cell fraction and ~0.015% in total bone marrow (Fig. 1g), the majority of Runx2+ (82.63±1.8%), collagen 1α+ (74±3.3%) and Osterix+ cells (70±1.9%) were located directly adjacent to CD31hi/Emcnhi vessels (Fig. 2d). Mesenchymal cells expressing platelet-derived growth factor receptor β (PDGFRβ) were also preferentially associated with type H vessels in metaphysis and endosteum (Fig. 2e).
Figure 2.
Osteoprogenitor association with type H ECs.
a. Confocal images of 4 week-old tibia with indicated stainings. Growth plate (gp) and bone marrow cavity (bm) are marked. Osterix+ cells are found around CD31hi/Emcnhi vessels in metaphysis and endosteum (arrowheads)
b, Collagen1α+ cells (green) surround columnar CD31+ vessels (red) but not CD31-Emcn+ type L bone marrow (bm) sinusoids in 3 week-old mouse tibia.
c, Immunostained 4 week-old tibia showing association of Runx2+ osteoprogenitors (green) with CD31+ (red) vessels in metaphysis and endosteum (es). Minimum exposure was used to capture only cells with high CD31 fluorescence in (a-c).
d, Quantitative analysis of proximity (≤20μm) of Runx2+, Collagen1α+ (Col1α) and Osterix+ (Osx) to nearest type H vessel. Mean±s.e.m, n=5 mice from three independent experiments.
e, Maximum intensity projection of PDGFRβ+ cells (green) next to CD31+ (red) metaphyseal columns and distal arches (asterisks), and close to endosteal (es) type H ECs. PDGFRβ also marked arteries and rare cells (arrowheads) associated with Emcn+ type L bone marrow (bm) sinusoids (right).
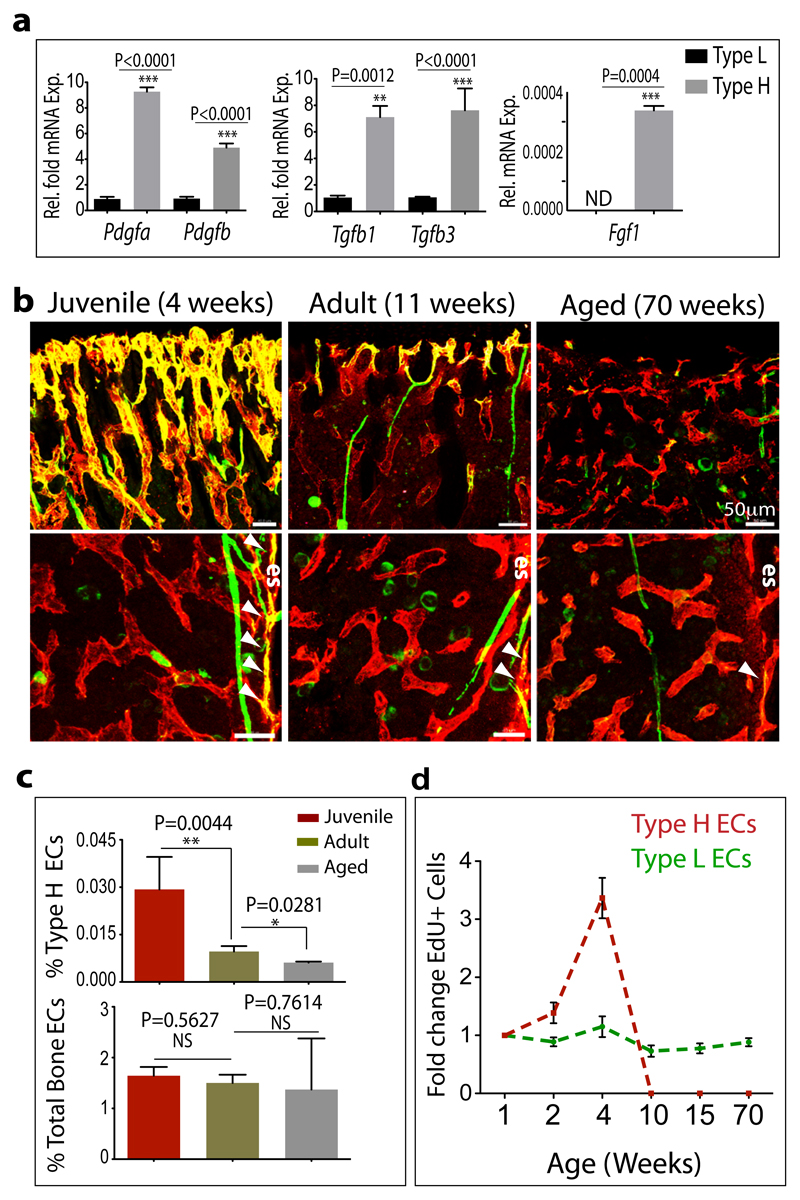
To understand this distribution pattern of osteoblastic cells, the expression of mRNAs for secreted growth factors with known roles in osteoprogenitor survival and proliferation was analysed in freshly purified ECs from long bone. Pdgfa, Pdgfb, Tgf1, Tgf3, and Fgf1 transcripts were significantly higher expressed in type H relative to type L ECs (Fig. 3a). Likewise, qPCR analysis of flushed tibiae retaining the endosteal type H ECs revealed strong enrichment of the same transcripts in comparison to extracted marrow containing type L ECs (Extended Data Fig. 6a, b). Accordingly, the two bone capillary EC subsets have specific expression profiles suggesting specialized functional properties.
Figure 3.
Properties and age-dependent decline of type H ECs.
a, qPCR analysis of growth factor expression (normalised to Actb) by CD31hi/Emcnhi ECs relative to CD31lo/Emcnlo ECs sorted from murine tibia. Data represent mean±s.e.m (n=3 biological replicates). P values, two-tailed unpaired t-test.
b, Confocal images of CD31 (green) and Emcn (red) immunostained tibia sections at 4, 11 and 70 weeks. Note age-dependent decline of CD31hi/Emcnhi ECs in metaphysis (top row) and endosteum (es, arrowheads).
c, Flow cytometric quantitation of CD31hi/Emcnhi ECs from long bone of the indicated age group. Total ECs were not significantly changed (bottom). Data represent mean±s.e.m (n=7 mice from three independent experiments).
d, Fold change in EdU+ type H and type L EC numbers in murine tibia at indicated ages determined by flow cytometry. Data represent mean±s.e.m (n=7 mice from two independent experiments).
Loss of type H endothelium during ageing
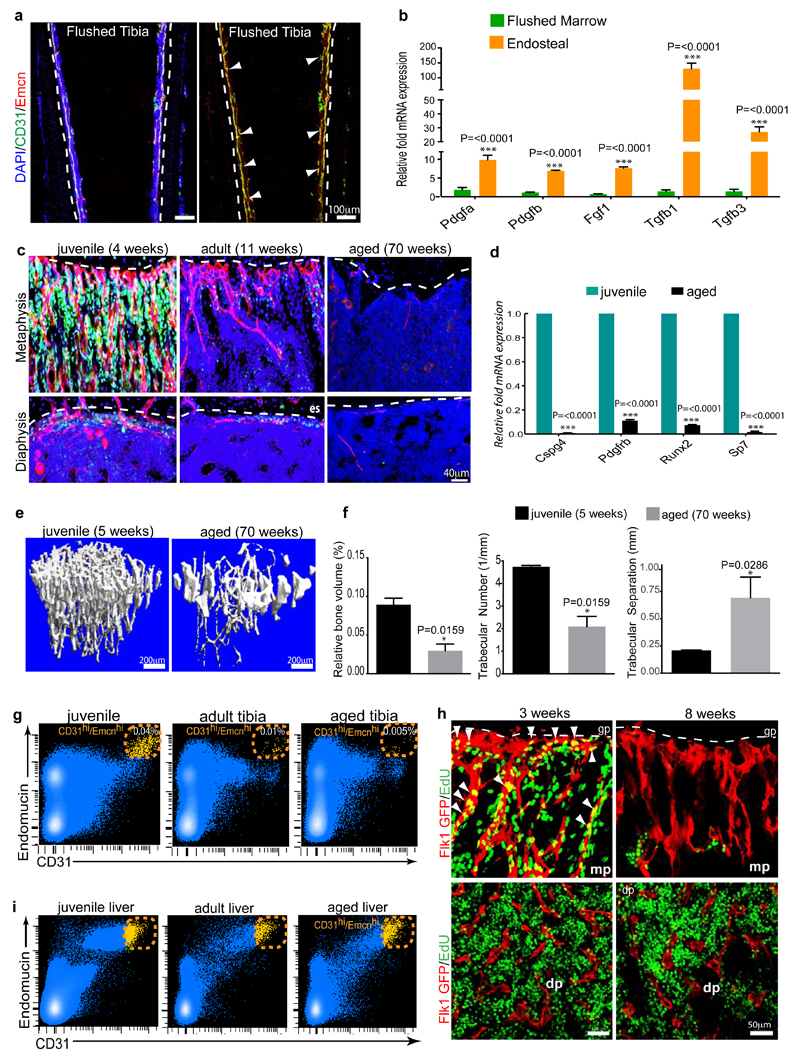
It has been previously reported that osteoblast numbers declines during aging28. Due to reduced osteogenesis, bone quality and fracture healing potential deteriorate with age, while fracture incidences become more frequent29. A remarkable decline in osteoprogenitors was seen in long bone of ageing mice, which was accompanied by a significant decrease of transcripts for mesenchymal cell and osteoprogenitor markers, and the loss of bone mass (Extended Data Fig. 6c-f). These changes correlated with pronounced reduction of type H vessels, which were much more abundant in juvenile (4 week-old) mice compared to (11 week-old) adults, and were nearly absent in aged (70 week-old) animals (Fig. 3b; Extended Data Fig. 6c). Flow cytometry analysis confirmed this age-dependent reduction of CD31hi/Emcnhi ECs, whereas the total EC number in bone did not change significantly (Fig. 3c; Extended Data Fig. 6g). EC proliferation was high within the type H subpopulation in juvenile mice and declined rapidly in adulthood (Fig. 3d; Extended Data Fig. 6h). In contrast, the rate of type L EC proliferation did not differ significantly between juvenile and older animals (Fig. 4d). While flow cytometry had suggested the potential existence of a liver CD31hi/Emcnhi EC subpopulation, these cells did not decline in adult and aged mice (Extended Data Fig. 6i).
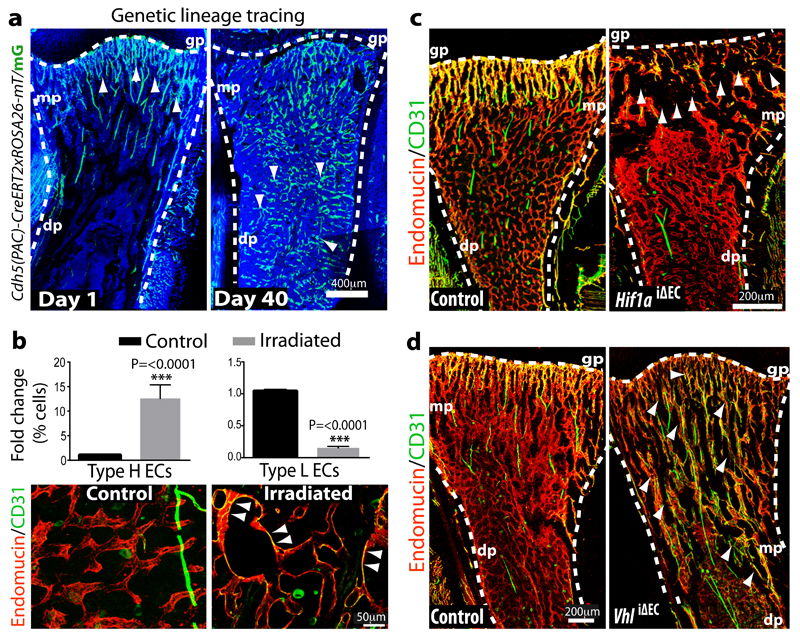
Figure 4.
Type H ECs mediate bone vessel growth.
a, Maximum intensity projection showing restricted GFP labelling (green) of arteries and CD31hi/Emcnhi vessels in 4 week-old Cdh5(PAC)-CreERT2 x ROSA26-mT/mG tibia at day 1 after tamoxifen administration (left). At day 40, GFP+ ECs were found throughout the metaphysis (mp) and diaphysis (dp, arrowheads). Nuclei, DAPI (blue).
b, Quantitation of type H and type L ECs in long bone at day 7 after sublethal irradiation. Data represent mean±s.e.m (n=16 mice, two independent experiments). P values, two-tailed unpaired t-test.
Bottom panels show representative images of control and irradiated diaphysis. CD31hi/Emcnhi ECs (arrowheads) were found throughout the diaphysis after irradiation.
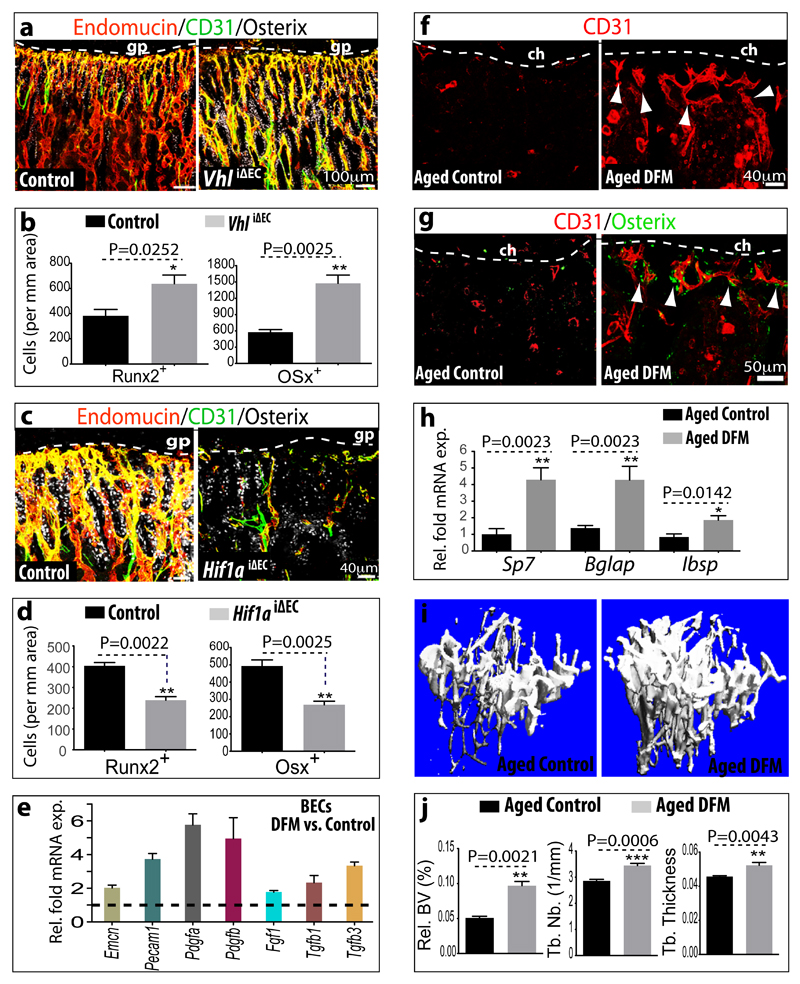
c, d, Maximum intensity projections of immunostained, 3 week-old Hif1aiΔEC (c) or VhliΔEC tibiae (d) with littermate controls. Note reduction of CD31hi/Emcnhi ECs (arrowheads) in Hif1aiΔEC metaphysis (mp) and expansion in VhliΔEC samples. Growth plate, gp; Diaphysis, dp.
Type H endothelium mediates neo-angiogenesis in bone
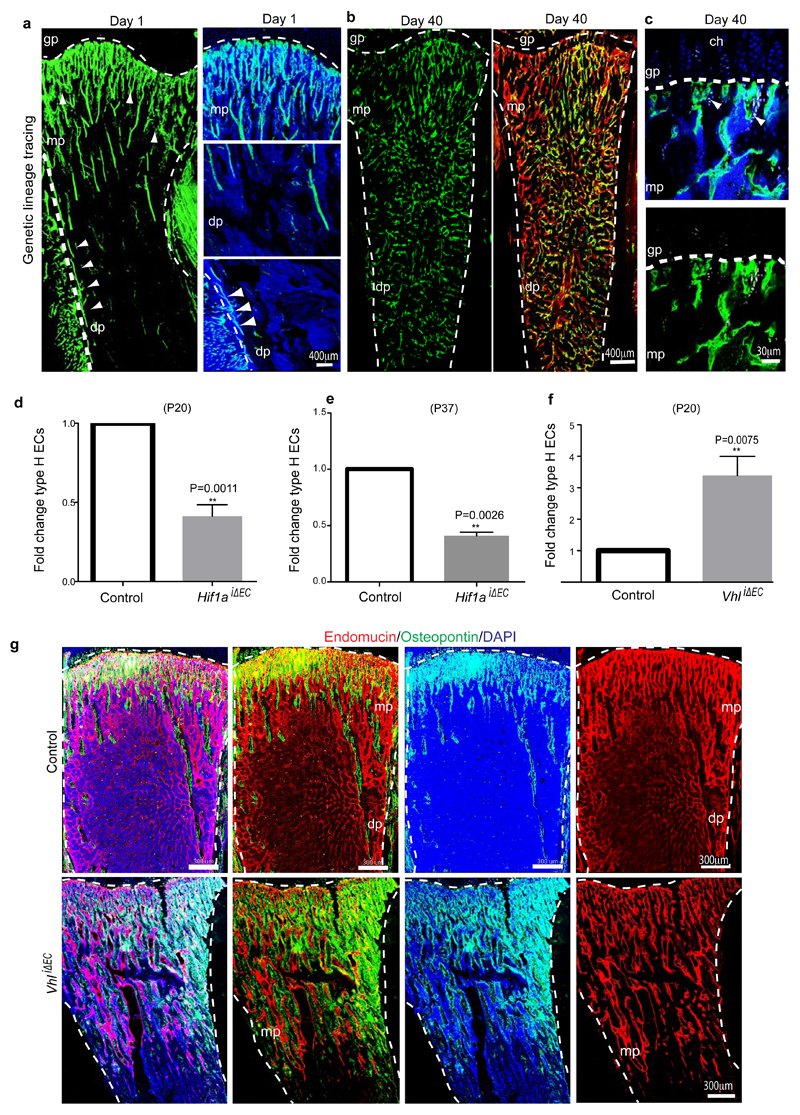
Genetic lineage tracing is a powerful approach for the investigation of cell amplification, differentiation and migration processes30,31. Single injection of 4 week-old Cdh5(PAC)-CreERT2 x ROSA26-mT/mG double transgenics with a low dose of tamoxifen (see Methods) led to selective green fluorescent protein (GFP) expression in metaphyseal and endosteal type H ECs as well as the endothelium of CD31+ arteries (Fig. 4a; Extended Data Fig. 7a). The analysis of mice at day 40 after tamoxifen administration (at 9.7 weeks of age) revealed profound expansion of the GFP-positive ECs, which were abundant throughout the metaphysis and diaphysis (Fig. 4a; Extended Data Fig. 7b, c). As the latter contains CD31lo/Emcnlo vessels, this finding established that type H ECs can give rise to type L endothelium. This, together with their high proliferative capacity, suggested that type H ECs are hierarchically upstream of the majority of the bone sinusoidal (type L) endothelium. Given the robust labelling of Cdh5(PAC)-CreERT2 x ROSA26-mT/mG double transgenic arteries in this fate mapping approach, we cannot resolve whether type H ECs give rise to arteries in postnatal bone. Arterial ECs show low proliferative activity32,33 arguing against a significant contribution of arterial GFP+ cells to type L capillaries.
Exposure to irradiation is known to induce regression of sinusoidal endothelium, and a transient but substantial decline in EC number16. Flow cytometric quantification at 7 days post irradiation showed a significant increase in type H EC and strong reduction of the type L subpopulation (Fig. 4b). Likewise, immunostaining of tibia sections showed the presence of CD31hi/Emcnhi ECs throughout the diaphysis (Fig. 4b). These findings argue for a role of CD31hi/Emcnhi vessels in developmental and regenerative neo-angiogenesis in bone.
Regulation of angiogenesis and osteogenesis by endothelial HIF
HIF-1α controls physiological and pathological neo-angiogenesis34. In addition to its role in the up-regulation of VEGF-A expression in hypoxic tissues, HIF-1α activity in ECs is important for wound healing and tumour angiogenesis in mice35. To investigate HIF-1α function in the postnatal bone endothelium, inducible EC-specific loss-of-function mice (Hif1aiΔEC) were generated by combining loxP-flanked Hif1a alleles (Hif1alox/lox)35 and Cdh5(PAC)-CreERT2 transgenics. Following tamoxifen administration from postnatal day (P) 10 to P14, analysis of Hif1aiΔEC mutants at P20 revealed striking vascular defects. While type H endothelium was strongly reduced in metaphysis and endosteum, the number of diaphyseal type L vessels and ECs was comparable to control littermates (Fig. 4c; Extended Data Fig. 7d, e).
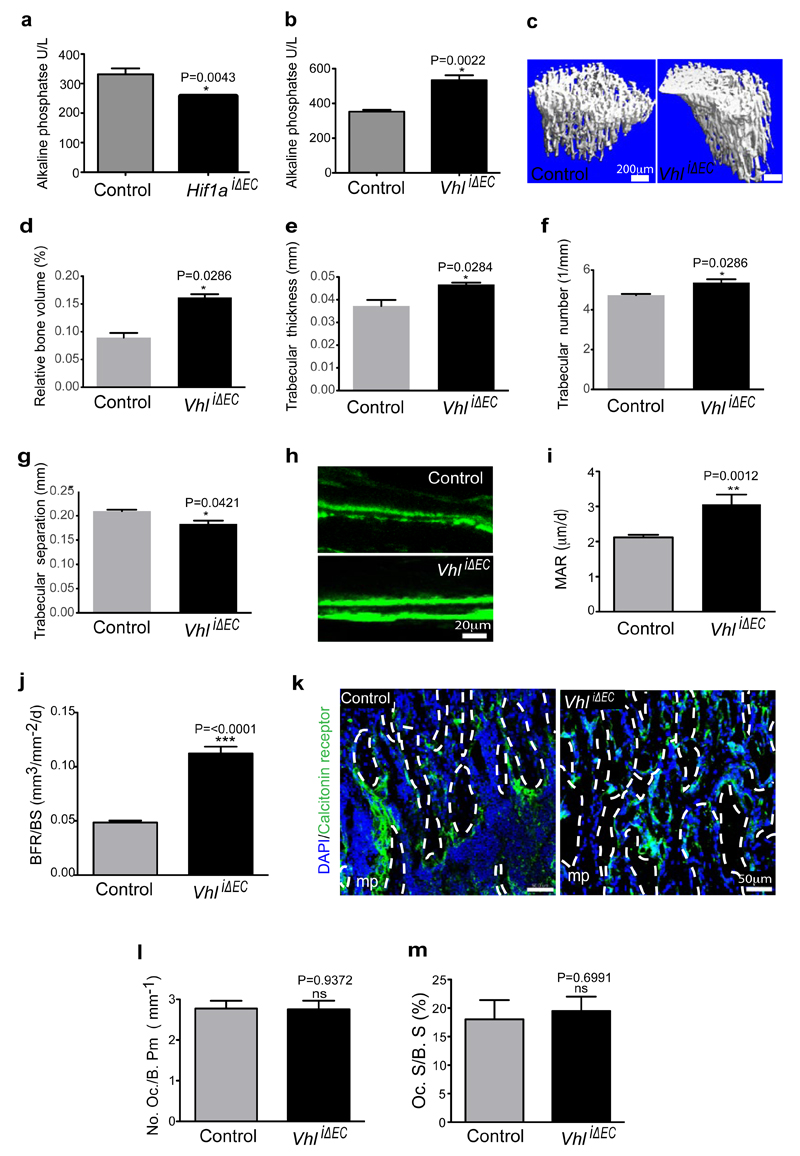
The von Hippel-Lindau (VHL) E3 ubiquitin protein ligase controls the stability and thereby biological activity of HIF-1α and other substrates36. Inducible, EC-specific targeting of the murine Vhl gene with the same strategy as described above for Hif1a led to pronounced expansion of type H endothelium and metaphyseal vessel columns (Fig. 4d; Extended Data Fig. 7f). These changes were accompanied by expansion of the metaphysis, increased formation of trabecular bone, and higher numbers of Runx2+ and Osterix+ osteoprogenitors in VhliΔEC mutants (Fig. 5a, b; Extended Data Fig. 7g). Osteoprogenitors were significantly reduced in Hif1aiΔEC samples (Fig. 5c, d). Likewise, blood alkaline phosphatase levels (a biomarker for osteogenesis) were elevated in VhliΔEC mutants and reduced in Hif1aiΔEC animals (Extended Data Fig. 8a, b). Histological analysis and μ-CT confirmed increased bone mass in VhliΔEC mutants without overtly changed calcitonin receptor-positive osteoclasts (Extended Data Fig. 8c-m). Parathyroid hormone and calcitonin, hormones that regulate bone remodelling, and serum calcium and phosphate levels were not significantly changed in Hif1aiΔEC or VhliΔEC mutants (data not shown).
Figure 5.
Type H ECs couple angiogenesis and osteogenesis.
a, Confocal images of CD31 (green), Endomucin (red) and Osterix (white) immunostained, 3 week-old VhliΔEC and control tibiae.
b, Quantitation of Runx2+ and Osterix+ (Osx) cells in VhliΔEC mutants and controls. Data represent mean±s.e.m (n=5 mice in two independent experiments. P values, twotailed unpaired t-test.
c, Maximum intensity projections of 3 week-old Hif1aiΔEC and control tibia stained for CD31 (green), Endomucin (red) and Osterix (white). Growth plate, gp.
d, Quantitation of Runx2+ and Osterix+ cells in Hif1aiΔEC mutant and control long bone. Data represent mean±s.e.m (n=5 mice in three independent experiments). P values, two-tailed unpaired t-test.
e, qPCR mRNA analysis of DFM or vehicle-treated bone endothelial cells (BECs). Data represent mean±s.e.m (n=3 biological replicates). Note induction of growth factor expression by DFM.
f, g, Representative images of CD31 (red, f, g) and Osterix (green, g) stained tibia sections from aged DFM-treated and control mice. Low intensity projection shows only CD31hi cells. DFM induces CD31hi vessels and Osterix+ osteoprogenitors. Chondrocytes, ch.
h, qPCR analysis of Sp7 (encoding Osterix), Bglap (bone gamma-carboxyglutamate protein) and Ibsp (integrin-binding sialoprotein) mRNA expression relative to Actb in the aged DFM-treated or vehicle control femur. Data represent mean±s.e.m (n=6-8 mice in four independent experiments). P values, two-tailed unpaired t-test.
i, Representative μ-CT images of aged DFM-treated and control tibiae.
j, Quantitative μ-CT analysis of relative bone volume (Rel. BV), trabecular number (Tb. Nb), and trabecular thickness (Tb. Thickness) in proximal tibia. Data represent mean±s.e.m (n=5 mice in two independent experiments). P values, two-tailed unpaired t-test.
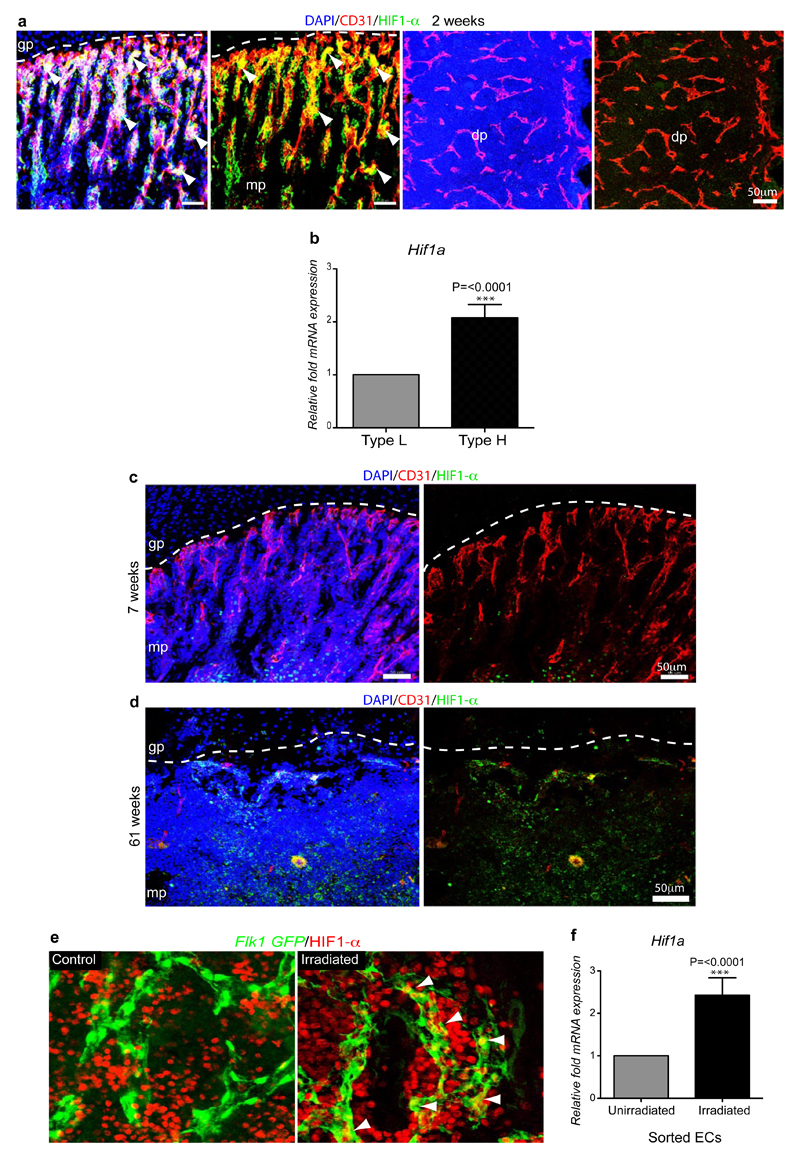
To understand why EC-specific deletion of Hif1a or Vhl primarily affected type H vessels, we analysed HIF-1α expression in 2 week-old bone, which corresponds to the stage of tamoxifen administration. Strong HIF-1α immunostaining was seen in type H but not type L endothelium (Extended Data Fig. 9a). Furthermore, analysis of freshly isolated type H cells contained significantly higher Hif1a transcript levels than type L ECs (Extended Data Fig. 9b). Transcripts encoding HIF-1β, which heterodimerises with HIF-1α, were not significantly different (data not shown). In EC of adult and ageing animals, Hif1a mRNA was slightly reduced (0.5-fold) but HIF-1α protein was no longer detectable in ECs (Extended Data Fig. 9c, d), which correlated with the age-dependent loss of type H vessels. Conversely, loss of type L ECs and expansion of CD31hi/Emcnhi endothelium after irradiation (Fig. 4b) was accompanied by increased HIF-1α expression at both protein and transcript levels (Extended Data Fig. 9e, f). These findings supported a key role of HIF-1α in the induction of type H ECs.
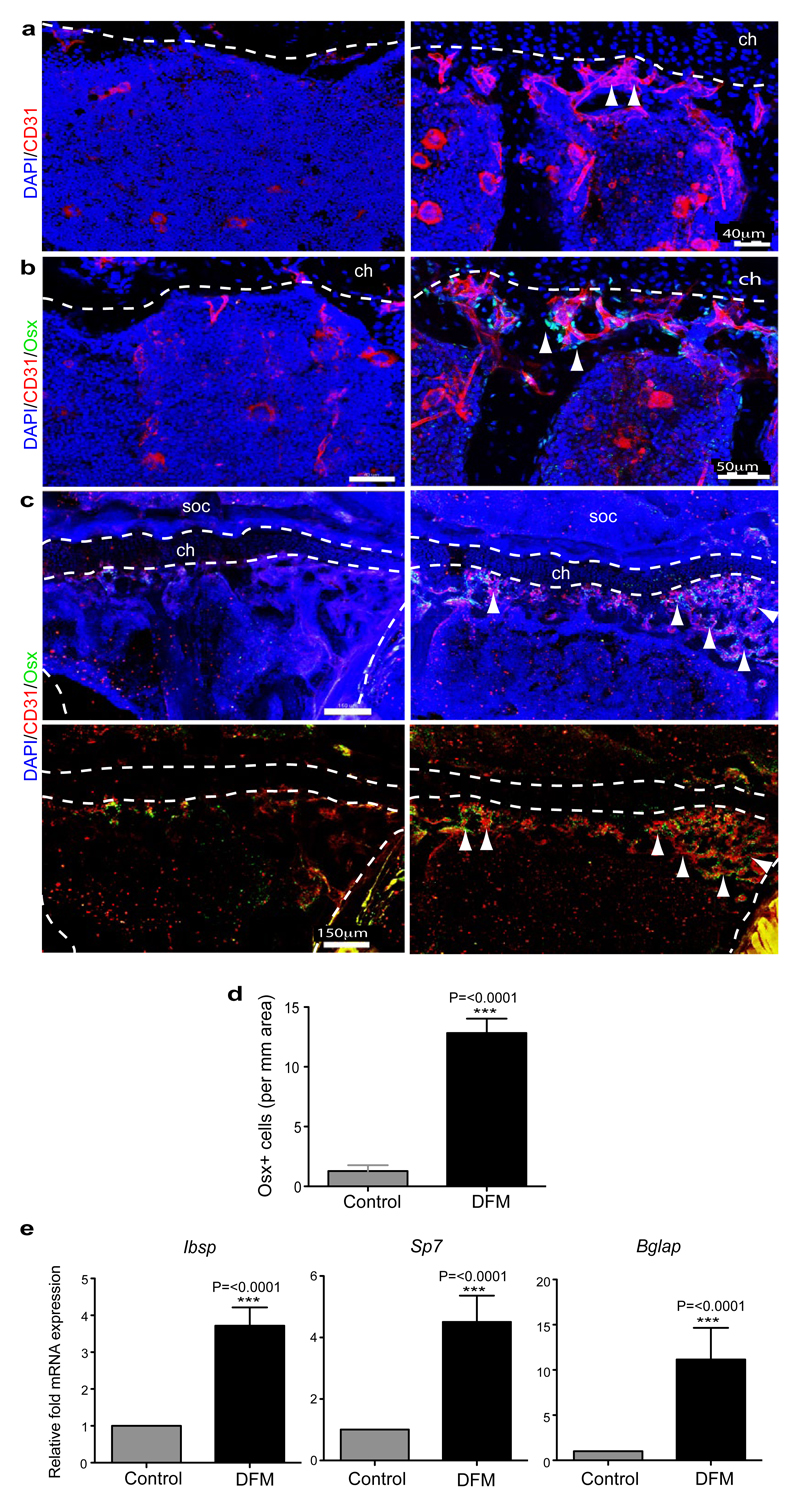
Prolyl-4-hydroxylases (PHDs) modify HIF-1α and thereby mark the protein for degradation under normoxic conditions. Accordingly, PHD inhibitors, such as deferoxamine mesylate (DFM), enhance HIF-1α stability and activity37. Treatment of isolated primary bone ECs with DFM led to up-regulation of Pecam1/CD31 and Emcn transcripts, but also increased the expression of growth factor mRNAs that were also enriched in freshly isolated CD31hi/Emcnhi ECs (Fig. 5e). Next, we tested whether DFM promotes CD31hi/Emcnhi ECs, neo-angiogenesis and osteogenesis in aged animals. While long bones of aged, 64 to 70 week-old mice treated with vehicle control contained very few CD31hi/Emcnhi vessels, DFM administration (see Methods) led to substantial expansion of type H endothelium (Fig. 5f; Extended Data Fig. 10a) and emergence of vessel-associated Osterix+ cells (Fig. 5g; Extended Data Fig. 10b-d). Expression levels of osteoprogenitors and osteoblasts markers were significantly increased in long bone and calvarium of DFM-treated animals (Fig. 5h; Extended Data Fig.10e). Furthermore, μ-CT examination showed that 6 weeks of DFM treatment led to significantly increased bone mass (Fig. 5i, j). While the activity of DFM is not restricted to ECs and is likely to affect multiple cell populations, the findings above argue for crucial roles of endothelial HIF in controlling bone angiogenesis, type H vessel abundance, endothelial growth factor expression, and osteogenesis.
Discussion
The mammalian skeleton sustains stem and progenitor cell populations allowing lifelong hematopoiesis and osteogenesis38,39. These processes rely on niche microenvironments, for which a number of critical cell types and molecular factors have been identified40,41 In the case of bone formation, mesenchymal stem cells generate new osteoblasts and their progenitors, which are essential for bone homeostasis and fracture healing42,43. Blood vessel growth and the invasion of osteoprogenitors appear coupled in bone fractures8 but the communication between endothelial and osteoblastic cells remains little understood. Likewise, the exact architecture of the bone vasculature or the processes mediating its growth had remained unknown. Some of these key questions are now resolved in this manuscript. The finding that capillaries in the skeletal system of mice can be subdivided into type H and type L endothelium on the basis of morphological, molecular and functional criteria should be hugely beneficial for future studies in basic and medical research. CD31hi/Emcnhi capillaries at the distal end of the arterial network in bone might represent the central building block of a metabolically specialised tissue environment with privileged access to oxygen and nutrients, which is likely to influence the growth potential and metabolism of other cell types. This is not only relevant for osteoblastic cells but potentially also for hematopoietic stem and progenitor cells, which preferentially home to the metaphysis after transplantation44. However, there is also evidence that the bulk of hematopoietic stem cells are exposed to low oxygen, whereas committed and differentiating hematopoietic progenitors reside in relatively well-oxygenated environments45. The latter is consistent with our recent description of the hemosphere, a specialised microenvironment found in the mouse metaphysis that enables the clonal expansion of hematopoietic cells46.
We also propose that type H ECs mediate local growth of the vasculature and provide niche signals for perivascular osteoprogenitors. Type H vessel formation and the expression of potential angiocrine factors for osteoblastic cells are enhanced by HIF and, as we show in the accompanying manuscript47, by Notch signalling. Thus, the abundance of CD31hi/Emcnhi ECs may be useful as diagnostic readout for the growth status of the bone vasculature and its pro-osteogenic capacity. Our results also indicate that specific molecular pathways can be used to boost type H vessel formation and osteogenesis (Extended Data Fig. 1b). This might be of great importance for conditions involving compromised fracture healing or loss of bone mass. Ageing and postmenopausal estrogen deficiency are major risk factors for osteoporosis48, and estrogen can promote angiogenesis49. Accordingly, decline of type H vessels and the concomitant reduction of osteoprogenitor cells could potentially offer a compelling explanation for the loss of bone mass during ageing and might enable therapeutic improvement of osteogenesis in elderly people.
Methods Summary
Genetically modified and aged mice
C57BL/6J males were used for experiments at the age of 2-4 weeks (juvenile), 8-12 weeks (adult) and 57-70 weeks (aged). EC-specific gene deletions were generated using Cdh5(PAC)-CreERT2 transgenic mice, which were interbred with conditional mutants carrying loxP-flanked Hifa35 (Hif1alox/lox). To induce Cre activity and gene inactivation, pups were injected with 500μg tamoxifen (Sigma, T5648) intraperitoneally everyday from P10 to P14. Femurs and tibiae from Cdh5(PAC)-CreERT2T/+ Hif1alox/lox (Hif1aiΔEC) mutants and Cre-negative (Hif1alox/lox) controls were collected on P20 or P37 after euthanasia. The same approach was used for experiments involving conditional Vhl mice50. For genetic labelling of metaphyseal vasculature, Cdh5(PAC)-CreERT2T/+ mice were mated with R26-mG/mT reporters. At P29, Cdh5(PAC)-CreERT2T/+/R26-mG/mTT/+ mice received a single dose of 50μg tamoxifen and were analysed either 1 or 40 days later.
All animals were genotyped by PCR. Protocols and primer sequences are provided upon request. When indicated, adult wild-type mice were whole-body irradiated with a single dose of 900 rads (Gammacell irradiator) and sacrificed 7 days later.
For DFM treatment, freshly prepared deferoxamine mesylate (Sigma) in water (15 mg/ml per mouse) was injected intraperitoneally every alternate day for 4 weeks or, for μ-CT analysis, 5 weeks. Control animals received the same amount of sterile water.
For labelling of proliferating cells, mice were intraperitoneally injected with 1.6 mg/kg weight of EdU (Invitrogen) 2 hr before euthanasia. Tibiae were immediately collected and processed. Bone marrow cells and bone sections were stained for EDU using Click-iT chemistry following the manufacturer’s instructions (Invitrogen).
Experiments involving animals were performed according to the institutional guidelines and laws, following protocols approved by local animal ethics committees.
Methods
Bone immunohistochemistry
Freshly dissected bone tissues collected from wild-type mice or from mutants and their control littermates were immediately fixed in ice-cold 4% paraformaldehyde solution for 4 hr. Decalcification was carried out with 0.5M EDTA at 4°C with constant shaking and decalcified bones were immersed into 20% sucrose and 2% polyvinylpyrrolidone (PVP) solution for 24 hr. Finally, the tissues were embedded and frozen in 8% gelatin (porcine) in presence of 20% sucrose and 2% PVP. For immunofluorescent stainings and morphological analyses, sections were generated using low-profile blades on a Leica CM3050 cryostat.
For phenotypic analysis, mutant and littermate control samples were always processed, sectioned, stained, imaged and analysed together at the same conditions and settings. For immunostaining, bone sections were air-dried, permeabilised for 10 min in 0.3% Triton X-100, blocked in 5% donkey serum at room temperature for 30 min, and probed with the primary antibodies diluted in 5% donkey serum in PBS for 2 hr at room temperature (RT) or overnight at 4°C.
The following primary antibodies were used: Endomucin (sc-65495, Santa Cruz, diluted 1:100), Pecam1 conjugated to Alexa Fluor 488 (FAB3628G, R&D Systems, 1:100), Pecam1 (553370, BD Pharmingen, 1:100), Osterix (sc-22536-R, Santa Cruz, 1:200), Runx2 (MAB2006, R&D Systems, 1:200), α-SMA-Cy3 (C6198, Sigma, 1:100), Hif1-α (ab65979, Abcam, 1:100), Collagen type 1 (AB675P; Millipore, 1:200), Osteopontin (AF808, R&D Systems, 1:200), Mct4 (sc-50329, Santa Cruz, diluted 1:100), Glut1 (07-1401, Millipore, 1:100), phospho-p44/42 MAPK (4370, Cell Signaling, 1:75), Calcitonin receptor (ab11042, Abcam, 1:75), Biotin-conjugated CD45 (553077, Becton Dickinson, 1:100), and Hif1-α (ab65979, Abcam, 1:100). After primary antibody incubation, sections were washed with PBS for three times and incubated with appropriate Alexa Fluor-coupled secondary antibodies (1:400, Molecular Probes) for 1 hr at RT. Nuclei were counterstained with DAPI. Sections were thoroughly washed with PBS before mounting them using FluoroMount-G (Southern Biotech). Finally, cover slips were sealed with nail polish.
For metabolic labelling with the hypoxia probe pimonidazole (Pimo, Hypoxyprobe Inc.), mutant and control mice were intraperitoneally injected with 60 mg/kg Pimo for 2 hr before euthanasia. Metabolized Pimo was detected by a rabbit antiserum against the non-oxidized, protein-conjugated form of pimonidazole (Hypoxyprobe Inc.).
Image acquisition and quantitative analysis
Immunofluorescent stainings were analysed at high resolution with a Zeiss laser scanning confocal microscope, LSM-780. Z-stacks of images were processed and 3D-reconstructed with Imaris software (version 7.00, Bitplane). Imaris, Photoshop and Illustrator (Adobe) software was used for image processing in compliance with Nature’s guide for digital images. All quantifications were done with ImageJ, Imaris and Volocity software on high-resolution confocal images.
Statistical analysis
All data are presented as mean ± s.e.m. The significance of difference in the mean values was determined using two-tailed Student's t test unless indicated otherwise. P < 0.05 was considered significant. All statistical analysis were performed using Graphpad Prism software. No randomization or blinding was used and no animals were excluded from analysis. Sample sizes were selected on the basis of previous experiments. Several independent experiments were performed to guarantee reproducibility of findings.
Culture of endothelial cells from bone
Tibiae and femurs from wild-type mice or mice expressing endothelial specific reporters (i.e., Flk1-GFP51 and Cdh5(PAC)-CreERT2T/+/R26-mG/mT d/+) were collected in sterile Ca2+ and Mg2+ free PBS, crushed with mortar and pestle, and digested with Collagenase A (Sigma) to obtain a single cell suspension. ECs were then MACS sorted using Endomucin antibody (cat. no. SC-65495) and Dynabeads sheep anti-Rat IgG (Invitrogen). Sorted ECs were then plated on dishes coated with fibronectin and cultured in endothelial cell growth medium (EBM-2, Clonetics; Lonza) supplemented with EGM-2 SingleQuots (CC-4176, Clonetic; Lonza). At first passage, cells were again MACS sorted with Endomucin antibody and plated for culture. Cells were fed every third day and passaged upon confluency. Cultures were maintained at 37°C with 5% CO2 in a humidified atmosphere. For DFM treatment and subsequent qPCR analysis, EC cultures between passage 2 and 5 were used. Cells were treated with DFM (6.25 mg/ml of culture medium) for the duration of 7 hrs and subsequently lysed in lysis buffer of RNeasy Mini Kit (QIAGEN) for qPCR analysis.
Quantitative RT-PCR
For the analysis of mRNA expression levels in type H or type L endothelium, CD31hi/Emcnhi and CD31lo/Emcnlo cells were sorted by FACS directly into the lysis buffer of the RNeasy Mini Kit (QIAGEN). Total RNA was isolated according to manufacturer’s protocol. A total of 100 ng RNA per reaction was used to generate cDNA with the iScript cDNA Synthesis System (Bio-Rad). Quantitative PCR (qPCR) was performed using TaqMan gene expression assays on ABI PRISM 7900HT Sequence Detection System. The FAM-conjugated TaqMan probes Tgfb1, Tgfb3, Fgf1, Pdgfa, and Pdgfb were used along with TaqMan Gene Expression Master Mix (Applied Biosystems). Gene expression assays were normalized to endogenous VIC-conjugated Actb probes as standard. For analysis of mRNA expression levels from whole bones, dissected femurs were immediately crushed finely, digested with collagenase, centrifuged to obtain a pellet, which was then lysed into lysis buffer of RNeasy Mini Kit (QIAGEN). A total of 500 ng RNA per reaction was used to generate cDNA with the iScript cDNA Synthesis System (Bio-Rad), which was further processed as described above. FAM-conjugated TaqMan probes Ibsp, Bglap, Sp7, Cspg4, Pdgfrb, Runx2, and Sp7 were used along with TaqMan Gene Expression Master Mix (Applied Biosystems) to perform qPCR. For the mRNA expression analysis of flushed bone and bone collar/endosteum, FAM-conjugated TaqMan probes Tgfb1, Tgfb3, Fgf1, Pdgfa, and Pdgfb were used. Gene expression was normalized to the endogenous VIC-conjugated Actb probes.
Flow cytometry
For flow cytometric analysis and sorting of type H and type L ECs, tibiae and femurs were collected, cleaned thoroughly to remove the adherent muscles. The epiphysis was removed and only the metaphysis and diaphysis regions were processed. Tibias were then crushed in ice cold PBS with mortar and pestle. Whole bone marrow was digested with collagenase incubation at 37°C for 20 min. Equal number of cells were then subjected to immunostaining with endomucin antibody (Santa cruz, sc-65495) for 45 min. After washing, cells were stained with APC-conjugated CD31 antibody (R&D Systems, FAB3628A) for 45 min. After washing, cells were acquired on BD FACS Canto flow cytometer and analysed using BD FACSDiva software (Version 6.0, BD Bioscience). Cell sorting was performed with FACS Aria II.
For demarcating and sorting CD31hi/Emcnhi ECs, first standard quadrant gates were set, subsequently to differentiate CD31hi/Emcnhi cells from the total double positive cells in quadrant 2 gates were arbitrarily set at >104 log Fl-4 (CD31-APC) fluorescence and >104 log Fl-2 (Endomucin-PE) fluorescence.
For the analysis of total ECs in bone, tibiae were processed as described above to obtain single cell suspensions, which were stained with biotin-coupled CD45 (BD, 553077) or Ter119 (BD, 559971) antibodies for 45min. After washing in PBS, cells stained with Streptavidin PE-Cy5 (BD, 554062) and Alexa Fluor488-conjugated CD31 (R&D Systems, FAB3628G) antibodies for 45 min. After washing, cells were acquired on a FACS Canto flow cytometer and analysed using FACSDiva software (Version 6.0, BD Bioscience). Total bone ECs were quantified as CD31+/CD45-/Ter119-. Endomucin was used to distinguish Emcn-negative arterial ECs from Emcn+ sinusoidal and venous cells.
Micro-CT analysis and histomorphometry
Tibiae were collected, and the attached soft tissue was removed thoroughly and fixed in 4% paraformaldehyde. The fixed tibiae were analyzed using micro-CT (μCT 35) and software IPL V5.15 at Scanco Medical AG, Switzerland. A voxel size of 12μm was chosen in all three spatial dimensions. For each sample, 148 from 232 slices were evaluated covering a total of 1.776mm at a voltage of 70kVp, intensity 114μA, integration time 1200ms.
For calcein double labelling, mice were given intraperitoneal injections of 10mg/kg calcein (Sigma, C0875) dissolved in 2% sodium bicarbonate solution at day 10 and day 3 before euthanasia. Undecalcified bones were fixed in 4% PFA, embedded in 8% gelatin and 2% PVP and cryosectioned. Sections were stained with von Kossa method to assess mineralized bone
Osteoclast surface/bone surface (Oc. S/BS; %) and osteoclast number/bone perimeter (No. Oc./B. Pm) were calculated based on Calcitonin receptor staining of bone sections.
Supplementary Material
Supplementary Information is linked to the online version of the paper at www.nature.com/nature.
Extended Data
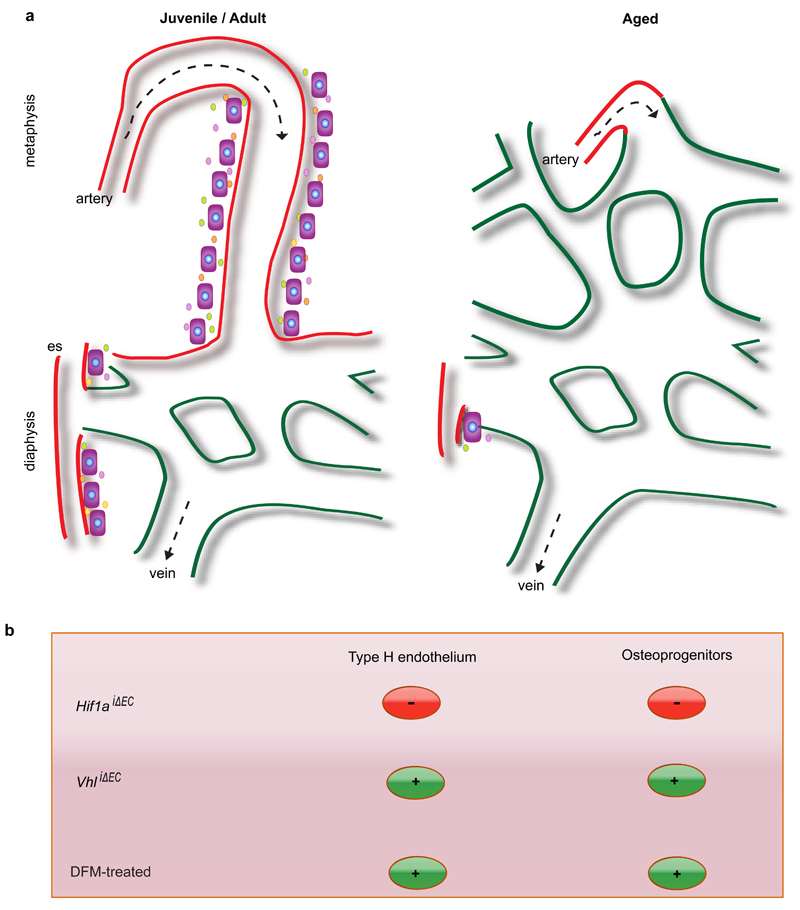
Extended Data Figure 1. Schematic representation of key findings.
a, Type H vasculature (red) in the metaphysis (mp) and endosteum (es) represents a functionally specialised vessel subtype that mediates vessel growth and promotes osteogenesis. The later is presumably mediated by angiocrine growth factors (small circles). In aged animals (right), the number of types H vessels and associated osteoprogenitors (OPs) is strongly reduced so that bone mainly contains type L, sinusoidal vessels characteristic for the diaphyseal (dp) marrow cavity. Arrows indicate the incoming arterial flow and venous drainage.
b, Regulation of type H endothelium by hypoxia-inducible factor. EC-specific gene inactivation of HIF-1α led to pronounced reduction of type H ECs and osteoprogenitors, whereas the opposite effect was obtained by disrupting endothelial VHL expression. Type H ECs, associated osteoprogenitor cells and bone formation were stimulated by DFM in aged mice.
Extended Data Figure 2. Regional differences in metabolic marker expression.
a, Tile scan confocal images showing maximum intensity surface projection of Emcn (red) immunostaining on tibial bone section. Nuclei in left image are stained with DAPI (blue). Arrowheads mark the exit of the vein through the cortical bone (cb). Indicated are growth plate (gp), diaphysis (dp) and secondary ossification centre (soc).
b, Schematic representation of proximal tibial bone indicating localization of different regions: secondary ossification centre (soc), growth plate (gp), metaphysis (mp), diaphysis (dp), endosteum (es).
c, Representative confocal images showing pimonidazole (green) staining on a tibial section from a 5 week-old mouse. Nuclei, DAPI (blue); ECs, Endomucin (red, Emcn). Note abundance of pimonidazole staining thoughout the diaphysis (dp) but not in the metaphyseal (mp) region. Dashed lines indicate the borders of cortical bone and growth plate (gp).
d, e, Maximum intensity projections of pimonidazole (green) stained 8-week old tibia. Nuclei, DAPI (blue); CD31 (red, d); CD45 (red, e). Green staining is seen in CD45+ hematopoietic cells in the diaphysis (dp) and on the bone surface (arrowheads). Dashed lines indicate the borders of cortical bone (cb) and growth plate (gp).
Extended Data Figure 3. Regional differences in metabolic marker expression.
a, Representative confocal images showing HIF1-α (green) and CD31 (red) immunostaining on sections of 7 week-old tibiae. Nuclei, DAPI (blue). Note abundance of HIF1α-positive nuclei in the diaphysis (dp) and secondary ossification centre (soc) but not in the metaphyseal (mp) region near the growth plate (gp). Dashed lines indicate borders of the growth plate (left and centre) or, in panels on the right, the endosteum (es).
b, Maximum intensity projections of tibial sections from 7 week-old mice showing immunostaining for the indicated markers. MCT4-positive (green) cells were absent in the metaphysis (mp) but abundant in the diaphysis (dp) and secondary ossification centre (soc).
c, Maximum intensity projections of Glut1 (green) immunostaining on sections of 7 week-old tibiae. Nuclei, DAPI (blue). Note abundance of Glut1-positive cells in the diaphysis (dp) but not in the metaphyseal (mp) region below the growth plate (gp). Dashed lines indicate borders of growth plate or endosteum (es), respectively.
d, Quantitation of HIF1-α, MCT4 and Glut1 immunostaining intensities in metaphysis and diaphysis. Data represent mean±s.e.m (n=5 mice in two independent experiments). P values, two-tailed unpaired t-test.
e, Representative tile scan confocal image showing the distribution of phospho-ERK1/2 (green) immunosignal in sections of 7 week-old tibia. Nuclei, DAPI (blue). Note prominent phospho-ERK1/2 staining of cells in the metaphysis (mp) relative to the diaphysis (dp). Dashed line indicates border of the growth plate (gp).
Extended Data Figure 4. Structural and marker heterogeneity in bone sinusoidal endothelium.
a, Representative tile scan confocal image showing maximum intensity surface projection of Endomucin (red) immunostaining of ECs in the femur of a 2 week-old mouse. Nuclei in left image are stained with DAPI (blue). Dashed lines indicate the adjacent growth plate (top), the border of the diaphysis (dp) and the morphologically distinct metaphyseal (mp) and diaphyseal (dp) vessels.
b, Tile scan confocal image showing maximum intensity surface projection of GFP+ ECs in 2 week-old Flk1-GFP transgenic tibia. Left: nuclei, DAPI (blue). Dashed lines indicate the adjacent growth plate (top) or the border of the diaphysis (dp). Dashed lines mark borders of the growth plate (top) and cortical bone (left and right) as well as the interface between column-like metaphyseal (mp) vessels and the highly branched diaphyseal (dp) vasculature.
c-e, Representative tile scan confocal images of the GFP+ (green) endothelium in Cdh5(PAC)-CreERT2 x Rosa26-mT/mG double transgenic tibiae from 2 week-old (c), 4 week-old (d), or 6 week-old (e) mice after postnatal tamoxifen administration. Nuclei, DAPI (blue). GFP signal is restricted to vessels and absent in chondrocytes of the growth plate (gp) or hematopoietic cells. GFP expression is restricted only to vasculature. Dashed lines indicate the borders of the growth plate, cortical bone and secondary ossification centre (soc).
f, Quantitative analysis of relative CD31 and Endomucin immunostaining intensities in the microvasculature of the metaphysis, diaphysis (marrow cavity) and endosteum, as indicated. Data represent mean±s.e.m (n=7 mice from seven independent experiments). P values, two-tailed unpaired t-test.
g, Mean fluorescence intensities (MFI) of CD31hi/Emcnhi and CD31lo/Emcnlo endothelial subsets as determined by flow cytometric analysis of bone marrow cells stained with CD31 and Endomucin. Data represent mean±s.e.m (n=7 mice two independent experiments). P values, two-tailed unpaired t-test.
Extended Data Figure 5. EC subsets in different skeletal elements and organs.
a-d, Representative tile scan confocal images showing CD31 (green) and Endomucin (red) immunostaining in juvenile (4 week-old) vertebra (a), sternum (b), and whole-mount (c) or sectioned (d) calvarium (parietal bone). Nuclei, DAPI (blue). Arrowheads indicate CD31hi/Emcnhi endothelium (yellow). Arrow in (a) marks an adjacent artery (green).
e, Representative dot plots showing flow cytometric analysis of CD31 and Endomucin-stained single cell suspensions from kidney, heart, spleen, lung, brain, and liver. Note absence of a CD31hi/Emcnhi EC subset (orange dashed circle in Q2) in these organs with exception of liver.
Extended Data Figure 6. Regional and age related differences in ECs and bone.
a, Confocal images showing diaphyseal region of flushed tibia immunostained for CD31 (green) and Endomucin (red). Nuclei, DAPI (blue). Note retention of type H endothelium in the endosteum after flushing.
b, Comparative qPCR analysis of marrow cell suspension flushed from the tibial diaphysis and compact bone plus endosteum (harbouring type H endothelium). Shown are expression levels of Pdgfa, Pdgfb, Fgf1, Tgfb1, and Tgfb3 mRNAs relative to mRNA for β-actin. Data represent mean±s.e.m (n=6-8 mice in two independent experiments). P values, two-tailed unpaired t-test.
c, Representative confocal images from metaphyseal and diaphyseal regions of tibias from mice of different ages immunostained for Osterix (green) and CD31 (red). Nuclei, DAPI (blue). Dashed lines mark the adjacent growth plate (metaphysis) or endosteum (es) in diaphysis. Note striking decline of CD31+ vessels and associated osteoprogenitors in ageing mice.
d, Quantitative mRNA expression analysis of Cspg4, Pdgfrb, Runx2, and SP7 relative to transcripts encoding β-actin in long bones from juvenile and aged mice. Note significant decline of all 4 markers in bone from aged mice. Data represent mean±s.e.m (n=7 mice in two independent experiments). P values, two-tailed unpaired t-test.
e, Representative μ-CT images of tibias from juvenile (5 week-old) and aged mice. Note significant loss of bone in aged mice.
f, Quantitative μ-CT analysis of relative bone volume, number of trabeculae and trabecular separation (i.e., space between trabeculae) in proximal tibias from juvenile mice and aged mice. Data represent mean±s.e.m (n=5 mice in two independent experiments). P values, two-tailed unpaired t-test.
g, FACS plots of CD31 and Endomucin double stained single cell suspensions from murine tibias. CD31hi/Emcnhi ECs decline with age.
h, Confocal images showing type H endothelium identified as GFP+ (red) ECs and proliferation (EdU incorporation, green) in the metaphysis (mp, upper panel) or diaphysis (dp, lower panel) from 3 or 7 week-old Flk1-GFP transgenic tibia, as indicated. EdU+ proliferating GFP+ cells (arrowheads), which represent type H endothelium, are abundant in the metaphysis (mp) of juvenile mice and but not adult mice. EdU+/GFP+ECs are sparse in sinusoidal (type L) vessels of the diaphysis.
i, FACS plots showing CD31 and endomucin double staining of single cell suspensions from juvenile, adult and aged mice livers. CD31hi/Emcnhi ECs in liver do not decline with age.
Extended Data Figure 7. Lineage tracing of type H endothelium and analysis of HIF pathway mutants.
a-b, Representative confocal images of sectioned tibiae from the genetic lineage tracing experiment analysed at 1 and 40 days after tamoxifen administration. GFP-labelled ECs (green) seen in Cdh5(PAC)-CreERT2 x Rosa26-mT/mG double transgenics after 1 day correspond arteries and type H endothelium (arrowheads) in the metaphysis (mp) and endosteum, but not in sinusoidal vessels of the diaphysis (dp). Counterstaining of ECs with anti-Endomucin antibody (red fluorescence) in samples taken after 40 days shows expansion of the GFP+ endothelium into the diaphyseal microvasculature. Nuclei in small insets in (a), DAPI (blue). Dashed lines indicate border of growth plate (gp) and outline of compact bone.
c, Representative confocal images of metaphyseal (mp) region in tibiae from the genetic lineage tracing experiment analysed at day 40 after tamoxifen administration showing GFP-labelled ECs (green) in Cdh5(PAC)-CreERT2 x Rosa26-mT/mG double transgenics and Osterix staining (white). Nuclei stained with DAPI (blue). Dashed lines drawn below chondrocytes (ch) lines indicate border of growth plate (gp).
d-e, Quantitative analysis of CD31hi/Emcnhi ECs in long bone from Hif1aiΔEC and corresponding littermate controls analysed at postnatal day 20 (P20, d) or P37 (e). Shown is fold change in frequency of ECs CD31hi/Emcnhi ECs identified by flow cytometry. Data represent mean±s.e.m (n=7 mice from three independent experiments d; n=6 mice from three independent experiments e). P values, two-tailed unpaired t-test.
f, Quantitative analysis of CD31hi/Emcnhi ECs in long bone from VhliΔEC and corresponding littermate controls analysed at postnatal day (P20). Shown is fold change in frequency of ECs CD31hi/Emcnhi ECs identified by flow cytometry. Data represent mean±s.e.m (n=5 mice from three independent experiments). P values, two-tailed unpaired t-test.
g, Representative tile scan confocal images from tibia sections of control and VhliΔEC mutants immunostained for Endomucin (red) and Osteopontin (green). Nuclei, DAPI (blue). Note widespread osteopontin staining in VhliΔEC mutant tibia. gp, growth plate; mp, metaphysis; dp, diaphysis; es, endosteum.
Extended Data Figure 8. VhliΔEC mutants show increased bone mass.
a-b, Serum alkaline phosphate levels in Hif1aiΔEC (a) and VhliΔEC (b) mutants. Data represent mean±s.e.m (n=5-6 mice for Hif1aiΔEC mice from three independent experiments; n=6 mice for VhliΔEC from three independent experiments). P values, twotailed unpaired t-test.
c, Representative μ-CT images of tibias from VhliΔEC mutants and littermate controls.
d-g, Quantitative μ-CT analysis of relative bone volume (d), trabecular thickness (e) trabecular number (f), and trabecular separation (g) in proximal tibia from VhliΔEC mutants and their littermate controls. Data represent mean±s.e.m (n=4 mice from from two independent experiments). P values, two-tailed unpaired t-test. Note increased bone mass in VhliΔEC mutants.
h, Calcein double labelling of 5 week-old VhliΔEC mutant and littermate control tibiae.
i-j, Quantitative analysis of bone formation parameters. Mineral apposition rate [MAR; (i)] and bone formation rate/bone surface [BFR/BS; (j)] for VhliΔEC mutants and controls. Data represent mean±s.e.m (n=6-7 mice from three independent experiments). P values, two-tailed unpaired t-test.
k, Representative confocal images showing Calcitonin receptor staining (osteoclasts) in tibia sections from VhliΔEC mutants and littermate controls. Nuclei, DAPI (blue).
l-m, Histological analysis of VhliΔEC and control tibiae showing osteoclast number/bone perimeter [No. Oc./B. Pm; (l)] and osteoclast surface/bone surface [Oc. S/B. S; (m)]. Data represent mean±s.e.m (n=6 mice from three independent experiments). P values, two-tailed unpaired t-test.
Extended Data Figure 9. Age-dependent endothelial HIF1-α expression.
a, Representative confocal images showing HIF1-α (green) and CD31 (red) immunostaining on sections of 2 week-old tibia. Nuclei, DAPI (blue). Note abundance of HIF1-α-positive type H ECs in 2 week-old metaphysis (mp) but not in the type L endothelium in diaphysis (dp). Dashed line marks border of growth plate (gp).
b, Quantitative mRNA expression analysis of Hif1a transcripts relative to mRNA encoding β-actin in type H and type L. Data represent mean±s.e.m (n=3 biological replicates). P values, two-tailed unpaired t-test.
c, d, Maximum intensity projections of HIF1-α (green) and CD31 (red) immunostaining in 7 week-old (c) and 61 week-old (d) tibiae. Nuclei, DAPI (blue). HIF1-α-positive endothelium was not detected in metaphysis (mp) of 7 week-old (c) and 61 week-old tibia (d).
e, Maximum intensity confocal images from the diaphysis of 5 week-old Flk1-GFP (green) irradiated (900 rads) and control tibiae after HIF1-α (red) immunostaining. HIF1-α signals (arrowheads) in GFP+ ECs are enhanced after irradiation.
f, qPCR expression analysis of Hif1a relative to transcripts encoding β-actin in sorted ECs from bones of irradiated mice and untreated controls. Data represent mean±s.e.m (n=7 mice from three independent experiments). P values, two-tailed unpaired t-test.
Extended Data Figure 10. DFM induction of type H ECs and osteoprogenitors.
a, b, Representative confocal images of CD31 (red, a, b) or Osterix (green, b) stained tibia sections from aged DFM-treated and control mice (60-65 weeks old). Low intensity projection shows only CD31hi cells. DFM induces CD31hi vessels and Osterix+ osteoprogenitors. Chondrocytes, ch.
c, Tile scan confocal images of CD31 (red) and Osterix (green, Osx) from metaphysis region of stained tibia sections from aged DFM-treated and control mice. Low intensity projection shows only CD31hi cells. DFM induces CD31hi vessels and Osterix+ osteoprogenitors. Nuclei, DAPI (blue). Dashed lines mark growth plate chondrocytes (ch) and outline of compact bone. Arrowheads indicate Osterix+ cells in secondary ossification centre (soc) and DFM-treated metaphysis.
d, Quantitation of Osterix+ osteoprogenitor cells in DFM treated and control parietal bones. Data represent mean±s.e.m (n=6 mice from mice from two independent experiments). P values, two-tailed unpaired t-test.
e, qPCR analysis of Ibsp, Sp7, Bglap and mRNA expression levels relative to Actb in the aged DFM or vehicle-treated (Control) parietal bones, as indicated. Data represent mean±s.e.m (n=6-7 mice from two independent experiments)). P values, two-tailed unpaired t-test.
Acknowledgements
We thank A. Medvinsky for kindly providing Flk1-GFP mice, M. Stehling for endothelial cell sorting and A. Borgscheiper for technical assistance. Funding was provided by the Max Planck Society, the University of Münster and the European Research Council (AdG 339409 AngioBone).
Footnotes
Author Contributions. A.P.K., S.K.R. and R.H.A. designed experiments and interpreted results. A.P.K and S.K.R performed all experiments. A.P.K and R.H.A. wrote the manuscript.
Author Information
The authors do not declare competing financial interests.
References
- 1.Tashiro Y, et al. Inhibition of PAI-1 induces neutrophil-driven neoangiogenesis and promotes tissue regeneration via production of angiocrine factors in mice. Blood. 2012;119:6382–6393. doi: 10.1182/blood-2011-12-399659. [DOI] [PubMed] [Google Scholar]
- 2.Red-Horse K, Crawford Y, Shojaei F, Ferrara N. Endothelium-microenvironment interactions in the developing embryo and in the adult. Dev Cell. 2007;12:181–194. doi: 10.1016/j.devcel.2007.01.013. [DOI] [PubMed] [Google Scholar]
- 3.Ding L, Saunders TL, Enikolopov G, Morrison SJ. Endothelial and perivascular cells maintain haematopoietic stem cells. Nature. 2012;481:457–462. doi: 10.1038/nature10783. [DOI] [PMC free article] [PubMed] [Google Scholar]
- 4.Butler JM, Kobayashi H, Rafii S. Instructive role of the vascular niche in promoting tumour growth and tissue repair by angiocrine factors. Nat Rev Cancer. 2010;10:138–146. doi: 10.1038/nrc2791. [DOI] [PMC free article] [PubMed] [Google Scholar]
- 5.Ribatti D, Nico B, Vacca A, Roncali L, Dammacco F. Endothelial cell heterogeneity and organ specificity. J Hematother Stem Cell Res. 2002;11:81–90. doi: 10.1089/152581602753448559. [DOI] [PubMed] [Google Scholar]
- 6.Garlanda C, Dejana E. Heterogeneity of endothelial cells. Specific markers. Arterioscler Thromb Vasc Biol. 1997;17:1193–1202. doi: 10.1161/01.atv.17.7.1193. [DOI] [PubMed] [Google Scholar]
- 7.Eshkar-Oren I, et al. The forming limb skeleton serves as a signaling center for limb vasculature patterning via regulation of Vegf. Development. 2009;136:1263–1272. doi: 10.1242/dev.034199. [DOI] [PubMed] [Google Scholar]
- 8.Maes C, et al. Increased skeletal VEGF enhances beta-catenin activity and results in excessively ossified bones. EMBO J. 2010;29:424–441. doi: 10.1038/emboj.2009.361. [DOI] [PMC free article] [PubMed] [Google Scholar]
- 9.Trueta J, Buhr AJ. The Vascular Contribution to Osteogenesis. V. The Vasculature Supplying the Epiphysial Cartilage in Rachitic Rats. J Bone Joint Surg Br. 1963;45:572–581. [PubMed] [Google Scholar]
- 10.Trueta J, Morgan JD. The vascular contribution to osteogenesis. I. Studies by the injection method. J Bone Joint Surg Br. 1960;42-B:97–109. doi: 10.1302/0301-620X.42B1.97. [DOI] [PubMed] [Google Scholar]
- 11.Glowacki J. Angiogenesis in fracture repair. Clin Orthop Relat Res. 1998:S82–89. doi: 10.1097/00003086-199810001-00010. [DOI] [PubMed] [Google Scholar]
- 12.Maes C, et al. Osteoblast precursors, but not mature osteoblasts, move into developing and fractured bones along with invading blood vessels. Dev Cell. 2010;19:329–344. doi: 10.1016/j.devcel.2010.07.010. [DOI] [PMC free article] [PubMed] [Google Scholar]
- 13.Burkhardt R, et al. Changes in trabecular bone, hematopoiesis and bone marrow vessels in aplastic anemia, primary osteoporosis, and old age: a comparative histomorphometric study. Bone. 1987;8:157–164. doi: 10.1016/8756-3282(87)90015-9. [DOI] [PubMed] [Google Scholar]
- 14.Lu C, et al. Effect of age on vascularization during fracture repair. J Orthop Res. 2008;26:1384–1389. doi: 10.1002/jor.20667. [DOI] [PMC free article] [PubMed] [Google Scholar]
- 15.Kataoka M, Tavassoli M. Identification of lectin-like substances recognizing galactosyl residues of glycoconjugates on the plasma membrane of marrow sinus endothelium. Blood. 1985;65:1163–1171. [PubMed] [Google Scholar]
- 16.Kopp HG, Avecilla ST, Hooper AT, Rafii S. The bone marrow vascular niche: home of HSC differentiation and mobilization. Physiology. 2005;20:349–356. doi: 10.1152/physiol.00025.2005. [DOI] [PubMed] [Google Scholar]
- 17.Hooper AT, et al. Engraftment and reconstitution of hematopoiesis is dependent on VEGFR2-mediated regeneration of sinusoidal endothelial cells. Cell Stem Cell. 2009;4:263–274. doi: 10.1016/j.stem.2009.01.006. [DOI] [PMC free article] [PubMed] [Google Scholar]
- 18.Nombela-Arrieta C, et al. Quantitative imaging of haematopoietic stem and progenitor cell localization and hypoxic status in the bone marrow microenvironment. Nat Cell Biol. 2013;15:533–543. doi: 10.1038/ncb2730. [DOI] [PMC free article] [PubMed] [Google Scholar]
- 19.Trueta J, Harrison MH. The normal vascular anatomy of the femoral head in adult man. J Bone Joint Surg Br. 1953;35-B:442–461. doi: 10.1302/0301-620X.35B3.442. [DOI] [PubMed] [Google Scholar]
- 20.Crock HV. A Revision of the Anatomy of the Arteries Supplying the Upper End of the Human Femur. J Anat. 1965;99:77–88. [PMC free article] [PubMed] [Google Scholar]
- 21.Ullah MS, Davies AJ, Halestrap AP. The plasma membrane lactate transporter MCT4, but not MCT1, is up-regulated by hypoxia through a HIF-1alpha-dependent mechanism. J Biol Chem. 2006;281:9030–9037. doi: 10.1074/jbc.M511397200. [DOI] [PubMed] [Google Scholar]
- 22.Boado RJ, Pardridge WM. Glucose deprivation and hypoxia increase the expression of the GLUT1 glucose transporter via a specific mRNA cis-acting regulatory element. J Neurochem. 2002;80:552–554. doi: 10.1046/j.0022-3042.2001.00756.x. [DOI] [PubMed] [Google Scholar]
- 23.Rodriguez J, et al. ERK1/2 MAP kinases promote cell cycle entry by rapid, kinase-independent disruption of retinoblastoma-lamin A complexes. J Cell Biol. 2010;191:967–979. doi: 10.1083/jcb.201004067. [DOI] [PMC free article] [PubMed] [Google Scholar]
- 24.Wang Y, et al. Ephrin-B2 controls VEGF-induced angiogenesis and lymphangiogenesis. Nature. 2010;465:483–486. doi: 10.1038/nature09002. [DOI] [PubMed] [Google Scholar]
- 25.Muzumdar MD, Tasic B, Miyamichi K, Li L, Luo L. A global double-fluorescent Cre reporter mouse. Genesis. 2007;45:593–605. doi: 10.1002/dvg.20335. [DOI] [PubMed] [Google Scholar]
- 26.Skawina A, Litwin JA, Gorczyca J, Miodonski AJ. The vascular system of human fetal long bones: a scanning electron microscope study of corrosion casts. J Anat. 1994;185(Pt 2):369–376. [PMC free article] [PubMed] [Google Scholar]
- 27.Nakashima K, et al. The novel zinc finger-containing transcription factor osterix is required for osteoblast differentiation and bone formation. Cell. 2002;108:17–29. doi: 10.1016/s0092-8674(01)00622-5. [DOI] [PubMed] [Google Scholar]
- 28.Lips P, Courpron P, Meunier PJ. Mean wall thickness of trabecular bone packets in the human iliac crest: changes with age. Calcif Tissue Res. 1978;26:13–17. doi: 10.1007/BF02013227. [DOI] [PubMed] [Google Scholar]
- 29.Smith DM, Khairi MR, Johnston CC., Jr The loss of bone mineral with aging and its relationship to risk of fracture. J Clin Invest. 1975;56:311–318. doi: 10.1172/JCI108095. [DOI] [PMC free article] [PubMed] [Google Scholar]
- 30.Sale S, Lafkas D, Artavanis-Tsakonas S. Notch2 genetic fate mapping reveals two previously unrecognized mammary epithelial lineages. Nat Cell Biol. 2013;15:451–460. doi: 10.1038/ncb2725. [DOI] [PMC free article] [PubMed] [Google Scholar]
- 31.Zovein AC, et al. Fate tracing reveals the endothelial origin of hematopoietic stem cells. Cell Stem Cell. 2008;3:625–636. doi: 10.1016/j.stem.2008.09.018. [DOI] [PMC free article] [PubMed] [Google Scholar]
- 32.Swift MR, Weinstein BM. Arterial-venous specification during development. Circ Res. 2009;104:576–588. doi: 10.1161/CIRCRESAHA.108.188805. [DOI] [PubMed] [Google Scholar]
- 33.Helisch A, Schaper W. Arteriogenesis: the development and growth of collateral arteries. Microcirculation. 2003;10:83–97. doi: 10.1038/sj.mn.7800173. [DOI] [PubMed] [Google Scholar]
- 34.Pugh CW, Ratcliffe PJ. Regulation of angiogenesis by hypoxia: role of the HIF system. Nat Med. 2003;9:677–684. doi: 10.1038/nm0603-677. [DOI] [PubMed] [Google Scholar]
- 35.Tang N, et al. Loss of HIF-1alpha in endothelial cells disrupts a hypoxia-driven VEGF autocrine loop necessary for tumorigenesis. Cancer Cell. 2004;6:485–495. doi: 10.1016/j.ccr.2004.09.026. [DOI] [PubMed] [Google Scholar]
- 36.Tanimoto K, Makino Y, Pereira T, Poellinger L. Mechanism of regulation of the hypoxia-inducible factor-1 alpha by the von Hippel-Lindau tumor suppressor protein. EMBO J. 2000;19:4298–4309. doi: 10.1093/emboj/19.16.4298. [DOI] [PMC free article] [PubMed] [Google Scholar]
- 37.Jones DT, Harris AL. Identification of novel small-molecule inhibitors of hypoxia-inducible factor-1 transactivation and DNA binding. Mol Cancer Ther. 2006;5:2193–2202. doi: 10.1158/1535-7163.MCT-05-0443. [DOI] [PubMed] [Google Scholar]
- 38.Kuznetsov SA, et al. The interplay of osteogenesis and hematopoiesis: expression of a constitutively active PTH/PTHrP receptor in osteogenic cells perturbs the establishment of hematopoiesis in bone and of skeletal stem cells in the bone marrow. J Cell Biol. 2004;167:1113–1122. doi: 10.1083/jcb.200408079. [DOI] [PMC free article] [PubMed] [Google Scholar]
- 39.Bianco P. Bone and the hematopoietic niche: a tale of two stem cells. Blood. 2011;117:5281–5288. doi: 10.1182/blood-2011-01-315069. [DOI] [PubMed] [Google Scholar]
- 40.Long MW. Osteogenesis and bone-marrow-derived cells. Blood Cells Mol Dis. 2001;27:677–690. doi: 10.1006/bcmd.2001.0431. [DOI] [PubMed] [Google Scholar]
- 41.Yin T, Li L. The stem cell niches in bone. J Clin Invest. 2006;116:1195–1201. doi: 10.1172/JCI28568. [DOI] [PMC free article] [PubMed] [Google Scholar]
- 42.Shapiro F. Bone development and its relation to fracture repair. The role of mesenchymal osteoblasts and surface osteoblasts. Eur Cell Mater. 2008;15:53–76. doi: 10.22203/ecm.v015a05. [DOI] [PubMed] [Google Scholar]
- 43.Park D, et al. Endogenous bone marrow MSCs are dynamic, fate-restricted participants in bone maintenance and regeneration. Cell Stem Cell. 2012;10:259–272. doi: 10.1016/j.stem.2012.02.003. [DOI] [PMC free article] [PubMed] [Google Scholar]
- 44.Ellis SL, et al. The relationship between bone, hemopoietic stem cells, and vasculature. Blood. 2011;118:1516–1524. doi: 10.1182/blood-2010-08-303800. [DOI] [PubMed] [Google Scholar]
- 45.Parmar K, Mauch P, Vergilio JA, Sackstein R, Down JD. Distribution of hematopoietic stem cells in the bone marrow according to regional hypoxia. Proc Natl Acad Sci U S A. 2007;104:5431–5436. doi: 10.1073/pnas.0701152104. [DOI] [PMC free article] [PubMed] [Google Scholar]
- 46.Wang L, et al. Identification of a clonally expanding haematopoietic compartment in bone marrow. EMBO J. 2013;32:219–230. doi: 10.1038/emboj.2012.308. [DOI] [PMC free article] [PubMed] [Google Scholar]
- 47.Ramasamy SK, Kusumbe AP, Adams RH. Endothelial notch activity promotes angiogenesis and osteogenesis in bone. Submitted to Nature. doi: 10.1038/nature13146. [DOI] [PMC free article] [PubMed] [Google Scholar]
- 48.Heaney RP. Pathophysiology of osteoporosis. Endocrinol Metab Clin North Am. 1998;159(2):230–234. doi: 10.1016/s0889-8529(05)70004-9. [DOI] [PubMed] [Google Scholar]
- 49.Losordo DW, Isner JM. Estrogen and angiogenesis: A review. Arterioscler Thromb Vasc Biol. 2001;27:255–65. doi: 10.1161/01.atv.21.1.6. [DOI] [PubMed] [Google Scholar]
- 50.Haase VH, Glickman JN, Socolovsky M, Jaenisch R. Vascular tumors in livers with targeted inactivation of the von Hippel-Lindau tumor suppressor. Proc Natl Acad Sci U S A. 2001;98:1583–1588. doi: 10.1073/pnas.98.4.1583. [DOI] [PMC free article] [PubMed] [Google Scholar]
- 51.Xu Y, et al. Neuropilin-2 mediates VEGF-C-induced lymphatic sprouting together with VEGFR3. J Cell Biol. 2010;188:115–130. doi: 10.1083/jcb.200903137. [DOI] [PMC free article] [PubMed] [Google Scholar]


