Abstract
Blood vessel growth in the skeletal system and osteogenesis appear coupled suggesting the existence of molecular crosstalk between endothelial and osteoblastic cells1,2. Understanding the nature of the mechanisms linking angiogenesis and bone formation should be of great relevance for improved fracture healing or prevention of bone mass loss. Here, we show that vascular growth in bone involves a specialised, tissue-specific form of angiogenesis. Notch signalling promotes endothelial cell proliferation and vessel growth in postnatal long bone, which is the opposite of the well-established function of Notch and its ligand Dll4 in the endothelium of other organs and tumours3,4. Endothelial cell-specific and inducible genetic disruption of Notch signalling in mice not only impaired bone vessel morphology and growth, but also led to reduced osteogenesis, shortening of long bones, chondrocyte defects, loss of trabeculae, and decreased bone mass. Based on a series of genetic experiments, we conclude that skeletal defects in these mutants involved defective angiocrine release of Noggin from endothelial cells, which is positively regulated by Notch. Administration of recombinant Noggin, a secreted antagonist of bone morphogenetic proteins, restored bone growth and mineralisation, chondrocyte maturation, the formation of trabeculae, and osteoprogenitor numbers in endothelial cell-specific Notch pathway mutants. These findings establish a molecular framework coupling angiogenesis, angiocrine signals and osteogenesis, which may prove significant for the development of future therapeutic applications.
Keywords: Bone formation, endothelial cells, Notch, Dll4, Noggin
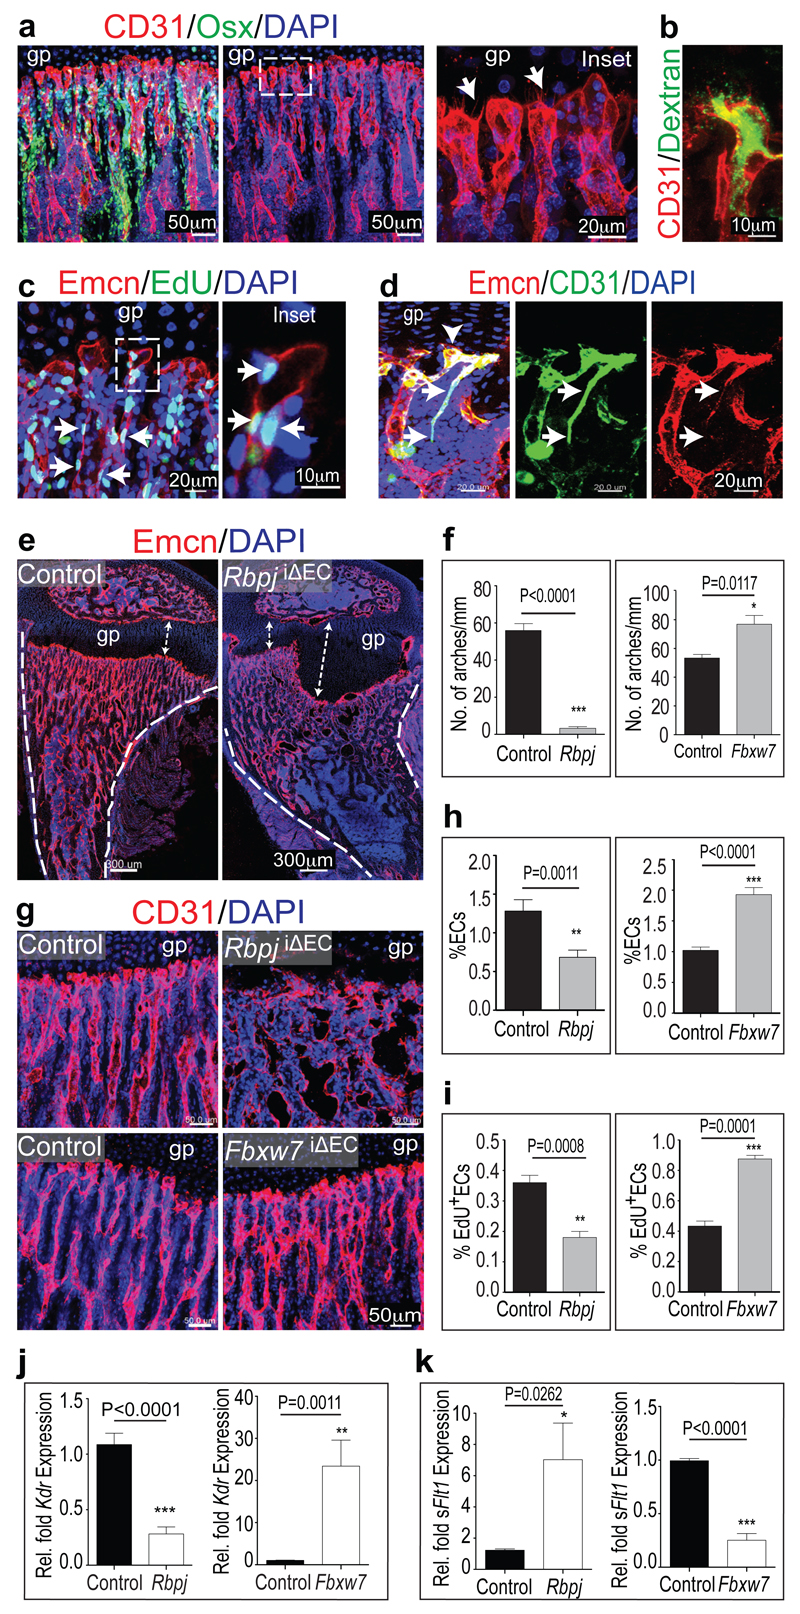
Dye injection and corrosion cast experiments had indicated that metaphyseal vessels in growing long bone are arranged in parallel, columnar strands with distal anastomotic interconnections5,6. Improved bone processing and immunostaining (see Methods) now allowed the detailed analysis of these vessels, which were straight tubules with a diameter of 5-10µm (Fig. 1a; Extended Data Fig. 1). At their distal end, next to growth plate chondrocytes, columns were linked by tubular arches, which carried blind-ended, bulb-shaped protrusions with a calibre of 15-20µm (Fig. 1a, Extended Data Fig. 2a-c). Osterix+ osteoblasts and their progenitors were abundant around endothelial columns (Fig. 1a). Arch vessels extended filopodia towards the growth plate and were fully lumenised as demonstrated by Dextran perfusion (Fig. 1b), expression of lumen markers like ICAM2 or Podocalyxin, and electron microscopy (Extended Data Fig. 2d-f). Thus, the most distal, leading endothelial structures in long bone were not sprouts but tubular arches carrying bulb-like protrusions.
Figure 1. Bone angiogenesis and regulation by Notch.
a, Confocal images showing the metaphyseal vasculature in 4 week-old tibia. Osterix+ (Osx, green) osteoblastic cells are closely associated with CD31+ (red) ECs. Nuclei, 4',6-diamidino-2-phenylindole (DAPI, blue). Note parallel arrangement of vessels pointing towards growth plate (gp). Right panel shows higher magnification of inset with bulb-shaped endothelial protrusions and filopodia (arrows).
b, Dextran perfusion of lumen in distal vessel within metaphysis of 4 week-old tibia.
c, Maximum intensity projection showing proliferating (EdU+, green) cells in metaphysis. ECs, Emcn (red); nuclei, DAPI (blue). Note abundant EdU+ ECs in columns. Inset shows single plane of EdU+ arch ECs.
d, 10 week-old tibia showing connection between CD31+/Emcn- arteriole (arrows)and CD31+/Emcn+ vascular arch (arrowhead).
e, Defective metaphyseal vasculature and enlarged growth plate (gp, arrows) in RbpjiΔEC tibia. Dashed lines, cortical bone; nuclei, DAPI (blue).
f, Distal arches (per mm length of metaphysis) were reduced in RbpjiΔEC tibiae and increased in Fbxw7iΔEC samples. (n=6 mice bones from 4 independent litters), Error bars, ± s.e.m. P values, two-tailed unpaired t-tests.
g, Confocal images showing defective CD31+ vessels (red) in RbpjiΔEC tibia and increased Fbxw7iΔEC vessel density. Nuclei, DAPI (blue).
h, i, Flow cytometric quantitation of percentage of total (CD45- Ter119- CD31+) ECs (h) (n=6 mice from 4 independent litters) and EdU+ ECs (i) (n=5 mice from 4 independent litters) in RbpjiΔEC or Fbxw7iΔEC bone samples relative to controls. Error bars, ± s.e.m. P values, two-tailed unpaired t-tests.
j, k, qPCR analysis of VEGFR2 (Kdr) and soluble VEGFR1 (sFlt1) in sorted RbpjiΔEC and Fbxw7iΔEC bone ECs (n=4 mice from 4 independent litters). Error bars, ± s.e.m. P values, two-tailed unpaired t-test.
EdU labelling revealed that endothelial cell (EC) proliferation predominantly occurred within metaphyseal columns and, less prominently, in arches (Fig. 1c and Extended Data Fig. 2g). Endomucin (Emcn), a sialoprotein expressed by non-arterial ECs7, allowed the identification of arterioles in long bone as thin (5µm) CD31+/Emcn-vessels. Arterioles terminated in CD31+/Emcn+ vascular arches (Fig. 1d). As shown in the accompanying manuscript8, CD31hi/Emcnhi (type H) ECs, as found in vessel columns and arches, display high proliferation rates and mediate vascular growth in bone.
Known regulators of vessel growth were highly expressed in freshly isolated type H ECs relative to the much more abundant CD31lo/Emcnlo (type L) cells of the sinusoidal vasculature of the marrow cavity (Extended Data Fig. 3 a). Immunostaining confirmed high expression of Neuropilin 1, Plexin D1, Unc5b, or FLT4/VEGFR3 in vessel arches and columns (Extended Data Fig. 3b-g). These data indicate a specialized mode of angiogenesis in bone where type H vessel arches and columns are the functional equivalent of endothelial sprouts.
Notch negatively regulates angiogenesis in embryos, murine retinas or tumours3,4,9. Notch and Delta-like 4 (Dll4), which signal in a cell-cell contact-dependent fashion between ECs, limit sprouting and mitosis in the growing vasculature. In long bone, Dll4 was highly expressed by arteries and vessel arches. Jagged1, another Notch ligand controlling angiogenesis, was found in vessel arches and columns, but also in perivascular mesenchymal (osteoprogenitor) cells (Extended Data Fig. 3h, i). Inducible targeting of the Rbpj gene encoding RBP-Jκ, an essential mediator of Notch-induced gene transcription, in postnatal endothelium unexpectedly decreased CD31hi/Emcnhi vessels and the number of total and proliferating ECs in long bone (Fig. le-i; Extended Data Fig. 4a). The column/arch pattern was disrupted in RbpjiΔEC tibiae, and filopodia extension from mutant vessels was disorganised (Fig. le, g; Extended Data Fig. 4c-e). For Notch gain-of-function experiments, we targeted the gene for Fbxw7, which mediates polyubiquitination and proteasomal degradation of active Notch10, with an inducible strategy. While mutants had strongly reduced retinal angiogenesis due to Notch overactivation11, column/arch structures and both total and EdU+ ECs were more abundant in Fbxw7iΔEC long bone (Fig. 1f-i; Extended Data Fig. 4b, c). CD31hi/Emcnhi vessel abundance was increased in Fbxw7iΔEC and strongly decreased in RbpjiΔEC bone sections (Extended Data Fig. 4f-h). As Notch can positively regulate artery formation, Fbxw7iΔEC bones contained numerous small arterioles (Extended Data Fig. 5a).
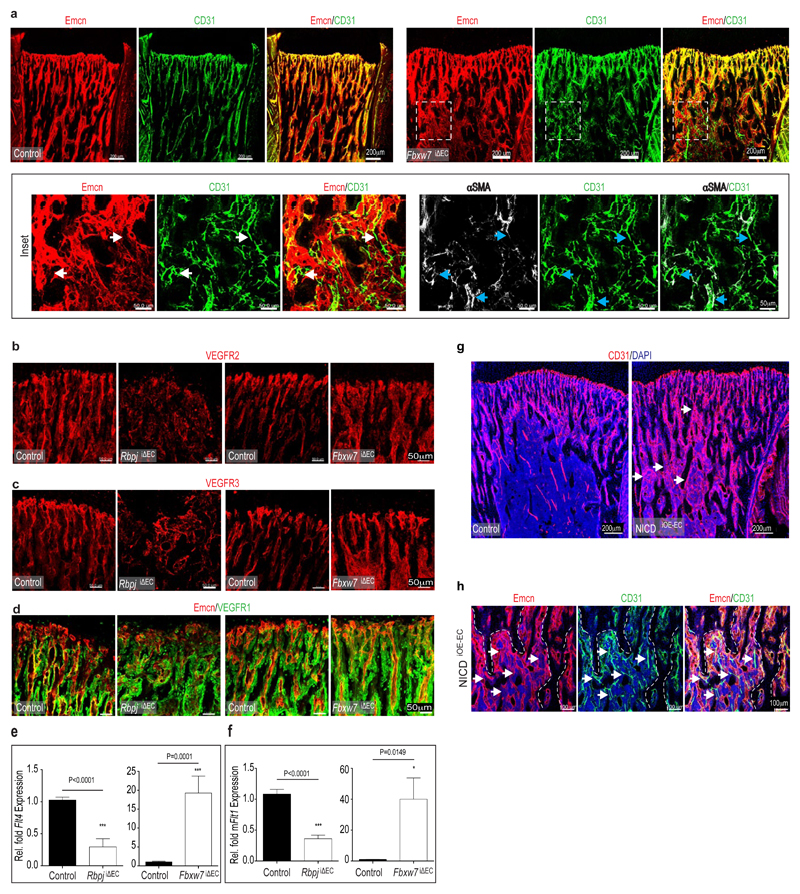
Suppression of angiogenesis by Dll4/Notch has been linked to VEGF receptor downregulation3,4,9. In RbpjiΔEC metaphyseal vessels, VEGFR1, VEGFR2 and VEGFR3 immunostaining was reduced, while Fbxw7iΔEC samples contained more labelled vessels (Extended Data Fig. 5b-d). Transcripts for all three receptors were reduced in freshly sorted RbpjiΔEC bone ECs but increased in Fbxw7iΔEC cells (Fig. 1j; Extended Data Fig. 5e, f). In contrast, mRNA for soluble VEGFR1 (sFltl), which antagonises VEGF-induced signalling, was strongly elevated in RbpjiΔEC samples and decreased in Fbxw7iΔEC ECs (Figure lk).
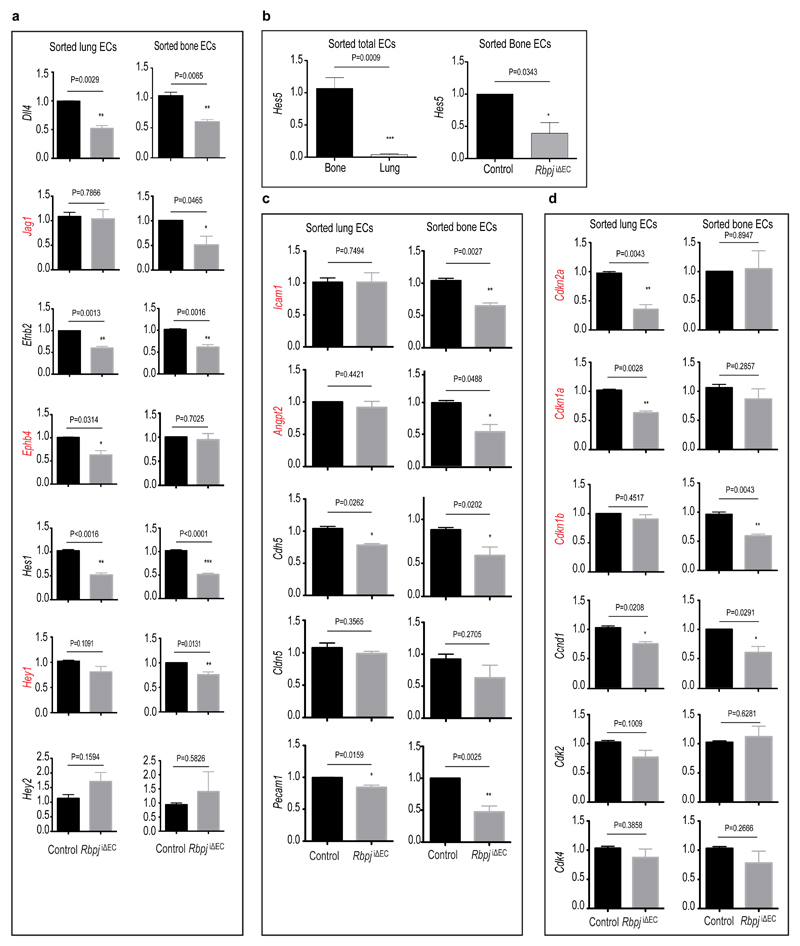
Inducible, EC-specific overexpression of the Notch1 intracellular domain (NICD) phenocopied the Fbxw7iΔEC results. CD31hi/Emcnhi vessels and small arterioles were significantly more abundant in the mutant metaphysis (Extended Data Fig. 5g, h). Thus, while Notch inhibits vessel growth and endothelial proliferation in other organs, the pathway promotes bone angiogenesis. Expression of Notch target genes (Hey1, Hes5), modulators of angiogenesis (Jag1, Ephb4, Angpt2) and cell cycle regulators (Cdkn1a, Cdkn1b, Cdkn2a) was also different between freshly isolated lung and bone ECs (Extended Data Fig. 6a-d).
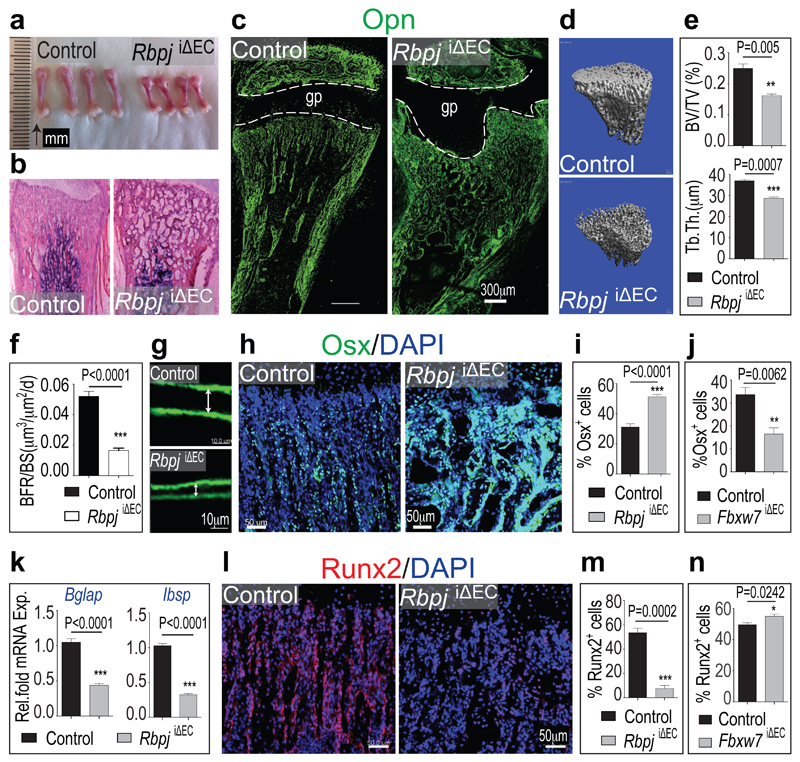
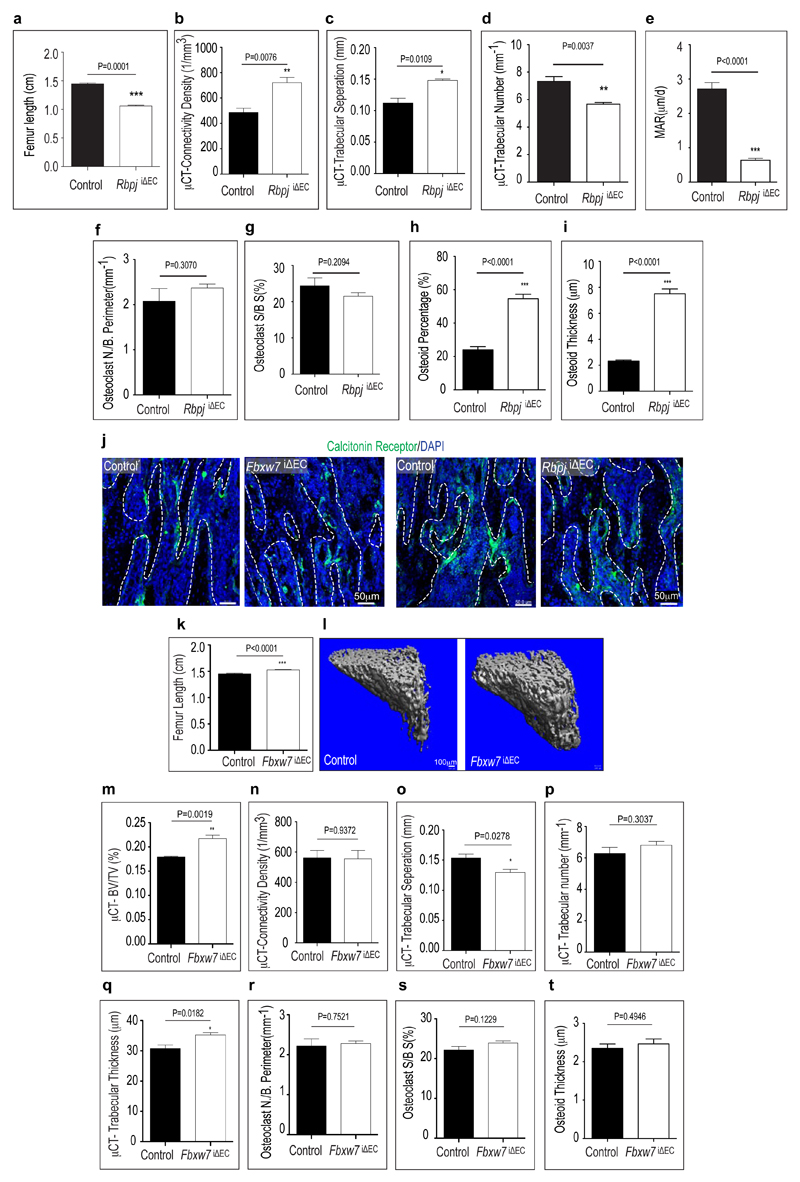
Defective angiogenesis in RbpjiΔEC mice was accompanied by shortened long bones (Fig. 2a; Extended Data Fig. 7a) and disorganisation of the metaphysis with large, irregular lacunae (Fig. 2b). Osteopontin immunostaining showed that mutants lacked clearly separated trabeculae and contained numerous small, highly interconnected bony elements (Fig. 2c). Micro-computed tomography (µ-CT) and histomorphometric analysis showed significant loss of bone mass and density (i.e., bone volume over total volume; BV/TV), number and thickness of trabeculae, and osteoid thickness in RbpjiΔEC tibiae, without overt changes in bone-resorbing osteoclasts (Fig. 2d, e; Extended Data Fig. 7b-j). Calcein double labelling showed strongly reduced bone formation rates in RbpjiΔEC bone (Fig. 2f, g).
Figure 2. Endothelial Notch signalling regulates osteogenesis.
a, Decreased length of freshly dissected RbpjiΔEC femurs compared to control littermates.
b, Hematoxylin/eosin-stained longitudinal RbpjiΔEC and control tibia sections.
c, Osteopontin (Opn) immunostaining showing defective formation of trabeculae in P28 RbpjiΔEC tibia.
d, 3D µ-CT reconstruction of 4 week-old control and RbpjiΔEC metaphysis.
e, Reduced trabecular bone volume density measured as bone volume/total volume (BV/TV) and trabecular bone thickness (Tb.Th) in RbpjiΔEC mice.
f, g, Bone Formation Rate per Bone Surface (BFR/BS, f) calculated by calcein double labelling (7 day time interval) confirmed decreased bone formation in P28 Rbpj mutants. Arrows in (g) mark distance between calcein-labelled layers (n=10 mice from 6 independent litters). Error bars, ± s.e.m. P value, two-tailed unpaired t-tests.
h, Osterix (Osx) immunostaining shows strongly increased osteoprogenitor numbers in RbpjiΔEC metaphysis.
i, j, Quantitation of metaphyseal Osx+ cells in RbpjiΔEC (i) and Fbxw7iΔEC mutants (j) relative to controls (n=6 mice from 4 independent litters). Error bars, ± s.e.m. P values, two-tailed unpaired t-tests.
k, qPCR analysis showing reduced expression of mature osteoblast markers (Bglap, Ibsp) in RbpjiΔEC bones (n=6 mice from 4 independent litters).
1, Immunostaining showing decrease of Runx2+ early osteoprogenitors in 4 week-old RbpjiΔEC tibiae.
m, n, Quantitation of metaphyseal Runx2+ cells in RbpjiΔEC (m) and Fbxw7iΔEC mutants (n) relative to littermate controls (n=6 mice from 4 independent litters). Error bars, ± s.e.m. P values, two-tailed unpaired t-tests.
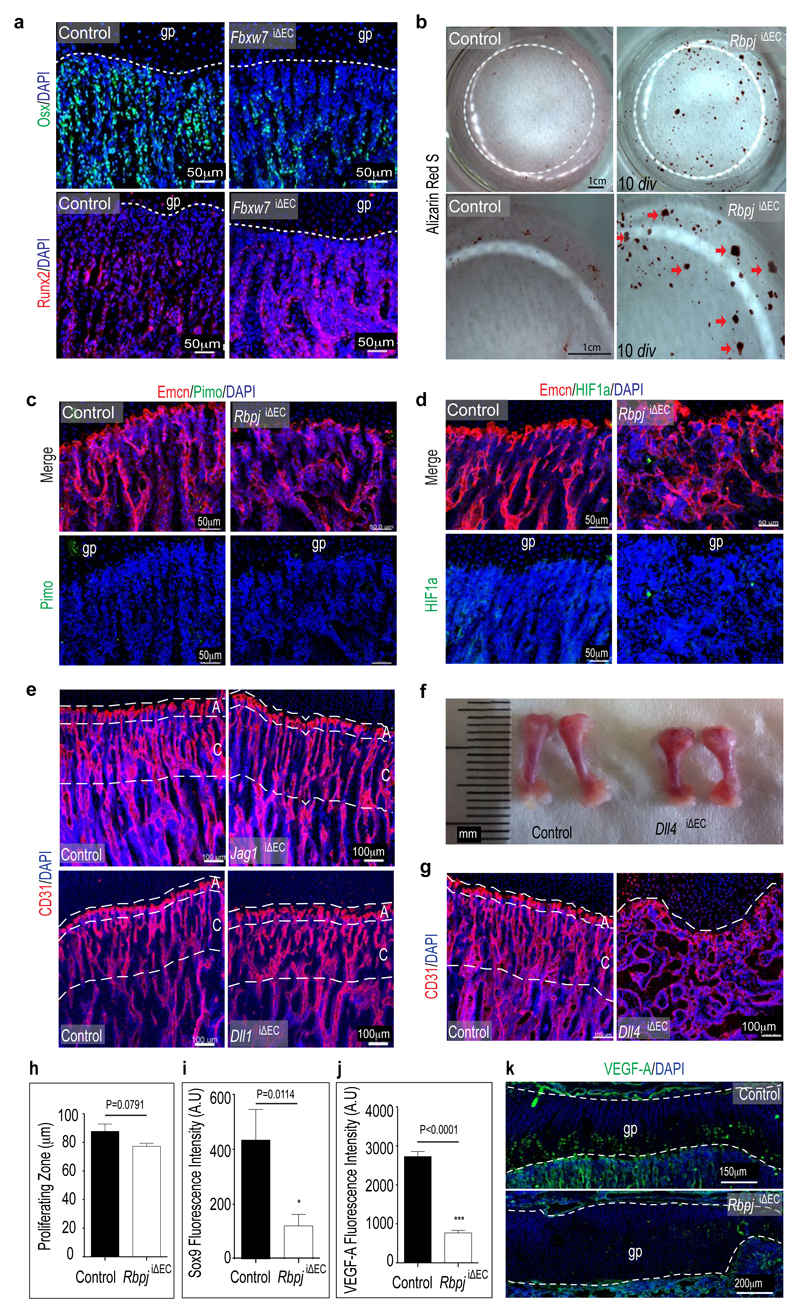
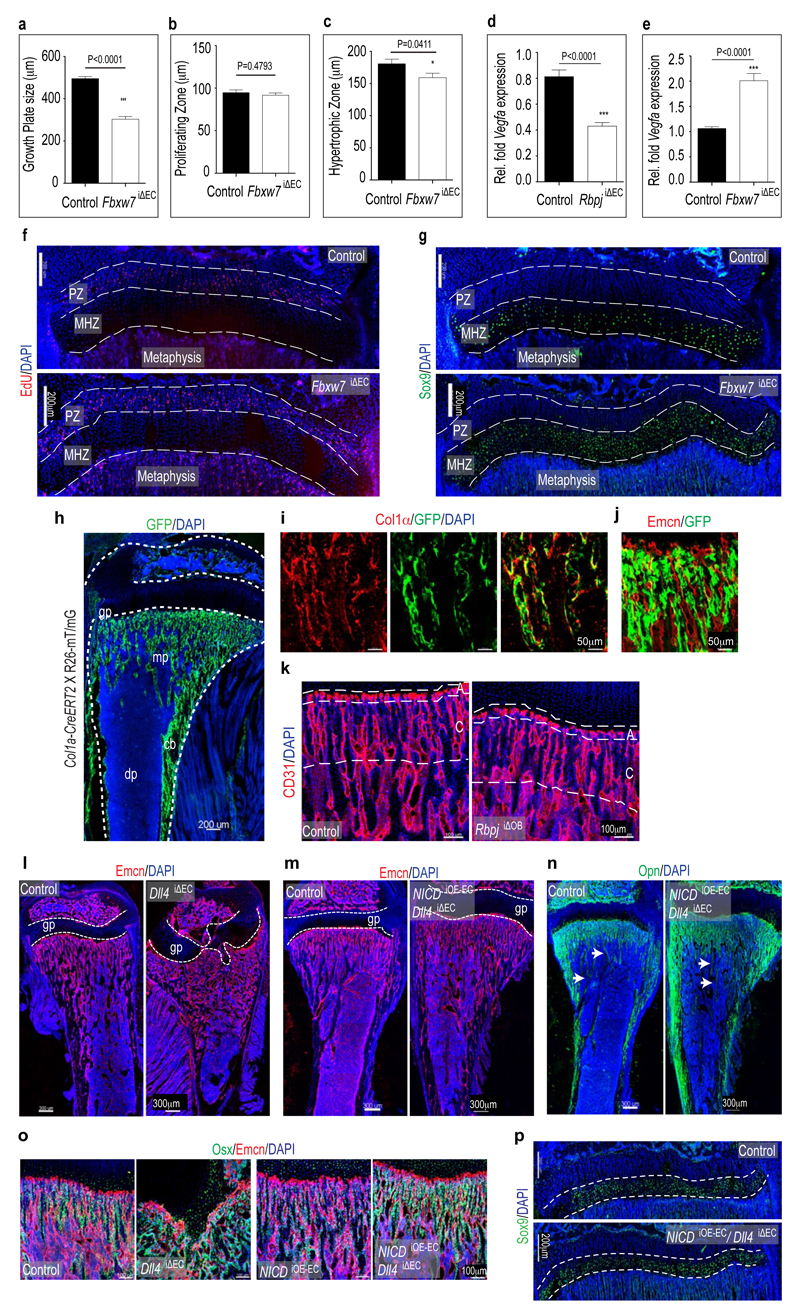
Osterix+ cell numbers were significantly increased in the RbpjiΔEC metaphysis (Fig. 2h-i). Conversely, stabilization of active Notch in Fbxw7iΔEC mice significantly enhanced femur extension and bone growth, and reduced Osterix+ cell abundance without appreciable effect on osteoclasts (Fig. 2j; Extended Data Fig. 7j, k and 8a). Bglap (bone gamma-carboxyglutamate protein) and Ibsp (integrin-binding sialoprotein) expression were reduced in RbpjiΔEC bones (Fig. 2k) indicating that accumulating Osterix+ cells were immature osteoblasts. Runx2+ early osteoprogenitors, which give rise to Osterix+ osteoblasts12, were strongly reduced in RbpjiΔEC samples (Fig. 2l, m) but more abundant in Fbxw7iΔEC mutants (Fig. 2n; Extended Data Fig. 8a). Confirming the accumulation of osteoprogenitors, primary mesenchymal cells from RbpjiΔEC bone generated mineral nodules within 10-14 days, whereas controls required 21-28 days (Extended Data Fig. 8b and data not shown). These data suggested that Notch-dependent, EC-derived signals control osteoprogenitor differentiation. Arguing against defective oxygenation as the cause of these changes, pimonidazole and anti-HIF1α staining were not overtly altered in RbpjiΔEC long bone (Extended Data Fig. 8c, d).
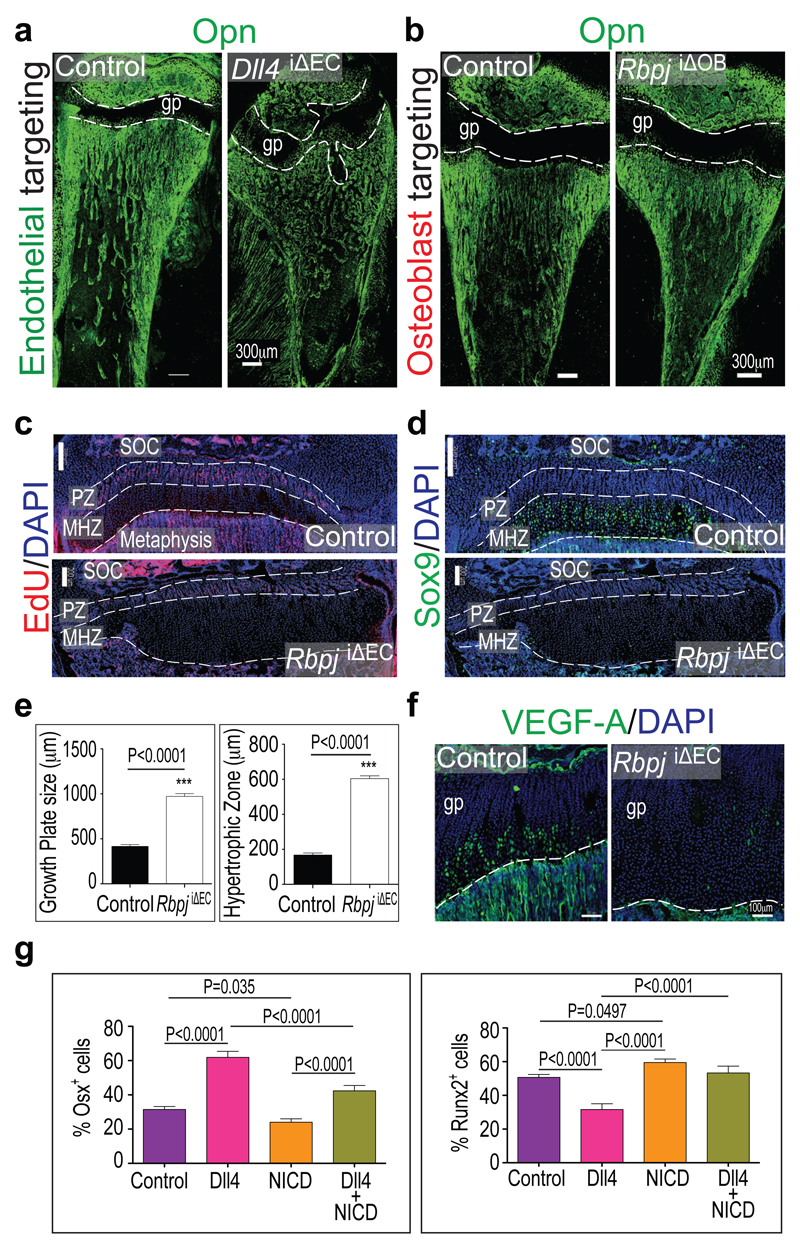
To identify the relevant Notch ligand in bone vessels, Cdh5(PAC)-CreERT2 transgenics were combined with conditional Dll113, Dll414 or Jag1 (encoding Jagged1)15 mice, respectively. Vessel growth and patterning was not overtly altered in the Dll1iΔEC or Jag1iΔEC mutant skeleton (Extended Data Fig. 8e). Dll4iΔEC long bones were substantially shorter and phenocopied RbpjiΔEC defects (Extended Data Fig. 8f, g) including loss of trabeculae, appearance of highly interconnected bony elements, accumulation of Osterix+ cells, and reduction of Runx2+ early osteoprogenitors (Fig. 3a, g and data not shown). Highly similar Dll4iΔEC and RbpjiΔEC phenotypes argued that RBP-Jκ is essential for Notch signalling and not primarily acting as a transcriptional repressor16.
Figure 3. Osteogenesis requires EC-autonomous Notch signalling.
a, b, Osteopontin (Opn) immunostaining showing malformed bone and growth plate (gp, dashed lines) in 4 week-old Dll4iΔEC (a) but not in osteoblast-specific Rbpj mutant (RbpjiOB) tibiae (b).
c, d, Confocal images of control and RbpjiΔEC EdU-labelled proliferating zones (PZ, c) and Sox9 immunostained maturation/hypertrophy zones (MHZ, d). Note diminished Sox9 in RbpjiΔEC mutant. Dashed lines mark PZ and MHZ borders. SOC, secondary ossification centre; nuclei, DAPI (blue).
e, Quantitative analysis of the sizes of RbpjiΔEC and Fbxw7iΔEC mutant growth plates and maturation/hypertrophy zones (n=6 mice from 4 independent litters). Error bars, ± s.e.m. P values, two-tailed unpaired t-test.
f, Strongly reduced VEGF-A immunostaining (green) in P28 RbpjiΔEC mutant growth plate (gp) chondrocytes.
g, h, Quantitative analysis of Osx+ (i) and Runx2+ (j) cells in control, Dll4, NICD, or Dll4+NICD tibiae, as indicated. Controls are littermate animals without Cre expression (n=4 mice from 4 independent litters). Error bars, ± s.e.m. P values, oneway ANOVA with Bonferroni’s multiple comparison post-hoc test.
RbpjiΔEC and Dll4iΔEC mutants displayed enlarged and irregularly shaped growth plates (Fig. 1e, 2c, 3a). While labelling of mitotic chondrocytes in the proliferating zone did not reveal overt alterations, mutant maturation/hypertrophy zones were significantly enlarged and expression of Sox9, which regulates chondrocyte differentiation and hypertrophy, was lost (Fig. 3c-e; Extended Data Fig. 8h, i). VEGF-A expression by mature and hypertrophic chondrocytes17 was also strongly reduced (Fig. 3f; Extended Data Fig. 8j, k). The size of Fbxw7iΔEC growth plates and maturation/hypertrophy zones was reduced, while Sox9 expression was maintained (Extended Data Fig. 9a-c and 9f, g). Vegfa transcripts were elevated in Fbxw7iΔEC bone samples in sharp contrast to the reduction in RbpjiΔEC tibiae (Extended Data Fig. 9d, e).
Mesenchymal Notch expression promotes proliferation and suppresses osteoblast differentiation18,19. As Dll4 expression is transcriptionally regulated by Notch and RBP-Jκ3, endothelial Dll4 might signal through Notch receptors on perivascular osteoprogenitors. However, targeting of Rbpj in postnatal osteoblastic cells with Tg(Col1a1-creERT2)6.1.ICS transgenic mice (Extended Data Fig. 9h-j) with the same experimental schedule as for EC-specific mutants did not lead to appreciable defects in the metaphyseal vasculature or osteoprogenitor cells (Fig. 3b; Extended Data Fig. 9k and data not shown). Reinstating Notch signalling in ECs by combining Dll4iΔEC and NICD overexpressing mutants (NICDiOE-EC) rescued the structural alterations seen in the Dll4iΔEC metaphysis and bone vasculature, enabled trabeculae formation, and restored growth plate size, Sox9 expression and osteoprogenitor numbers (Fig. 3g, Extended Data Fig. 9l-p). Thus, EC-specific and cell-autonomous Notch activity regulates bone angiogenesis and couples it to osteogenesis.
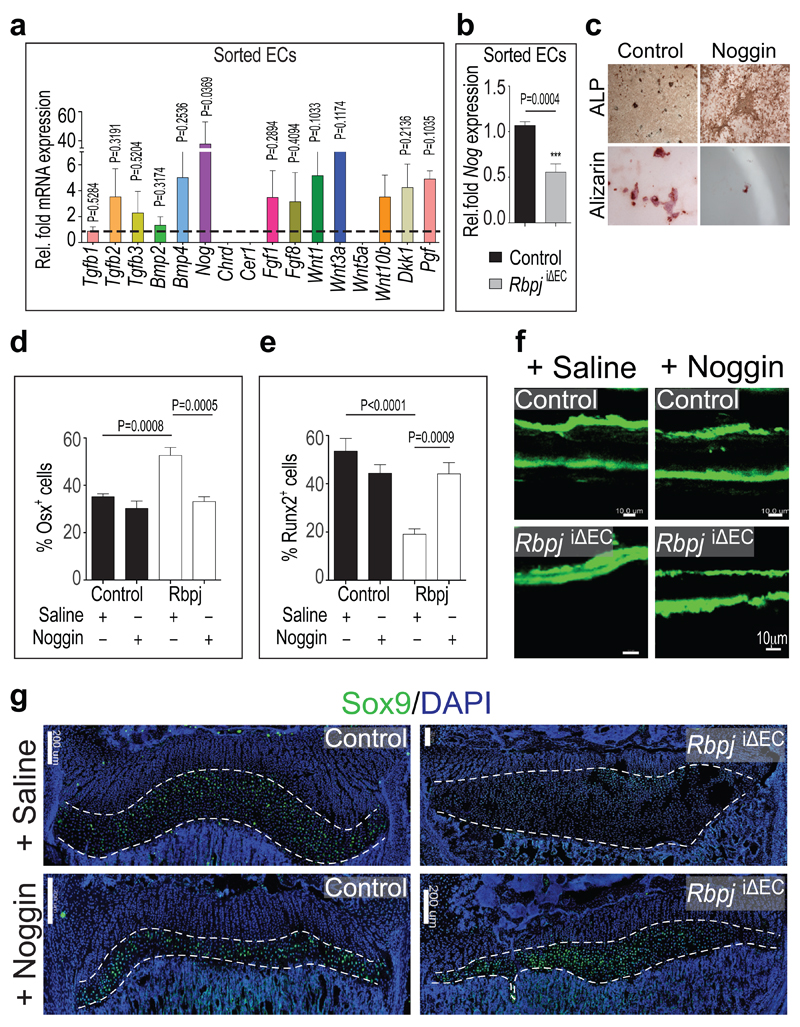
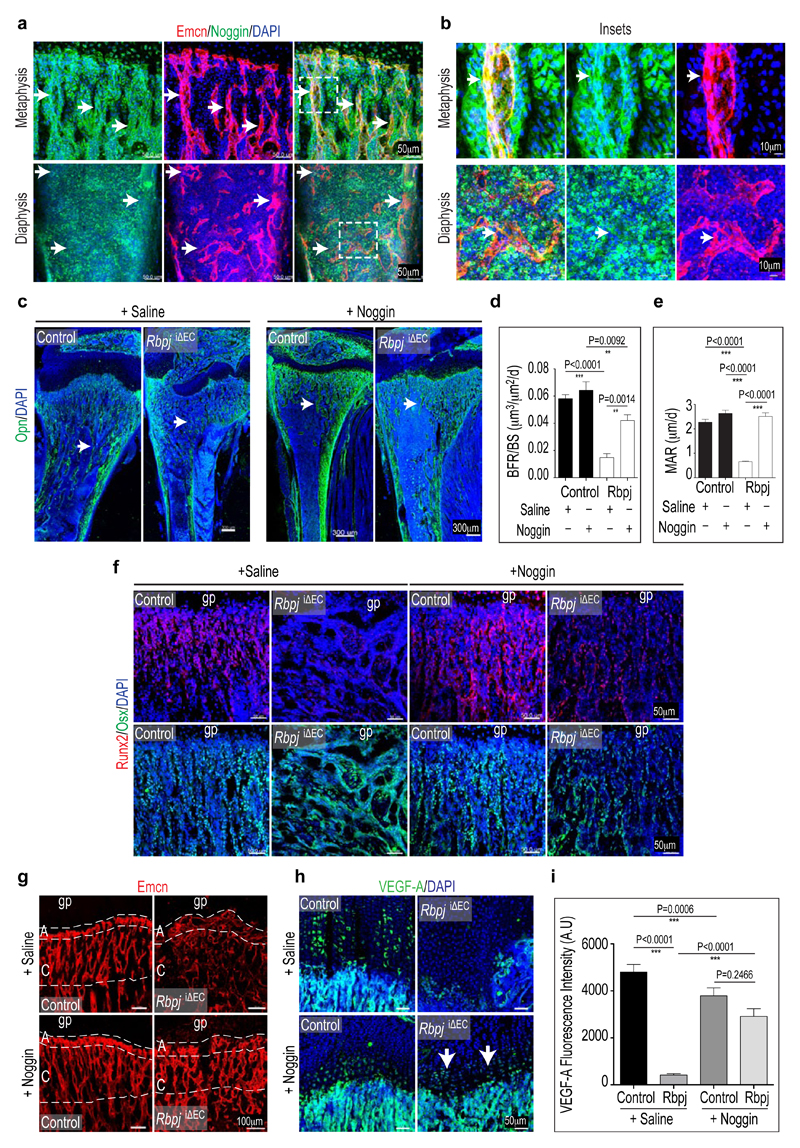
Recent studies have highlighted the importance of angiocrine factors for organ growth and regeneration20. To identify potential EC-derived signals acting on osteoblastic cells, ECs isolated from Fbxw7iΔEC and control bone were screened by a candidate approach. Tgfb2, Bmp4, Fgf1, Fgf8, Wnt1, Wnt3a, Wnt10b, Dkk1, and Pgf (encoding Plgf) transcripts were increased in Fbxw7iΔEC bone endothelium (Fig. 4a). The highest upregulation (40-fold) was observed for Nog mRNA encoding Noggin, a secreted antagonist of bone morphogenetic proteins (BMPs). Other secreted BMP antagonists, namely Chordin (Chrd) and Cerberus 1 (Cer1), were not detectable in FACS-isolated bone ECs (Fig. 4a). Further arguing for Noggin as a Notch-controlled angiocrine regulator, Nog expression was significantly reduced in purified RbpjiΔEC bone ECs (Fig. 4b). In control tibiae, Noggin immunostaining was detected in endothelial columns/arches and surrounding perivascular cells. In diaphysis, Noggin was detectable at lower level and without overt vessel association (Extended Data Fig. 10a, b). Consistent with its known role in bone formation21–23, Noggin inhibited primary mesenchymal cell differentiation into osteoblasts in vitro (Fig. 4c). While global Nog gene knockouts were embryonic lethal, heterozygotes and osteoblast-specific mutants developed skeletal defects reminiscent of RbpjiΔEC mice including impaired bone formation, shortened femoral length, reduced trabeculae, and oversized growth plates 22,23. Daily injection of RbpjiΔEC mice with recombinant Noggin protein for 2 weeks prior to analysis at P28 restored metaphysis organisation, improved bone formation, and normalised the number of osteoprogenitors (Fig. 4d-f; Extended Data Fig. 10c-f). Exogenous Noggin also restored the organisation of the RbpjiΔEC bone vasculature, growth plate size, and chondrocyte Sox9 and VEGF-A expression (Fig. 4g; Extended Data Fig. 10g-i).
Figure 4. DRole of Notch-dependent, angiocrine Noggin expression.
a, Tgfb1, Tgfb2, Tgfb3, Bmp2, Bmp4, Nog, Chrd, Cer1, Fgf1, Fgf8, Wnt1, Wnt3a, Wnt5a, Wnt10b, Dkk1, and Pgf mRNA expression in isolated bone ECs from Fbxw7iΔEC mice normalized to littermate controls (dashed line) (n=4 mice from 4 independent litters). Error bars, ± s.e.m. P values, two-tailed unpaired t-test.
b, qPCR analysis showing reduced Nog expression in ECs sorted from RbpjiΔEC long bone mice (n=4 mice from 4 independent litters). Error bars, ± s.e.m. P value, two-tailed unpaired t-test.
c, Noggin-mediated inhibition of osteoblastic differentiation of cultured murine mesenchymal progenitors. Mineral nodule formation (Alizarin staining) was supressed, and alkaline phosphatase (ALP) retained by Noggin after 28 days of in vitro differentiation.
d, e, Quantitation of Osx+ (d) and Runx2+ cells (e) in Noggin-treated vs. Saline control and RbpjiΔEC long bones (n=6 mice from 4 independent litters). Error bars, ± s.e.m. P values, one-way ANOVA with Bonferroni’s multiple comparison post-hoc test.
f, Calcein double labelling in RbpjiΔEC mutant or control tibiae treated with Saline or Noggin, as indicated. Noggin strongly improved RbpjiΔEC mineral apposition rates.
g, Noggin restored RbpjiΔEC growth plate size and Sox9 expression (green) in the maturation/hypertrophy zone (marked by dashed lines). Nuclei, DAPI (blue).
These findings identify Notch as an important positive regulator of vascular growth in bone, which is highly distinct from the Dll4/Notch-mediated suppression of EC mitosis and sprouting in other organs. While previous work has already indicated that Osterix+ cells co-invade with growing vessels in experimental bone fractures2, we now establish a molecular framework coupling the activity of ECs, chondrocytes and osteoprogenitors. Future work will address whether Notch and other pathways can be utilized to promote fracture healing or prevent pathological bone loss.
Methods Summary
For wild-type bone analysis, C57BL/6J male mice were used unless stated otherwise. All EC-specific gene targeting experiments were performed with Cdh5(PAC)-CreERT2 transgenic mice24. For Rbpj deletion in the postnatal endothelium, mice carrying loxP-flanked Rbpj (Rbpjlox/lox) alleles25 and Cdh5(PAC)-CreERT2 transgenics were interbred. To induce Cre activity and gene deletion, offspring was injected with 500µg tamoxifen (Sigma, T5648) intraperitoneally every day from P10 to P14. The resulting RbpjiΔEC (CreERT2T/+ Rbpjlox/lox) mutants and Cre- littermate controls were sacrificed at P28, and femurs and tibiae were collected for analysis. Identical breeding and tamoxifen administration strategies were used to generate EC-specific mutants with Fbxw7lox/lox (Ref.10), Dll1lox/lox (Ref. 13), Dll4lox/lox (Ref. 14), or Jag1lox/lox (Ref. 15) mice and inducible osteoblast-specific Rbpj knockouts (RbpjiOB). The latter were generated with Tg(Col1a1-creERT2)6.1.ICS transgenic mice (Institut Clinique de la Souris, France).
For Notch gain-of-function experiments, Gt(ROSA)26Sortm1(Notch1)Dam/J mice carrying a Cre-inducible transgene for Notch1 intracellular domain overexpression26 and Cdh5(PAC)-CreERT2 transgenics were interbred. Tamoxifen administration (see above for injection schedule) was used to generate CreERT2-positive (NICDiOE-EC) mutants overexpressing NICD in ECs and controls. For experiments with EC-specific Dll4iΔEC/NICDiOE-EC double mutants, interbreeding of Dll4lox/lox conditional mice14 with Gt(ROSA)26Sortm1(Notch1)Dam/J and Cdh5(PAC)-CreERT2 transgenics generated triple heterozygote males, which were bred to Dll4lox/+ Gt(ROSA)26Sortm1(Notch1)Dam/J double heterozygous females. This produced CreERT2-negative controls together with Dll4lox/lox NICD+/+ CreERT2T/+ (Dll4iΔEC) and Dll4+/+ NICD+/OE CreERT2T/+ (NICDiOE-EC) single mutants, and Dll4iΔEC/NICDiOE-EC double mutants, which received tamoxifen and were analysed as described above. For mutant analysis, both male and female mice were used.
For Noggin administration experiments, mice were injected intraperitoneally once daily with 500µg/kg recombinant Noggin (R&D Systems) from P15 to P27, after completion of tamoxifen injections (P10-P14) and before analysis at P28.
All animal experiments were performed in compliance with the relevant laws and institutional guidelines and were approved by local animal ethics committees.
Methods
Immunohistochemistry
Freshly dissected tibiae were collected from wild-type, mutant mice and their control littermates and immediately fixed in 4% ice-cold paraformaldehyde solution for 4 hr. Decalcification was carried out with 0.5M EDTA at 4°C with constant shaking for 24 hr. Then the decalcified bones were immersed into 20% sucrose and 2% polyvinylpyrrolidone (PVP) for 24hrs. Finally, the tissues were embedded and frozen in 8% gelatin (porcine) in the presence of 20% sucrose and 2% PVP and cryosectioned using low-profile blades on a Leica CM3050 cryostat.
For phenotypic analysis, mutant mice and littermate controls were always processed, sectioned, stained, imaged and analysed together at the same conditions and settings. For immunostaining, bone sections were air-dried, permeabilised for 10 min in 0.3% Triton X-100, blocked in 5% donkey serum at room temperature (RT) for 30 min. Blocked sections were probed with the primary antibodies diluted in 5% donkey serum in PBS for 2 hr at RT or overnight at 4°C. After primary antibody incubation, sections were washed with PBS for three times and incubated with appropriate Alexa Fluor-coupled secondary antibodies (1:400, Molecular Probes) for 1 hr at RT. Nuclei were counterstained with DAPI. Sections were thoroughly washed with PBS before mounting them using FluoroMount-G (Southern Biotech). Finally, the slides were air-dried and sealed with nail polish (RIMMEL, London).
The following primary antibodies were used: Endomucin (sc-65495, Santa Cruz, diluted 1:100), Pecam1 conjugated to Alexa Fluor488 (FAB3628G, R&D Systems, 1:100), Pecam1 (553370, BD Pharmingen, 1:100), Osterix (sc-22536-R, Santa Cruz, 1:200), Runx2 (MAB2006, R&D Systems, 1:200), α-SMA-Cy3 (C6198, Sigma, 1:100), Hif1-α (ab65979, Abcam, 1:100), Collagen type 1 (AB675P, Millipore, 1:200), Osteopontin (AF808, R&D Systems, 1:200), Calcitonin receptor (ab11042, Abcam, 1:75), Noggin (SC-25656, Santa Cruz, 1:200), Icam2 (553326, BD Pharmingen, 1:100), Podocalyxin (AF1556, R&D Systems, 1:100), GFP (A21311, Invitrogen, 1:200), VEGF-A (SC-152, Santa Cruz, 1:100), Sox9 (AF3075, R&D Systems, 1:100), Dll4 (AF1389, R&D Systems, 1:100), Jag1 (SC-6011, Santa Cruz, 1:200), VEGFR1 (NB100-57643, Novus Biologicals, 1:100), VEGFR2 (555307, BD Pharmingen, 1:100), VEGFR3 (AF743, R&D Systems, 1:100), Neuropilin 1 (ab81321, Abcam, 1:100), Neuropilin 2 (AB10522, Millipore, 1:200), Plexin D1 (SC-67145, Santa Cruz, 1:200), Unc5b (ab104871, Abcam, 1:200), Robo 4 (ab10547, Abcam, 1:100), Biotin-conjugated CD45 (553077, Becton Dickinson, 1:100), Biotin-conjugated Ter-119 (553672, Becton Dickinson, 1:100),
For visualizing vascular lumina in the angiogenic front, tetramethyl rhodamine-conjugated fixable dextran of 2,000,000MW (Invitrogen, D7139) was perfused through the heart of deeply anaesthetized mice. Mice were sacrificed after 10 min and bones were processed further.
For labelling of proliferating cells, mice were intraperitoneally injected with 300µg EdU (Invitrogen) 3 hr before euthanasia. Tibiae were immediately collected and processed as mentioned earlier. The bone sections were immunostained for EDU using Click-iT chemistry following the manufacturer’s protocols (Invitrogen).
For metabolically labeling with the hypoxia probe pimonidazole (Pimo, Hypoxyprobe Inc.), mutant and control mice were intraperitoneally injected with 60 mg/kg Pimo for 2 hr before euthanasia. Metabolized Pimo was detected by a rabbit antiserum against the non-oxidized, protein-conjugated form of pimonidazole (Hypoxyprobe Inc.).
Image acquisition, processing and quantitative analysis
Immunofluorescent stainings were analysed at high resolution with a Zeiss LSM-780 laser scanning confocal microscope. Z-stacks of images were processed and 3D reconstructed with the Imaris software (version 7.00, Bitplane). Imaris, Image J, Photoshop and Illustrator (Adobe) softwares were used for image processing, in compliance with Nature’s guide for digital images.
For all quantifications, a region of 300-400 µm from growth plate towards the caudal region was selected for all cell number quantifications in the metaphysis. All quantifications were done with Imaris and Image J software on high-resolution confocal images.
Mesenchymal cell culture and differentiation
Primary mesenchymal cells were isolated from mouse bone and cultured following published protocols27,28. In brief, freshly isolated long bones were crushed and then digested with collagenase at 37°C for 1 hr. Cells and small bone chips were washed thoroughly and cultured in 2% FBS containing alpha-MEM for few days until adherent mesenchymal cells had migrated out from the bone fragments. The adherent cells were passaged further and maintained at 37°C with 5% CO2 in a humidified atmosphere. For osteogenic differentiation, StemXVivo osteogenic basal medium and its supplement (RnD systems, CCM009) were used. Continuous treatment of recombinant mouse Noggin (500ng/ml, R&D systems) was provided to cells and, after 28 days, the appearance of mineral nodules and mesenchymal progenitors was analysed using Alizarin red and alkaline phosphatase staining, respectively.
Quantitative RT-PCR (qRT-PCR)
For the analysis of mRNA expression levels, pure endothelial cell fractions were flow-sorted directly into the lysis buffer of RNeasy Mini Kit (QIAGEN). Total RNA was isolated according to manufacturer’s protocol. A total of 100-500 ng RNA per reaction was used to generate cDNA with the iScript cDNA Synthesis System (Bio-Rad). Quantitative PCR (qPCR) was performed using TaqMan gene expression assays on ABI PRISM 7900HT Sequence Detection System. The FAM-conjugated TaqMan probes Kdr, Flt4, membrane isoform Flt1, customised sFlt1, Nrp1, Plexind1, Unc5b, Robo4, Ntn1, Ntn3, Dll4, Jag1, Efnb2, Ephb4, Hes1, Hey1, Hey2, Hes5, Icam1, Angpt2, Cdh5, Cldn5, Pecam1, Cdkn2a, Cdkn1a, Cdkn1b, Ccnd1, Cdk2, Cdk4, Tgfb1, Tgfb2, Tgfb3, Bmp2, Bmp4, Nog, Chrd, Cer1, Fgf1, Fgf8, Wnt1, Wnt3a, Wnt5a, Wnt10b, Dkk1, and Pgf were used along with TaqMan Gene Expression Master Mix (Applied Biosystems) to perform qPCR. Gene expression assays were normalized to the endogenous VIC-conjugated Actb probes as control. For the analysis of Bgalp, Ibsp and Vegfa expression, RNA was isolated from the whole bone samples of mutants and littermate control animals. Freshly dissected femurs were immediately flushed (to remove hematopoietic cells), crushed and then lysed in lysis buffer. RNA isolation, cDNA preparation and qPCR were performed as described above.
Flow cytometry
For flow cytometric analysis of ECs, femurs and tibiae were collected, cleaned thoroughly to remove the adherent muscles and then crushed in ice cold PBS with a mortar and pestle. Whole bone marrow was digested with Collagenase at 37°C for 20 min. Cells were counted and equal numbers of cells were subjected to immunostaining. Cells were stained with biotin-coupled CD45 (BD, 553077) and Ter119 (BD, 559971) antibodies for 45min. After washing in PBS, cells were stained with Streptavidin PE-Cy5 (BD, 554062) and CD31-conjugated with Alexa Fluor488 (R&Dsystems, FAB3628G) for 45min. After washing, data was acquired on FACS Aria II or FACS Canto flow cytometers and analysed using FACSDiva software (Version 6.0, BD Bioscience). For analysis and sorting of CD31hi/Emcnhi ECs, first standard quadrant gates were set. Subsequently, to differentiate CD31hi/Emcnhi cells from the total double positive cells in quadrant 2, gates were arbitrarily set at >104 log Fl-4 (CD31-APC) fluorescence and >104 log Fl-2 (Endomucin-PE) fluorescence.
Micro-CT analysis, histomorphometry and electron microscopy
Tibiae were collected from mutants and their littermate controls; the attached soft tissue in the bone was removed thoroughly and fixed in 2% paraformaldehyde. The fixed tibiae were analysed using micro-CT (µCT 35) and software IPL V5.15 at Scanco Medical AG, Switzerland. A voxel size of 12µm was chosen in all three spatial dimensions. For each sample, 148 from 232 slices were evaluated covering a total of 1.776mm at a voltage of 70kVp, intensity 114µA, and integration time 1200ms.
Calcein double labelling was performed to calculate Bone Formation Rate (BFR) and mineral apposition rate (MAR). Mice were given intraperitoneal injections of 10 mg/kg calcein (Sigma, C0875) dissolved in 2% sodium bicarbonate solution at 10th day and 3rd day before euthanasia. Bones were fixed in 4% PFA, embedded in 8% gelatin and 2% PVP and cryosectioned. Single plane images were acquired from the sections using LSM 780 (Carl Zeiss). Sections were stained with von Kossa method to assess mineralized bone. Representative images show cortical bone (diaphysis about 3mm proximally from the growth plate). Mineral Apposition Rates were calculated from both cortical and trabecular bones. The latter were measured at the proximal part of trabeculae relative to the angiogenic front in the metaphysis. Osteoclast surface/bone surface (Oc. S/BS; %) and osteoclast number/bone perimeter (No. Oc./B. Pm) were calculated based on Calcitonin receptor staining of bone sections.
For electron microscopy, freshly collected femurs were processed similar to the protocol published earlier29. In brief, fresh bone was directly transferred into 4% paraformaldehyde, 0.5% glutaraldehyde in 0.1 M cacodylate buffer (pH 7.2), cut and fixed initially for 2 hr at RT and overnight at 4°C. Bone was decalcified in 5% EDTA in 0.1 M cacodylate buffer (pH 7.2) for 3 days. The sample was post-fixed for 1.5 h in 1% OsmO4, 1.5% potassium ferrocyanide. Dehydration and embedding in epon was done under slight vacuum. In all, 70 nm ultrathin sections of the sample were taken in the area of interest and collected on filmed single slot copper grids (Leica UC6 ultramicrotome, Vienna, Austria). Sections got counterstained with uranyl acetate and lead, and were analysed at 80 kV on a FEI-Tecnai 12 electron microscope (FEI, Eindhoven, The Netherlands). Pictures were taken with imaging plates (Ditabis, Pforzheim, Germany).
Statistics
All data are presented as mean ± s.e.m. The significance of difference in the mean values was determined using two-tailed Student’s t test unless otherwise mentioned. P < 0.05 was considered significant. In others, non-parametric one-way ANOVA was performed along with Bonferroni’s multiple comparison post-hoc tests to assess statistical significance with a 95% confidence interval. All calculations were performed using Graphpad Prism software. No randomization or blinding was used and no animals were excluded from analysis. Sample sizes were selected on the basis of previous experiments. Several independent experiments were performed to guarantee reproducibility of findings.
Supplementary Material
Supplementary Information is linked to the online version of the paper at www.nature.com/nature.
Extended Data
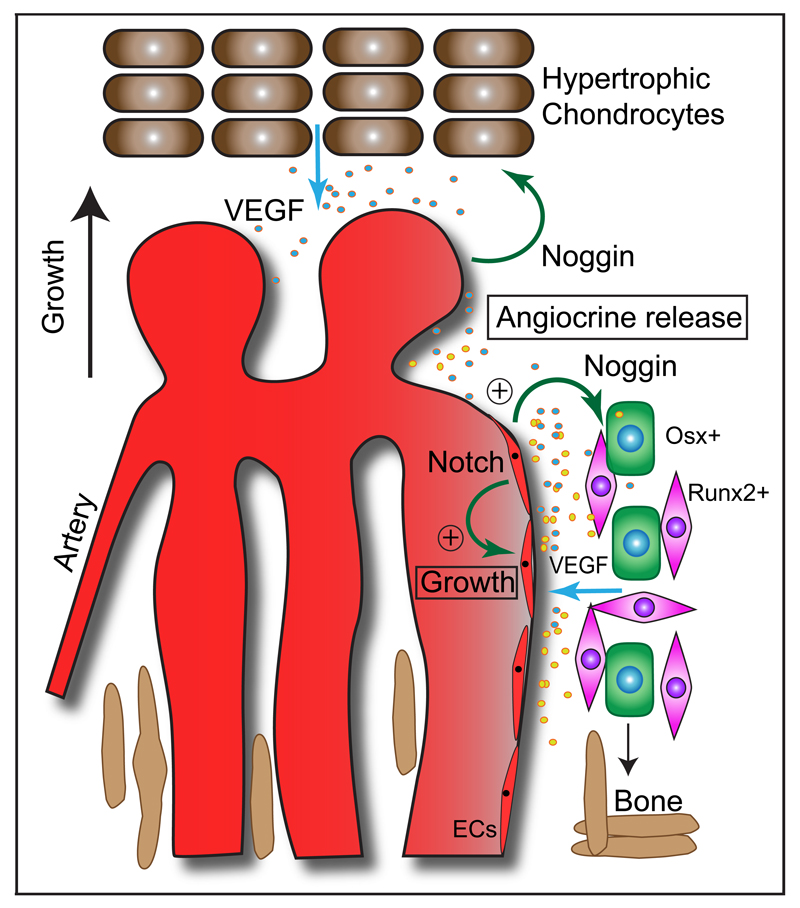
Extended Data Figure 1. Schematic representation of key findings.
Organisation and role of growing vessels in the regulation of osteogenesis in postnatal long bone. Endothelial columns, which are embedded between segments of forming trabecular bone in the metaphysis, are interconnected by arches at their distal end. Blind-ended, lumen-containing protrusions extend from arches towards growth plate chondrocytes, a key source of VEGF-A. Endothelial Notch signalling promotes EC proliferation and vessel growth in bone, which is the opposite of its role in other tissues. Notch activity in ECs is also required for endothelial Noggin expression, controls the differentiation of perivascular osteoprogenitor cells and thereby osteogenesis. Endothelial Notch signalling and Noggin also promote chondrocyte maturation and hypertrophy, which affects angiogenesis through VEGF-A expression. These signalling interactions between different cell types couple angiogenesis and osteogenesis.
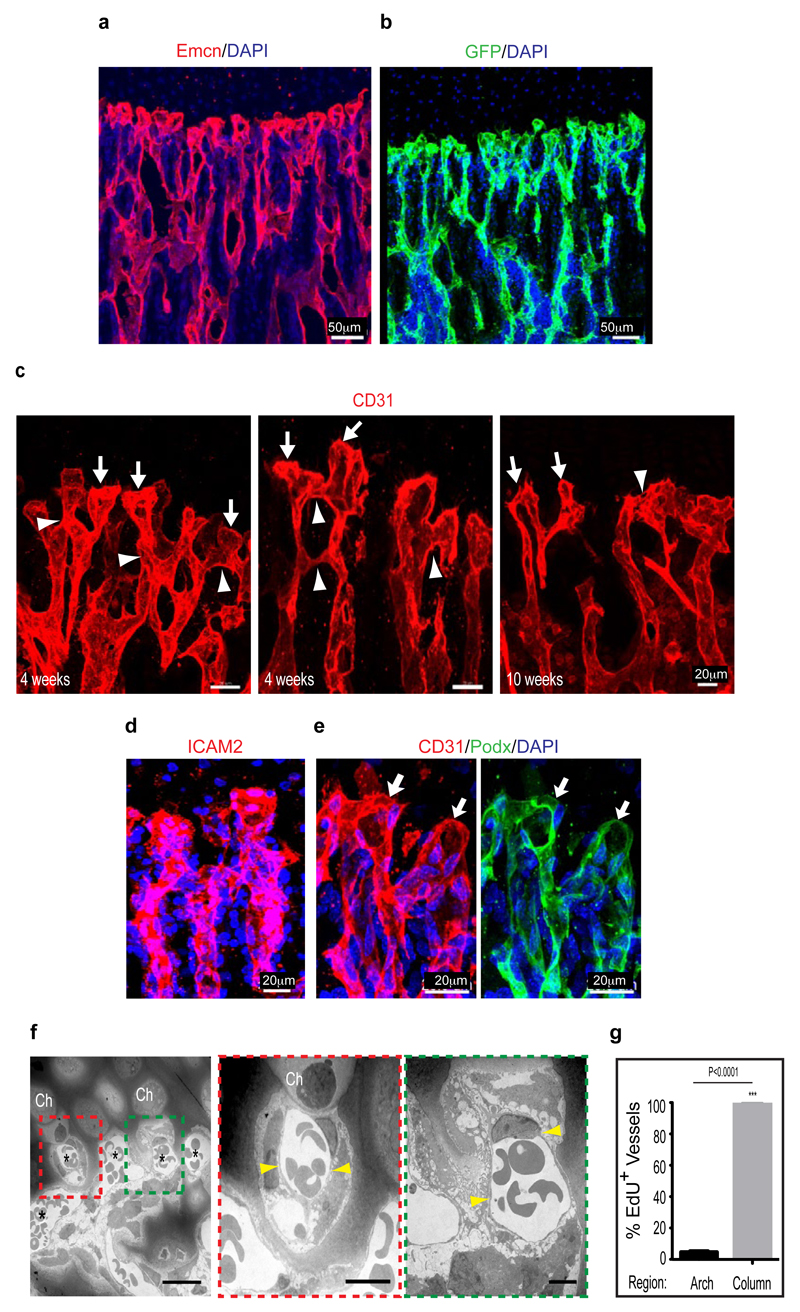
Extended Data Figure 2. Vessel growth in the postnatal metaphysis.
a, b, Organisation of distal vessels in the metaphysis of 4 week-old tibia. Endothelial cells were visualized by anti-Endomucin (Emcn, red) immunostaining (a) or GFP expression (green) in Cdh5(PAC)-CreERT2 Rosa26-mT/mG double transgenic mice (b) at 4 weeks of age. Note blunt appearance of most distal vessels (top) in proximity of growth plate chondrocytes. Nuclei, blue (DAPI).
c, Maximum intensity projection showing the organisation of distal, CD31-immunostained (type H) vessels in the tibial metaphysis at the indicated ages. Note emergence of blunt and blind-ended bulb-like protrusions (arrows) from arch vessels (arrowheads) at the distal end of endothelial columns.
d, Confocal image showing expression of intercellular adhesion molecule 2 (ICAM2, red), a marker of lumenised vessels, in distal vessels of the tibial metaphysis. Nuclei, blue (DAPI).
e, Podocalyxin (Podx, green), a sialoglycoprotein marking the apical surface of ECs and thereby the vascular lumen (arrows), is present on the most distal, CD31-positive (red) vessel structures in the metaphysis. Nuclei, blue (DAPI).
f, Transmission electron microscopy confirming the lumenised nature of distal vessels close to growth plate chondrocytes (ch). Yellow arrowheads indicate thin ECs lining vessels.
g, Quantitation of EdU labelled (proliferating) ECs in the metaphysis of long bone. EdU+ ECs were predominantly present in columnar vessels and were comparably rare (≤5%) in vascular arches (n=5 mice from 3 independent experiments). Error bars, ± s.e.m. P values, two-tailed unpaired t-test.
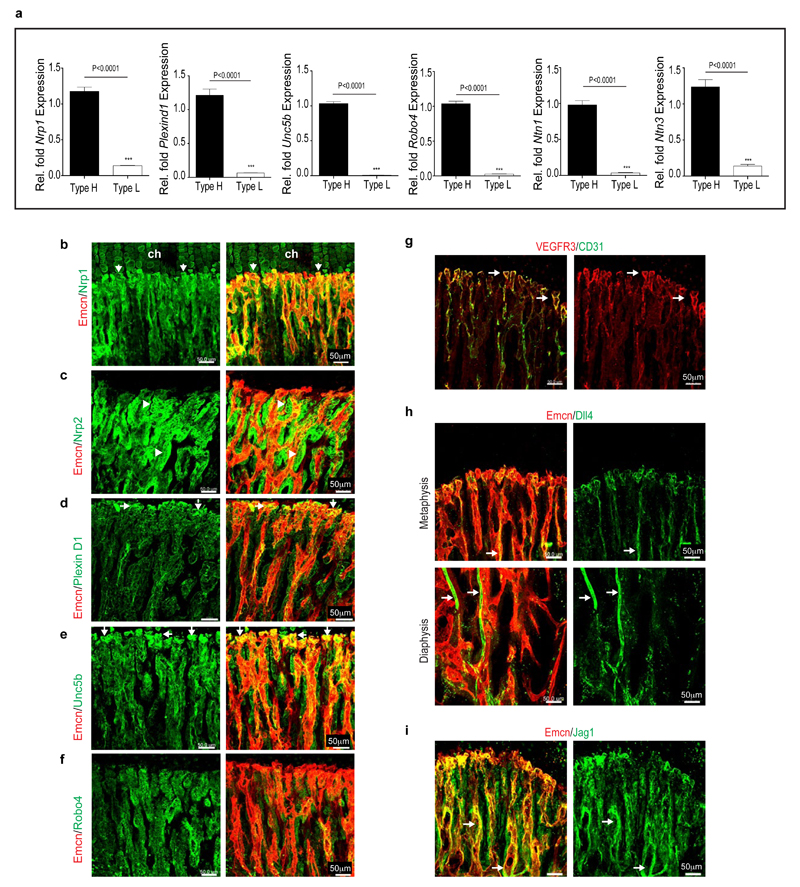
Extended Data Figure 3. Marker expression in arch and bulb ECs.
a, Quantitative real time PCR analysis of transcripts encoding vessels guidance molecules in type H and type L ECs isolated by FACS from 4 week-old femur. Note high levels of transcripts for Netrin-1 (Ntn1), Netrin-3 (Ntn3), Neuropilin 1 (Nrp1), Plexin D1 (Plxnd1), Unc5b, and Robo4 in type H relative to type L endothelium (n=5 mice from 4 independent experiments). Error bars, ± s.e.m. P values, two-tailed unpaired t-test.
b-f, Confocal images showing immunostaining of vessel guidance molecules such as Neuropilin 1 (b, Nrp1), Neuropilin 2 (c, Nrp2), Plexin D1 (d), Unc5b (e), Robo4 (f) in metaphyseal (type H) vessels and surrounding mesenchymal cells. High levels of Nrp1 were detected in type H ECs (arrows), but comparably lower expression was also observed in vessel-associated osteoprogenitors and growth plate chondrocytes (ch). Nrp2 is highly expressed in perivascular osteoprogenitors (arrowheads). High expression of PlexinD1 and Unc5b, and lower levels of Robo4 were detected in type H vessel bulbs and columns (arrows).
g, Maximum intensity projection showing high expression of VEGFR3 in endothelial bulbs and arches (white arrows) compared to columns. VEGFR3 was absent in the arteries.
h, Image showing Dll4 expression in type H ECs forming bulbs and arches in 4 week-old tibial metaphysis. With the exception of arteries (arrows), Dll4 expression was low in vessels of the diaphysis.
i, Jag1 expression was detected in ECs (white arrows) and surrounding mesenchymal cells.
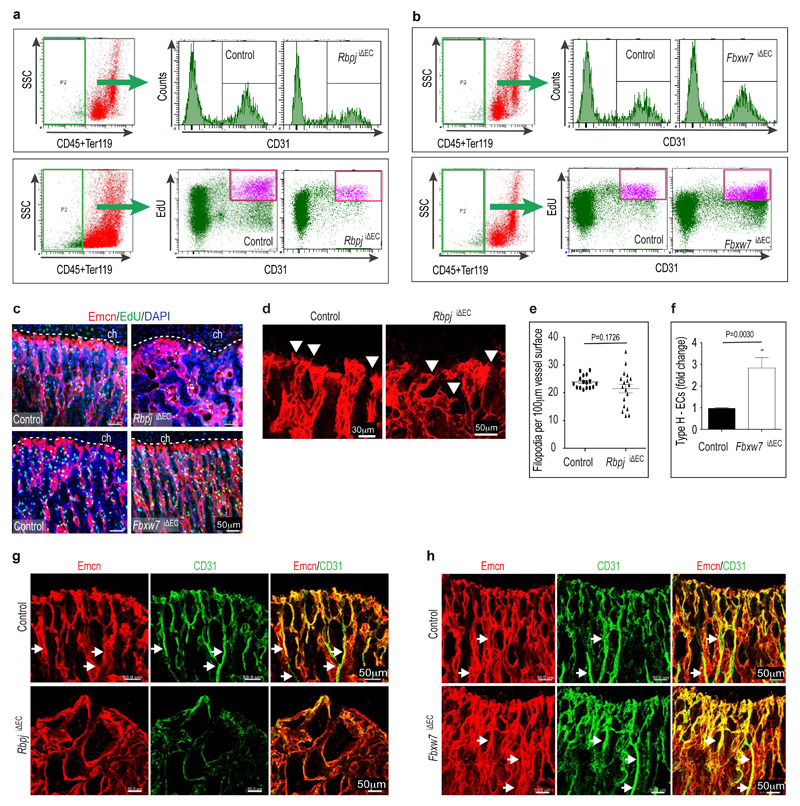
Extended Data Figure 4. EC numbers, proliferation and Type H vessels in Notch mutants.
a,b, Representative flowcytometric graph plots showing the quantification of total and EdU-labelled ECs from RbpjiΔEC (a) or Fbxw7iΔEC (b) mutant bones or corresponding littermate controls, as indicated. CD31+ CD45- Ter119- ECs were substantially reduced in RbpjiΔEC mutants (a). Conversely, endothelial cell number and proliferation were increased after inactivation of Fbxw7 (b).
c, Maximum intensity projections of EdU-labelled (green fluorescence) tibial metaphysis showing proliferating cells in 4week-old Notch gain-of-function (Fbxw7iΔEC) and loss-of-function (RbpjiΔEC) mutants and corresponding littermate controls. ECs were visualised by Emcn immunostaining (red) and nuclei by DAPI (blue).
d, Confocal images of Emcn (red) immunostained endothelial distal columns and arches next to growth plate chondrocytes (ch) highlighting the distribution of filopodia (arrowheads). Note that filopodia were directed towards chondrocytes in controls whereas directionality was compromised in RbpjiΔEC mutants.
e, Quantitation of filopodia indicating higher variability in RbpjiΔEC samples (n=6 mice from 4 independent litters). Error bars, ± s.e.m. P values, two-tailed unpaired t-test.
f, Quantitative analysis of type H vessels in 4 week-old Fbxw7iΔEC mutants and littermate controls (n=6 mice from 4 independent litters). Error bars, ± s.e.m. P values, two-tailed unpaired t-test.
g,h, Maximum intensity projections of CD31 (green) and Endomucin (red) immunostained vessels in the metaphysis of 4 week-old RbpjiΔEC (g) and Fbxw7iΔEC mutants (h). Note loss of type H vessels and decreased CD31 (green) staining in the RbpjiΔEC metaphysis, while CD31+ vessels were extended after EC-specific inactivation of Fbxw7. Arrows indicate arteries.
Extended Data Figure 5. Arterial specification and VEGF receptor expression in Notch mutants.
a, Maximum intensity projections of Emcn (red,) and CD31 (green) immunostained sections of 4 week-old tibia showing increase in CD31+ (type H) vessels in Fbxw7iΔEC mice. Mutants also displayed numerous small CD31+ Endomucin-arterioles (white arrows), which were associated with αSMA+ cells (blue arrows in bottom panels).
b-d, Confocal images showing 4 week-old RbpjiΔEC or Fbxw7iΔEC mutant, or corresponding littermate control metaphysis after immunostaining for different VEGF receptors. VEGFR2 was highest on control arches, bulbs and arteries, and staining was strongly reduced in the RbpjiΔEC metaphysis (b). VEGFR3 immunostaining decorated arches and bulb protrusion but was absent in the arteries. Staining was reduced in RbpjiΔEC mutants but enhanced in Fbxw7iΔEC vessels (c). Expression of VEGFR1 was predominantly found on perivascular mesenchymal and osteoprogenitor cells. Expression in these populations was not appreciably altered (d).
e, f, qPCR analysis of sorted ECs from Notch loss-of-function (RbpjiΔEC, e) and gain-of-function (Fbxw7iΔEC, f) mice. In ECs, Notch positively regulated transcripts for the receptors VEGFR2 (Kdr), VEGFR3 (Flt4), and membrane-anchored VEGFR1 (mFlt1). In contrast, expression of soluble Flt1 (sFlt1), a known antagonist of VEGF signalling, was increased in RbpjiΔEC ECs and significantly reduced in Fbxw7iΔEC cells (n=4 mice from 4 independent litters). Error bars, ± s.e.m. P values, two-tailed unpaired t-test.
g, Increased formation of CD31+ (red) vessels in the metaphysis of 4 week-old Notch gain-of-function mice after EC-specific overexpression of active Notch (NICDiOE-EC). Nuclei, blue (DAPI).
h, Confocal images showing extensive formation of CD31+ (green) Emcn- (red) arterioles (arrows) in the NICDiOE-EC metaphysis. Nuclei, DAPI (blue).
Extended Data Figure 6. Gene expression in Rbpj mutant bone and lung ECs.
a, qPCR analysis of freshly isolated ECs from control and RbpjiΔEC mutant lung or bone. Relative fold mRNA expression of Notch target genes such as Dll4, Jag1, Efnb2, EphB4, Hes1, Hey1, Hey2 is shown. Differently expressed genes are marked in red (n=4 mice from 4 independent litters). Error bars, ± s.e.m. P values, two-tailed unpaired t-test.
b, Quantitative PCR analysis of expression the Notch target gene Hes5 in sorted ECs from 4 week-old wild-type bone and lung (a), and from RbpjiΔEC mutant and littermate control bone samples (b). Note very low expression of Hes5 in lung compared to bone ECs and its reduction in the RbpjiΔEC mutant bone endothelium. Data represent relative fold mRNA expression (n=4 mice from 4 independent litters). Error bars, ± s.e.m. P values, two-tailed unpaired t-test.
c, qPCR results for transcripts encoding Intercellular Adhesion Molecule 1 (Icam1), angiopoietin 2 (Angpt2), VE-cadherin (Cdh5), and CD31 (Pecam1). Data represent relative fold mRNA expression. Differently expressed genes are marked in red (n=4 mice from 4 independent litters). Error bars, ± s.e.m. P values, two-tailed unpaired t-test.
d, Relative fold mRNA expression of cyclin-dependent kinase inhibitor 2A (Cdkn2a), cyclin-dependent kinase inhibitor 1A (Cdkn1a), cyclin-dependent kinase inhibitor 1B (Cdkn1b), cyclin D1 (Ccnd1), cyclin-dependent kinase 2 (Cdk2), and cyclin-dependent kinase 4 (Cdk4) in control or RbpjiΔEC mutant lung and bone ECs (n=4 mice from 4 independent litters). Error bars, ± s.e.m. P values, two-tailed unpaired t-test.
Extended Data Figure 7. Endothelial Notch controls osteogenesis.
a-i, Analysis of bone parameters in 4 week-old RbpjiΔEC mutants and control littermates. Data on femur length is shown in (a). Connectivity density (number of connections per unit volume, b), trabecular bone separation (size of space separating trabeculae, c), trabecular number (number of trabeculae per mm length, d) were obtained by µ-CT. Mineral Apposition Rates (MAR, e) were calculated using calcein double labelling. Data on osteoclast number per bone perimeter (f), osteoclast surface per bone surface (g), osteoid percentage (h), and osteiod thickness (i) are based on histomorphometrical characterization of control and mutant samples (n=6 mice from 4 independent litters). Error bars, ± s.e.m. P values, two-tailed unpaired t-test.
j, Osteoclasts were identified by immunostaining for Calcitonin Receptor (green). Maximum intensity projection of Calcitonin receptor stained metaphysis region of tibial sections of Notch gain-of-function (Fbxw7iΔEC) and loss-of-function (RbpjiΔEC) mutants along with their respective littermate controls. Nuclei, DAPI (blue).
k-t, Analysis of bone parameters in 4 week-old Fbxw7iΔEC mutants and control littermates. Femur length is shown in (k). µ-CT data (l) were used for the analysis of bone density (bone volume/total volume; BV/TV, m), connectivity density (number of connections per unit volume, n), trabecular bone separation (size of space separating trabeculae, o), trabecular number (number of trabeculae per mm length, p), and trabecular thickness (q). Data on osteoclast number per bone perimeter (r), osteoid percentage (s), and osteiod thickness (t) are based on histomorphometrical characterization of control and mutant samples (n=6 mice from 4 independent litters). Error bars, ± s.e.m. P values, two-tailed unpaired t-test.
Extended Data Figure 8. Endothelial Notch controls mesenchymal cell differentiation.
a, Confocal images showing immunostaining for mesenchymal lineage markers Osx (green) and Runx2 (red) in Fbxw7iΔEC and littermate control tibiae, as indicated. Nuclei, DAPI (blue). Note reduction of Osx+ cells and increased Runx2+ population after targeting of Fbxw7 in ECs.
b, Analysis of differentiation capacity of primary mesenchymal cells isolated from RbpjiΔEC or control bone. Alizarin Red S staining after 10 days in vitro (10 div) showed that mesenchymal cells isolated from EC-specific RbpjiΔEC mutants generated mineral nodules (red arrows) prematurely in comparison to controls.
c,d, Maximum intensity projection of stained RbpjiΔEC and control tibiae. Labelling of hypoxic cells with pimonidazole (Pimo, green) showed no overt differences between control and RbpjiΔEC samples (c). Likewise, anti-HIF1α immunostaining (green) was comparable in the control and RbpjiΔEC metaphysis (d). Endothelial cells (Emcn antibody staining, red); nuclei, DAPI (blue).
e, Representative confocal images showing that EC-specific gene targeting of Jaggedl (Jag1) or Delta-like 1 (D11 1) did not lead to appreciable alterations Jag1iΔEC or Dll1iΔEC mutant metaphyseal vasculature at 4 weeks. Dashed lines indicate vessel columns (C) and distal arches (A). Endothelial cells, CD31 (red); nuclei, DAPI (blue).
f, Smaller size of freshly isolated femurs from 4 week-old Dll4iΔEC mutants relative to littermate controls.
g, Disrupted organisation of vessel arches (A) and columns (C) in the Dll4iΔEC metaphyseal vasculature. Endothelial cells, CD31 (red); nuclei, DAPI (blue).
h, Quantitative analysis of size of chondrocyte proliferating zone in littermate control and RbpjiΔEC mutants (n=6 mice from 4 independent litters). Error bars, ± s.e.m. P values, two-tailed unpaired t-test.
i,j, Quantification of Sox9 (i) and VEGF-A (j) fluorescence intensity in immunostained sections of RbpjiΔEC mutants showing decreased signals in mutant growth plates (n=4 mice from 3 independent litters). Error bars, ± s.e.m. P values, two-tailed unpaired t-test.
k, Maximum intensity projection of stained RbpjiΔEC and littermate control tibiae showing decreased VEGF-A immunosignals.
Extended Data Figure 9. EC-dependent regulation of growth plate and bone.
a-c, Quantitative analysis of growth plate of Fbxw7iΔEC mutants and their littermates-growth plates (a), proliferating zones (b) and maturation/hypertrophy zones (c) relative to their respective control littermates (n=4 mice from 3 independent litters). Error bars, ± s.e.m. P values, two-tailed unpaired t-test.
d, e, Quantitative PCR analysis of Vegfa transcripts level in the bones (without marrow cells) of Notch mutants (RbpjiΔEC and Fbxw7iΔEC) and respective littermate controls (n=4 mice from 3 independent litters). Error bars, ± s.e.m. P values, two-tailed unpaired t-test.
f, g, Maximum intensity projection of stained Fbxw7iΔEC and littermate control tibiae. Note slight reduction of mutant growth plate and maturation/hypertrophy zone (MHZ) EdU (red) labelling (f) marks mitotic chondrocytes in the proliferating zone (PZ). Sox9 (green) immunosignals (g) label maturing and hypertrophic chondrocytes. Dashed lines mark borders of PZ and MHZ. Nuclei, DAPI (blue).
h, Maximum intensity projections of tile scanned tibial sections of Col1a1-CreERT2 ROSA26-mT/mG double transgenic mice. GFP expression (green) indicates Cremediated recombination.
i, Maximum intensity projections showing overlapping GFP (green) and Col1α immunostaining (red).
j, Maximum intensity projections showing osteoblasts expressing GFP (green). GFP signals were not seen in Emcn immunostained ECs (red).
k, Normal arrangement of CD31-stained endothelial columns (C) and arches (A) after Col1a1-CreERT2-mediated inactivation of Rbpj in cells of the osteoblast lineage (RbpjiΔOB). Nuclei, DAPI (blue).
l, m, Maximum intensity projections tile-scanned tibia sections after anti-Emcn (red) immunostaining. Nuclei, DAPI (blue). Note profound disorganisation of the Dll4iΔEC metaphyseal vasculature (l) and restoration by simultaneous EC-specific overexpression of active Notch in Dll4iΔEC/NICDiOE-EC double mutant mice (m).
n, Tile scan confocal images of osteopontin (Opn, green) stained control and Dll4iΔEC/NICDiOE-EC tibiae showing that endothelial NICD expression can rescue trabecular bone defects in the Dll4iΔEC background (see Fig. 2c for comparison).
o, Organisation of the Emcn-stained metaphyseal vasculature and arrangement of osteoblasts (Osx) in tibia section from 4 week-old control, Dll4iΔEC, NICDiOE-EC, and Dll4iΔEC/NICDiOE-EC mice, as indicated. Nuclei, DAPI (blue).
p, Sox9 immunostaining (green) in the epiphyseal region of 4-week old tibia showing normalised maturing and hypertrophic chondrocytes zone (MHZ) in the growth plate of Dll4iΔEC/NICDiOE-EC mice. Dashed lines mark borders of MHZ. Nuclei, DAPI (blue).
Extended Data Figure 10. Notch and angiocrine Noggin production.
a, Noggin (green) in the wild-type tibial metaphysis was detected in Emcn+ (red) ECs as well as surrounding mesenchymal cells. In contrast, the diaphysis contained Noggin+ hematopoietic cells, whereas only weak staining was seen in sinusoidal blood vessels.
b, Panels show higher magnifications of insets in (a). Nuclei, DAPI (blue).
c, Confocal tile scans of osteopontin-immunostained tibia sections showing partial restoration of trabecular bone formation in 4week-old RbpjiΔEC mice after administration of recombinant Noggin. Left panels show Saline-treated RbpjiΔEC mutants and littermate controls. Nuclei, DAPI (blue).
d,e, Noggin treatment restored the bone formation rate (BFR, d) and mineral apposition rate (MAR, e) in RbpjiΔEC long bone to control level (n=6 mice from 4 independent litters). Data represent mean±s.e.m. One-way ANOVA was performed along with Bonferroni’s multiple comparison post-hoc test.
f, Systemic administration of recombinant Noggin protein reduced the number of Osx+ cells (green) and increased Runx2+ early osteoprogenitors in the RbpjiΔEC metaphysis in comparison to vehicle-treated (Saline) mutants.
g, Maximum intensity projection of Emcn-immunostained of control and RbpjiΔEC tibia sections after treatment with Saline or recombinant Noggin, as indicated. Emcn staining intensity was increased in Noggin-treated RbpjiΔEC samples, and the organisation of endothelial column and arch structures was partially restored. Dashed lines indicate position of boundaries between endothelial arches (A) and columns (C) as seen in littermate control samples.
h, i, Confocal images of VEGF-A (green) immunostained tibia sections showing growth plate chondrocytes in RbpjiΔEC mice after Noggin treatment. Note partial restoration of VEGF-A expression in Noggin- but not vehicle control-treated (Saline) RbpjiΔEC mutants (h). Nuclei, DAPI (blue). Quantification data showing fluorescence intensity (in arbitrary units) of VEGF-A expression recovered in the tibial sections of these animals (i) (n=6 mice from 4 independent litters). Data represent mean ± s.e.m. One-way ANOVA was performed along with Bonferroni’s multiple comparison post-hoc test.
Acknowledgements
We thank A. Duarte, F. Radtke and T. Honjo for floxed Dll4 and Rbpj mutant mice, A. Borgscheiper for technical assistance, M. Stehling for EC sorting, D. Zeuschner for electron microscopy. Funding was provided by the Max Planck Society, the University of Münster and the European Research Council (AdG 339409 AngioBone).
Footnotes
Author Contributions. S.K.R., A.P.K and R.H.A. designed experiments and interpreted results. S.K.R. generated and characterized mouse mutant lines. S.K.R. and A.P.K. did all experiments including FACS, qRT-PCR, bone sectioning and staining, confocal imaging, and quantifications. L.W. performed analysis of bone vessel ultrastructure. S.K.R. and R.H.A. wrote the manuscript.
The authors do not declare competing financial interests.
References
- 1.Eshkar-Oren I, et al. The forming limb skeleton serves as a signaling center for limb vasculature patterning via regulation of Vegf. Development. 2009;136:1263–1272. doi: 10.1242/dev.034199. [DOI] [PubMed] [Google Scholar]
- 2.Maes C, et al. Osteoblast precursors, but not mature osteoblasts, move into developing and fractured bones along with invading blood vessels. Dev Cell. 2010;19:329–344. doi: 10.1016/j.devcel.2010.07.010. [DOI] [PMC free article] [PubMed] [Google Scholar]
- 3.Benedito R, et al. The notch ligands Dll4 and Jagged1 have opposing effects on angiogenesis. Cell. 2009;137:1124–1135. doi: 10.1016/j.cell.2009.03.025. [DOI] [PubMed] [Google Scholar]
- 4.Noguera-Troise I, et al. Blockade of Dll4 inhibits tumour growth by promoting non-productive angiogenesis. Nature. 2006;444:1032–1037. doi: 10.1038/nature05355. [DOI] [PubMed] [Google Scholar]
- 5.Skawina A, Litwin JA, Gorczyca J, Miodonski AJ. The vascular system of human fetal long bones: a scanning electron microscope study of corrosion casts. J Anat. 1994;185:369–376. [PMC free article] [PubMed] [Google Scholar]
- 6.Trueta J, Morgan JD. The vascular contribution to osteogenesis. I. Studies by the injection method. J Bone Joint Surg Br. 1960;42-B:97–109. doi: 10.1302/0301-620X.42B1.97. [DOI] [PubMed] [Google Scholar]
- 7.Kuhn A, et al. Expression of endomucin, a novel endothelial sialomucin, in normal and diseased human skin. J Invest Dermatol. 2002;119:1388–1393. doi: 10.1046/j.1523-1747.2002.19647.x. [DOI] [PubMed] [Google Scholar]
- 8.Kusumbe AP, Ramasamy SK, Adams RH. Coupling of angiogenesis and osteogenesis by a specific vessel subtype in bone. Nature. doi: 10.1038/nature13145. [DOI] [PMC free article] [PubMed] [Google Scholar]
- 9.Siekmann AF, Lawson ND. Notch signalling limits angiogenic cell behaviour in developing zebrafish arteries. Nature. 2007;445:781–784. doi: 10.1038/nature05577. [DOI] [PubMed] [Google Scholar]
- 10.Hoeck JD, et al. Fbw7 controls neural stem cell differentiation and progenitor apoptosis via Notch and c-Jun. Nature Neurosci. 2010;13:1365–1372. doi: 10.1038/nn.2644. [DOI] [PubMed] [Google Scholar]
- 11.Izumi N, et al. Fbxw7 controls angiogenesis by regulating endothelial Notch activity. PLoS One. 2012;7:e41116. doi: 10.1371/journal.pone.0041116. [DOI] [PMC free article] [PubMed] [Google Scholar]
- 12.Nakashima K, et al. The novel zinc finger-containing transcription factor osterix is required for osteoblast differentiation and bone formation. Cell. 2002;108:17–29. doi: 10.1016/s0092-8674(01)00622-5. [DOI] [PubMed] [Google Scholar]
- 13.Hozumi K, et al. Delta-like 1 is necessary for the generation of marginal zone B cells but not T cells in vivo. Nature Immunol. 2004;5:638–644. doi: 10.1038/ni1075. [DOI] [PubMed] [Google Scholar]
- 14.Koch U, et al. Delta-like 4 is the essential, nonredundant ligand for Notch1 during thymic T cell lineage commitment. J Exp Med. 2008;205:2515–2523. doi: 10.1084/jem.20080829. [DOI] [PMC free article] [PubMed] [Google Scholar]
- 15.Brooker R, Hozumi K, Lewis J. Notch ligands with contrasting functions: Jagged1 and Delta1 in the mouse inner ear. Development. 2006;133:1277–1286. doi: 10.1242/dev.02284. [DOI] [PubMed] [Google Scholar]
- 16.Olave I, Reinberg D, Vales LD. The mammalian transcriptional repressor RBP (CBF1) targets TFIID and TFIIA to prevent activated transcription. Genes Dev. 1998;12:1621–1637. doi: 10.1101/gad.12.11.1621. [DOI] [PMC free article] [PubMed] [Google Scholar]
- 17.Gerber HP, et al. VEGF couples hypertrophic cartilage remodeling, ossification and angiogenesis during endochondral bone formation. Nature Med. 1999;5:623–628. doi: 10.1038/9467. [DOI] [PubMed] [Google Scholar]
- 18.Engin F, et al. Dimorphic effects of Notch signaling in bone homeostasis. Nature Med. 2008;14:299–305. doi: 10.1038/nm1712. [DOI] [PMC free article] [PubMed] [Google Scholar]
- 19.Hilton MJ, et al. Notch signaling maintains bone marrow mesenchymal progenitors by suppressing osteoblast differentiation. Nature Med. 2008;14:306–314. doi: 10.1038/nm1716. [DOI] [PMC free article] [PubMed] [Google Scholar]
- 20.Potente M, Gerhardt H, Carmeliet P. Basic and therapeutic aspects of angiogenesis. Cell. 2011;146:873–887. doi: 10.1016/j.cell.2011.08.039. [DOI] [PubMed] [Google Scholar]
- 21.Wu XB, et al. Impaired osteoblastic differentiation, reduced bone formation, and severe osteoporosis in noggin-overexpressing mice. J Clin Invest. 2003;112:924–934. doi: 10.1172/JCI15543. [DOI] [PMC free article] [PubMed] [Google Scholar]
- 22.Canalis E, Brunet LJ, Parker K, Zanotti S. Conditional inactivation of noggin in the postnatal skeleton causes osteopenia. Endocrinology. 2012;153:1616–1626. doi: 10.1210/en.2011-1604. [DOI] [PMC free article] [PubMed] [Google Scholar]
- 23.Tylzanowski P, Mebis L, Luyten FP. The Noggin null mouse phenotype is strain dependent and haploinsufficiency leads to skeletal defects. Dev Dyn. 2006;235:1599–1607. doi: 10.1002/dvdy.20782. [DOI] [PubMed] [Google Scholar]
- 24.Wang Y, et al. Ephrin-B2 controls VEGF-induced angiogenesis and lymphangiogenesis. Nature. 2010;465:483–486. doi: 10.1038/nature09002. [DOI] [PubMed] [Google Scholar]
- 25.Han H, et al. Inducible gene knockout of transcription factor recombination signal binding protein-J reveals its essential role in T versus B lineage decision. Int Immunol. 2002;14:637–645. doi: 10.1093/intimm/dxf030. [DOI] [PubMed] [Google Scholar]
- 26.Murtaugh LC, Stanger BZ, Kwan KM, Melton DA. Notch signaling controls multiple steps of pancreatic differentiation. Proc Natl Acad Sci U S A. 2003;100:14920–14925. doi: 10.1073/pnas.2436557100. [DOI] [PMC free article] [PubMed] [Google Scholar]
- 27.Soleimani M, Nadri S. A protocol for isolation and culture of mesenchymal stem cells from mouse bone marrow. Nat Protoc. 2009;4:102–106. doi: 10.1038/nprot.2008.221. [DOI] [PubMed] [Google Scholar]
- 28.Zhu H, et al. A protocol for isolation and culture of mesenchymal stem cells from mouse compact bone. Nat Protoc. 2010;5:550–560. doi: 10.1038/nprot.2009.238. [DOI] [PubMed] [Google Scholar]
- 29.Suzuki H, et al. Histological evidence of the altered distribution of osteocytes and bone matrix synthesis in klotho-deficient mice. Arch Histol Cytol. 2005;68:371–381. doi: 10.1679/aohc.68.371. [DOI] [PubMed] [Google Scholar]


