

Abstract
Methods. In a cross-sectional substudy of the Multicenter AIDS Cohort Study, noncontrast cardiac computed tomography (CT) scanning for coronary artery calcium (CAC) scoring was performed on all men, and, for men with normal renal function, coronary CT angiography (CTA) was performed. Associations between fat depots (visceral adipose tissue [VAT], abdominal subcutaneous adipose tissue [aSAT], and thigh subcutaneous adipose tissue [tSAT]) with coronary plaque presence and extent were assessed with logistic and linear regression adjusted for age, race, cardiovascular disease (CVD) risk factors, body mass index (BMI), and human immunodeficiency virus (HIV) parameters.
Results. Among HIV-infected men (n = 597) but not HIV-uninfected men (n = 343), having greater VAT was positively associated with noncalcified plaque presence (odds ratio [OR] = 1.04, P < .05), with a significant interaction (P < .05) by HIV serostatus. Human immunodeficiency virus-infected men had lower median aSAT and tSAT and greater median VAT among men with BMI <25 and 25–29.9 kg/m2. Among HIV-infected men, VAT was positively associated with presence of coronary plaque on CTA after adjustment for CVD risk factors (OR = 1.04, P < .05), but not after additional adjustment for BMI. There was an inverse association between aSAT and extent of total plaque among HIV-infected men, but not among HIV-uninfected men. Lower tSAT was associated with greater CAC and total plaque score extent regardless of HIV serostatus.
Conclusions. The presence of greater amounts of VAT and lower SAT may contribute to increased risk for coronary artery disease among HIV-infected persons.
Keywords: adiposity, coronary plaque
In the general population, greater amounts of visceral adipose tissue (VAT) have been associated with pro-atherogenic lipids abnormalities [1, 2], greater insulin resistance [3], and coronary artery disease (CAD) [4]. Human immunodeficiency virus (HIV)-infected persons experience changes in body fat amount and distribution that have given rise to a characteristic anthropomorphic phenotype and include greater VAT as well as less subcutaneous abdominal and limb fat [5–7], commonly referred to as lipodystrophy. These anatomic fat alterations may impact risk for CAD. In this population, greater VAT and decreased subcutaneous fat have been associated with both pro-atherogenic serum lipid profiles and insulin resistance [8, 9] but only inconsistently with coronary artery plaque (particularly calcified plaque [CP]) or cardiovascular disease (CVD) clinical events [10, 11]. Causes for these HIV-related body fat changes are not entirely clear, but they are likely multifactorial. Factors with established positive associations with VAT and/or subcutaneous fat include duration of HIV infection, exposure to specific antiretroviral (ART) therapies (particularly use of thymidine analog reverse-transcriptase inhibitors and protease inhibitors), and patient age [12–21]. Increases in and duration of (1) systemic inflammation and (2) immune activation and host genetics are also postulated to be operative in the pathogenesis of HIV-associated body fat changes, and these factors contribute to CAD risk in the general population [22, 23].
Coronary computed tomography angiography (CTA) allows assessment of the presence, extent, and composition of coronary artery plaque. Using this technique, our group [24] and others [25] have demonstrated greater overall prevalence of coronary plaque and the presence and extent of noncalcified plaque (NCP) among HIV-infected versus uninfected persons. We hypothesized that regional adiposity is associated with coronary plaque, but that these associations may differ by HIV serostatus. We evaluated associations between coronary plaque (overall and by type and amount), body fat depots assessed by computed tomography (CT) imaging, and HIV serostatus among Multicenter AIDS Cohort Study (MACS) participants.
METHODS
Population
The MACS is an ongoing prospective cohort study of the natural and treated histories of HIV-1 infection among men who have sex with men, conducted in the Baltimore and Washington DC areas, Chicago, Pittsburgh, and Los Angeles [26]. Initial enrollment occurred in 1984–1985, with additional enrollment in 1987–1991 and 2001–2003. The cohort includes both HIV-infected and HIV-uninfected men who attend semiannual research visits that include standardized interviews, physical examinations, and blood and urine collection for laboratory measurements.
The MACS cardiovascular ancillary study participants were 40–70 years of age, weighed <300 pounds, and had no prior history of cardiac surgery or percutaneous coronary intervention. All participants completed noncontrast cardiac CT scanning for coronary artery calcium (CAC) scoring. Men with atrial fibrillation, chronic kidney disease (estimated glomerular filtration rate [GFR] in mL/min/m2 of <60 during a prior MACS study visit), or a history of intravenous contrast allergy were excluded from CTA studies. All eligible CTA participants had an estimated GFR >60 within 1 month of CTA. The study was approved by the Institutional Review Boards of all participating sites. All participants signed informed consent.
Computed Tomography Scanning and Analysis Procedures
Details of the cardiac CT scanning procedures have been described [27]. Abdominal subcutaneous and visceral adiposity measures were obtained by the addition of 1 noncontrast abdominal CT slice at the level of the umbilicus, corresponding to the L4 to L5 vertebral level, as previously described [28]. To evaluate thigh fat, a single slice scan was performed at 15 cm above the patellar apex.
Computed tomography images were transferred to the core CT reading center (Los Angeles Biomedical Research Institute at Harbor-UCLA) and were analyzed by trained, experienced readers who were blinded to participant characteristics and HIV serostatus [28]. Amounts of extra-abdominal (subcutaneous) fat were calculated by subtracting intra-abdominal fat from total abdominal fat. For thigh adiposity, manual tracings were performed to delineate subcutaneous fat and muscle compartments; muscle attenuation was measured in Hounsfield Units (HU). Areas of thigh fat, expressed in square centimeters, were calculated by summing the area of pixels in the slice with CT values from −150 to −50 HU.
Cardiac Computed Tomography
Coronary artery calcium was calculated using the Agatston method. The total plaque score (TPS) was calculated by summing the plaque size score for all assessable coronary segments that demonstrated any plaque (either CP, NCP, or mixed plaque [MP]) up to a maximum score of 45. Plaque was graded as 0, 1, 2, or 3 in each segment (15 segments) based on the size of the plaque. The segment involvement score was calculated as the sum of coronary artery segments with plaque, regardless of degree of stenosis. Each coronary segment was classified as normal or containing NCP, MP (<50% of plaque area occupied by calcium), or CP. Calcified atherosclerotic plaque was defined as any structure with attenuation >130 HU visualized separately from the intravascular lumen, identified in at least 2 independent planes. Noncalcified atherosclerotic plaque was defined as any discernible structure that could be clearly assignable to the vessel wall, with a CT density less than the contrast-enhanced coronary lumen but greater than the surrounding connective tissue, and identified in at least 2 independent planes. The NCP score, MP score, and CP score were calculated by summing the plaque scores in each NCP, MP, or CP segment separately.
Clinical Parameters
Participants were seen every 6 months at routine MACS research visits. Data were collected regarding CVD risk factors and HIV clinical parameters by history, physical examination, and blood tests. For this analysis, data were used that had been collected at the MACS study visit closest to the CT scan (within 6 months). Race or ethnicity was based on self-report. Glucose and serum lipids were measured from fasting samples. The Modification of Diet in Renal Disease equation was used to estimate GFR [29].
Hypertension was defined as systolic blood pressure (BP) >140 mm Hg or diastolic BP >90 mm Hg or self-reported use of antihypertensive medication. Diabetes mellitus was defined as fasting serum glucose ≥126 mg/dL or use of medications to treat diabetes. Measures of HIV disease activity in HIV-infected men included plasma HIV ribonucleic acid (RNA) levels, CD4+ T lymphocyte counts, history of an acquired immune deficiency syndrome (AIDS)-defining malignancy or opportunistic infection, and duration of highly active anti-retroviral therapy (HAART) use.
Statistical Analysis
The distributions of demographic and clinical factors in HIV-infected and -uninfected men were compared using the Wilcoxon rank-sum test or χ2 test. Associations between individual anatomic fat depots (VAT, abdominal subcutaneous fat [aSAT], and thigh subcutaneous fat [tSAT]) and the presence of coronary artery plaque were assessed using logistic regression. Plaque was dichotomized as present or absent with plaque presence defined as a score >0. Models were performed with adjustment for age, race or ethnicity, and established CVD risk factors (use of hypertension medications, systolic BP among those who were not on hypertension medications, use of diabetes medications, fasting glucose among those who were not on diabetes medications, use of lipid-lowering medications, total and high-density lipoprotein (HDL) cholesterol among those who did not use lipid-lowering medications, pack-years of tobacco smoking). A second model additionally adjusted for body mass index (BMI). Among HIV-infected men, fully adjusted models included adjustment for HIV clinical parameters (CD4+ T-cell count [most recent and nadir], plasma HIV RNA level, history of AIDS-defining illness, duration of HAART). Linear regression was used to assess associations between individual anatomic fat depots (VAT, aSAT, and tSAT) with plaque extent among individuals with plaque present (ie, plaque score >0) for scores of CAC, TP, CP, MP, and NCP after adjusting for age and race and CVD risk factors and then additionally for BMI as described above. Because plaque scores were not normally distributed, these values were natural-log transformed. All models included HIV-infected and uninfected men and were also performed stratified by HIV serostatus. Testing for interaction by HIV serostatus was also performed. Multiple imputation was used to complete missing CVD risk factor data for multivariate models. Missing values were imputed 5 times based on the distribution of covariates (age, race, HIV serostatus, BMI, cumulative pack years, hypertension medications, systolic BP, diabetes medications, fasting glucose, lipid-lowering medications, HDL, and total cholesterol) using a Markov chain Monte Carlo method [30] assuming multivariate normality. Values for the following number of men were missing and imputed for multiple regression analyses: hypertension medications (2), BMI (3), diabetes medications (4), smoking pack-years (8), lipid medications (11), total and HDL cholesterol (16), systolic BP (26), fasting glucose (37).
All statistical analyses were performed using SAS 9.2 (SAS Institute, Cary, NC). Statistical significance was established at a P value <.05.
RESULTS
Participant Characteristics
There were 597 HIV-infected men and 343 HIV-uninfected men included in the analysis (Table 1). Compared with HIV-uninfected men, HIV-infected men were younger with lower BMI, more likely to be black, and more likely to have hypertension and diabetes mellitus. Men infected with HIV were also more likely to be current smokers and have lower levels of low-density lipoprotein cholesterol, HDL cholesterol, and total cholesterol, and higher triglyceride levels, and they were more likely to be receiving lipid-lowering medication (Table 1).
Table 1.
Characteristics of Study Population, Mean ± SD or Prevalence (%)
| Characteristic | HIV- Infected | HIV-Uninfected | P Valuea |
|---|---|---|---|
| N | 597 | 343 | |
| Age (years) | 53.3 ± 6.5 | 55.7 ± 7.3 | <.001 |
| Race (%) White | 52.6 | 65.9 | <.001 |
| African American | 33.8 | 26.0 | |
| Hispanic + Other | 13.6 | 8.2 | |
| Body Mass Index (kg/m2) | 26.1 ± 4.5 | 27.3 ± 4.8 | <.001 |
| Hypertension (%) | 49.0 | 45.5 | .31 |
| Antihypertensive medication (%) | 35.9 | 32.8 | .34 |
| Systolic blood pressure (mm Hg) | 126 ± 15 | 128 ± 15 | .13 |
| Diabetes (%) | 13.4 | 9.9 | .12 |
| Diabetes medications (%) | 9.4 | 7.3 | .28 |
| Smoking Status (%) | <.001 | ||
| Current | 31.8 | 21.8 | |
| Former | 43.5 | 52.4 | |
| Never | 24.7 | 25.8 | |
| Cumulative smoking pack yearsb | 5.9 (0–23.0) | 1.5 (0–20.8) | .01 |
| Glucose (mg/dL) | 102 ± 25 | 101 ± 29 | .07 |
| Total cholesterol (mg/dL) | 189 ± 43 | 191 ± 36 | .33 |
| LDL cholesterol (mg/dL) | 105 ± 36 | 112.0 ± 32.2 | .003 |
| HDL cholesterol (mg/dL) | 48.7 ± 16.6 | 53.6 ± 16.1 | <.001 |
| Triglycerides (mg/dL) | 176 ± 133 | 122 ± 69 | <.001 |
| Lipid-lowering medications (%) | 36.3 | 30.4 | .07 |
| HIV Parameters | |||
| HIV RNA detectable (>50 copies/mL, % of men) | 18.8 | — | |
| CD4+ T cell count (cells/mm3)b | 600 (422–751) | — | |
| CD4+ T cell count nadir (cells/mm3)b | 244 (133–331) | — | |
| Time on HAART (years) | 10.9 ± 4.3 | — | |
| History of AIDS (%) | 14.2 | — | |
Abbreviations: AIDS, acquired immune deficiency syndrome; HAART, highly active antiretroviral therapy; HDL, high-density lipoprotein; HIV, human immunodeficiency virus; LDL, low-density lipoprotein; RNA, ribonucleic acid; SD, standard deviation.
a By non-parametric Wilcoxon test or χ2 test, as appropriate.
b Median (interquartile range).
Among HIV-infected men, 18.8% had a detectable plasma HIV RNA level. The median CD4+ T-cell count at the MACS visit prior to coronary imaging was 600 cells/mm3 (interquartile range [IQR], 422–751), and the median CD4+ T-cell count nadir was 244 cells/mm3 (IQR, 133–331). The mean time spent receiving HAART was 10.9 ± 4.3 years, and the proportion of men with a history of AIDS was 14.2% (Table 1).
Anatomic Fat Depots
Compared with HIV-uninfected men, HIV-infected men had lower median aSAT (181 cm2 [IQR, 111–277] vs 233 cm2 [IQR, 169–318], P < .001) and tSAT (26 cm2 [IQR, 13–46] vs 49 cm2 [IQR, 35–67], P < .001) (Table 2). Within each of the 3 BMI categories (<25, 25–29.9, and ≥30 kg/m2), differences in median fat area by HIV serostatus were observed (Table 3). Within the BMI <25 kg/m2 and overweight (BMI 25–29.9 kg/m2) strata, median VAT areas were greater among HIV-infected than uninfected men (P < .001 and P = .002 for BMI <25 kg/m2, and BMI 25–29.9 kg/m2, respectively). In all BMI strata, aSAT and tSAT volumes were significantly lower among HIV-infected than HIV-uninfected men (all P < .05).
Table 2.
Characteristics of Anatomic Fat Depots and Coronary Plaque, Median (IQR)
| Fat Depot, or Coronary Plaque Characteristic | HIV- Infected | HIV-Uninfected | P Valuea |
|---|---|---|---|
| Abdominal visceral fat (VAT) (cm2), N | 596 | 341 | |
| Median (IQR) | 150 (87–218) | 139 (88–207) | .33 |
| Abdominal subcutaneous fat (aSAT) (cm2), N | 596 | 341 | |
| median (IQR) | 181 (111–277) | 233 (169–318) | <.001 |
| Thigh subcutaneous fat (tSAT) (cm2), N | 596 | 342 | |
| median (IQR) | 26 (13–46) | 49 (35–67) | <.001 |
| Coronary artery Calcium score (CAC), N | 597 | 342 | |
| prevalence with CAC >0, N (%) | 315 (52.8) | 173 (50.6) | .52 |
| Median (IQR) | 3 (0–81) | 1 (0–72) | .61 |
| Coronary CT angiography, N | 436 | 274 | |
| Prevalence of any coronary plaque, N (%) | 338 (77.5) | 203 (74.1) | .29 |
| Prevalence of calcified plaque, N (%) | 149 (34.2) | 104 (38.0) | .31 |
| Prevalence of noncalcified plaque, N (%) | 278 (63.8) | 146 (53.3) | .006 |
| Prevalence of mixed plaque, N (%) | 152 (34.9) | 84 (30.7) | .25 |
| Prevalence of any coronary artery stenosis >50%, N (%) | 73 (16.7) | 39 (14.2) | .37 |
| Total Plaque Score | |||
| Median (IQR) | 2 (1–5) | 2 (0–5) | .16 |
| Calcified Plaque Score | |||
| Median (IQR) | 0 (0–1) | 0 (0–1) | .17 |
| Noncalcified Plaque Score | |||
| Median (IQR) | 1 (0–3) | 1 (0–2) | .001 |
| Mixed Plaque Score | |||
| Median (IQR) | 0 (0–1) | 0 (0–1) | .16 |
Abbreviations: aSAT, abdominal subcutaneous adipose tissue; CAC, coronary artery calcium score; CT, computed tomography; HIV, human immunodeficiency virus; IQR, interquartile range; tSAT, thigh subcutaneous adipose tissue; VAT, visceral adipose tissue.
a By non-parametric Wilcoxon test or χ2 test, as appropriate.
Table 3.
Anatomic Fat Depots by BMI (in kg/m2) Categories and HIV-Serostatus, Adjusted for Age and Race
| Fat Depot and BMI Category | HIV-Infected |
HIV-Uninfected |
P Value | ||
|---|---|---|---|---|---|
| N | Median (IQR) | N | Median (IQR) | ||
| Abdominal Visceral Fat | |||||
| BMI < 25 kg/m2 | 278 | 115 (76–158) | 126 | 88 (57–132) | <.001 |
| 25–29.9 kg/m2 | 196 | 170 (124–220) | 131 | 155 (112–210) | .002 |
| ≥30 kg/m2 | 115 | 233 (184–291) | 81 | 244 (175–285) | .88 |
| Abdominal Subcutaneous Fat | |||||
| BMI < 25 kg/m2 | 278 | 119 (75–168) | 126 | 152 (120–196) | <.001 |
| 25–29.9 kg/m2 | 196 | 215 (160–281) | 131 | 249 (205–284) | <.001 |
| ≥30 kg/m2 | 115 | 356 (287–438) | 81 | 403 (332–492) | .02 |
| Thigh Subcutaneous Fat | |||||
| BMI < 25 kg/m2 | 278 | 18 (9–29) | 127 | 37 (26–45) | <.001 |
| 25–29.9 kg/m2 | 196 | 29 (19–48) | 131 | 49 (39–60) | <.001 |
| ≥30 kg/m2 | 115 | 56 (36–84) | 81 | 81 (69–112) | <.001 |
Abbreviations: BMI, body mass index; HIV, human immunodeficiency virus; IQR, interquartile range.
Coronary Plaque
As previously reported, compared with HIV-uninfected men, HIV-infected men were more likely to have coronary plaque present (Table 2). Coronary plaque was present in 77.5% of HIV-infected men versus 74.1% of HIV-uninfected men, NCP (63.8% vs 53.3%), MP (34.9% vs 30.7%), and any coronary artery luminal stenosis >50% (16.7% vs 14.2%) (Table 2). There were no differences by HIV serostatus in median plaque scores for TP, CP, and MP, but greater NCP in HIV-infected men.
Anatomic Fat Depots and Coronary Plaque
Presence of Coronary Plaque
The presence of coronary plaque is outlined in Table 4.
Table 4.
Associations Between Body Fat Depots and Presence of Coronary Plaque (Score >0) and Coronary Artery Stenosis >50%
| Plaque Type, Analytic Model | Visceral Adipose Tissue |
Abdominal Subcutaneous Adipose Tissue |
Thigh Subcutaneous Adipose Tissue (tSAT) |
||||||
|---|---|---|---|---|---|---|---|---|---|
| All (N = 937) | HIV+ (N = 596) | HIV− (N = 341) | All (N = 937) | HIV+ (N = 596) | HIV− (N = 341) | All (N = 938) | HIV+ (N = 596) | HIV− (N = 342) | |
| OR (95% CI) | OR (95% CI) | OR (95% CI) | OR (95% CI) | OR (95% CI) | OR (95% CI) | OR (95% CI) | OR (95% CI) | OR (95% CI) | |
| CAC | |||||||||
| Model 1 | 1.00 (.98–1.02) | 1.00 (.98–1.02) | 0.99 (.96–1.02) | 1.00 (.99–1.01) | 0.99 (.98–1.01) | 1.00 (.98–1.03) | 1.00 (.95–1.06) | 0.99 (.92–1.06) | 1.03 (.94–1.12) |
| Model 2 | 0.99 (.97–1.02) | 1.00 (.98–1.03) | 0.97 (.92–1.01) | 0.99 (.96–1.01) | 0.99 (.96–1.01) | 0.99 (.95–1.02) | 0.99 (.93–1.06) | 0.99 (.90–1.08) | 1.00 (.88–1.13) |
| Noncalcified Plaque (NCP)a,b | |||||||||
| Model 1 | 1.02c (1.00–1.04) | 1.04* (1.01–1.07) | 0.99 (.96–1.03) | 1.00 (.99–1.01) | 1.00 (.99–1.02) | 0.99 (.97–1.02) | 1.01 (.95–1.07) | 1.04 (.96–1.12) | 0.99 (.91–1.07) |
| Model 2 | 1.02d (.99–1.05) | 1.04* (1.00–1.08) | 0.99 (.95–1.03) | 0.98 (.96–1.00) | 0.98 (.95–1.01) | 0.98 (.95–1.02) | 0.98 (.91–1.05) | 1.00 (.90–1.11) | 0.96 (.85–1.09) |
| Calcified Plaque (CP)a,b | |||||||||
| Model 1 | 1.04 (.98–1.02) | 1.01 (.98–1.04) | 0.99 (.95–1.02) | 1.00 (.99–1.02) | 1.00 (.99–1.02) | 0.99 (.97–1.02) | 1.02 (.96–1.08) | 1.04 (.96–1.13) | 0.96 (.87–1.06) |
| Model 2 | 0.99 (.97–1.02) | 1.00 (.97–1.04) | 0.98 (.94–1.03) | 0.99 (.97–1.02) | 0.99 (.96–1.02) | 0.98 (.94–1.03) | 1.00 (.92–1.09) | 1.02 (.92–1.14) | 0.93 (.80–1.08) |
| Mixed Plaque (MP)a,b | |||||||||
| Model 1 | 1.00 (.98–1.02) | 1.00 (.98–1.03) | 0.99 (.96–1.03) | 0.99 (.98–1.00) | 0.99 (.97–1.01) | 0.99 (.97–1.02) | 0.98 (.92–1.04) | 0.98 (.90–1.06) | 0.98 (.89–1.08) |
| Model 2 | 1.01 (.98–1.04) | 1.01 (.98–1.05) | 1.00 (.96–1.05) | 0.99 (.96–1.01) | 0.98 (.95–1.01) | 1.01 (.97–1.05) | 1.00 (.92–1.08) | 0.99 (.89–1.10) | 1.04 (.89–1.20) |
| Total Plaque Scorea,b | |||||||||
| Model 1 | 1.02 (.99–1.05) | 1.04* (1.00–1.08) | 0.99 (.95–1.04) | 1.01 (.99–1.02) | 1.01 (.99–1.03) | 1.00 (.98–1.03) | 1.05 (.98–1.12) | 1.05 (.96–1.16) | 1.03 (.92–1.14) |
| Model 2 | 1.02 (.98–1.05) | 1.04 (.995–1.09) | 0.98 (.93–1.04) | 0.99 (.97–1.02) | 0.99 (.96–1.02) | 1.00 (.96–1.04) | 1.04 (.95–1.14) | 1.03 (.91–1.16) | 1.04 (.89–1.22) |
| Stenosis >50%a,b | |||||||||
| Model 1 | 0.99 (.97–1.02) | 0.98 (.94–1.01) | 1.02 (.97–1.07) | 0.99 (.97–1.01) | 0.98 (.96–1.01) | 1.01 (.97–1.04) | 1.00 (.93–1.09) | 1.00 (.89–1.11) | 1.01 (.89–1.15) |
| Model 2 | 0.99 (.96–1.03) | 0.98 (.94–1.02) | 1.01 (.95–1.07) | 0.98 (.95–1.01) | 0.98 (.94–1.02) | 0.99 (.93–1.04) | 1.01 (.91–1.12) | 1.04 (.91–1.19) | 0.92 (.76–1.13) |
Abbreviations: BMI, body mass index; CAC, coronary artery calcium score; CI, confidence interval; CP, calcified plaque score; CTA, computed tomography angiography; CVD, cardiovascular disease; HIV, human immunodeficiency virus; MP, mixed plaque score; NCP, noncalcified plaque score.
(NOTE: Model 1 adjusted for age, race, and CVD risk factors. Model 2 adjusted for age, race, CVD risk factors, and BMI. OR = odds ratio per 10-units increase in fat volume. For HIV-infected participants, model 2 additionally adjusted for HIV-related factors.)
a Sample size for coronary CTA measurements: all = 707, HIV+ = 435, HIV− = 272.
b Within tSAT analysis, sample size: all = 708, HIV+ = 435, HIV− = 273.
c HIV interaction P < .05.
d HIV interaction P ≤ .01.
*P < .05; **P < .01.
Visceral Adipose Tissue
We analyzed associations between VAT and the presence and extent of coronary plaque. Visceral adipose tissue was positively associated with the presence of NCP, in models that adjusted for age, race, and CVD risk factors (Model 1), or for age, race, CVD risk factors, and BMI (Model 2) (P < .05 for all) among HIV-infected men but not among HIV-uninfected men (Table 4 and Figure 1). However, there were significant interactions by HIV serostatus in both analytic models (P < .05 for all). Visceral adipose tissue was positively associated with the presence of NCP in both models.
Figure 1.
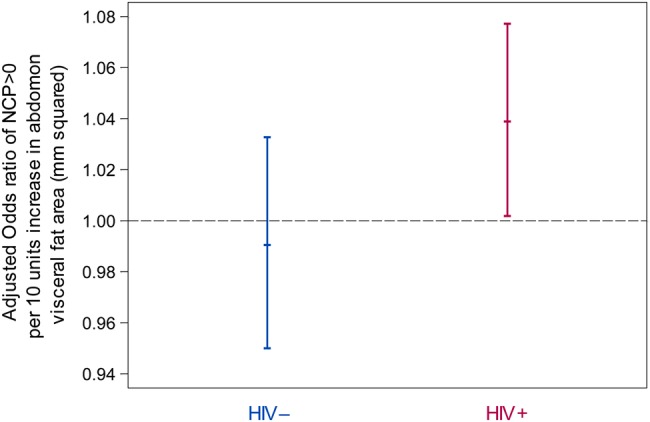
Adjusted odds ratios of presence of noncalcified plaque score (NCP) >0 per 10 units increase in abdomen visceral fat volume by human immunodeficiency virus (HIV) serostatus from multiple logistic regression. Factors adjusted for in regression models included age, race, body mass index, cumulative pack years of cigarette smoking, use of antihypertension medications, systolic blood pressure among persons who did not use antihypertensives, use of antidiabetic medications, fasting glucose level among persons who did not use antidiabetic medications, use of lipid-lowering medications, high-density lipoprotein, and low-density lipoprotein levels among persons not receiving lipid-lowering medications.
Although coinfection with HIV and chronic hepatitis C virus (HCV) was significantly associated with NCP presence, adding HCV to the fully adjusted analytic model (Model 2) did not alter the significant relationship between VAT and NCP presence. Adding CVD risk scores (calculated using the 2013 American College of Cardiology/American Heart Association Guidelines) to fully adjusted models did not alter the relationship between VAT and NCP presence.
Although no statistically significant HIV interactions existed, among HIV-infected men VAT was positively associated with “any coronary plaque” presence in Model 1 (P < .05) but not after additional adjustment including BMI (Model 2). No associations existed between VAT and the presence of any coronary plaque among HIV-uninfected men.
No significant interactions by HIV serostatus and no associations between VAT and CAC presence existed in analyses stratified by HIV serostatus. After adjustment for CVD risk factors and BMI, no associations between VAT and presence of coronary stenosis >50% among HIV-infected men existed.
Abdominal Subcutaneous Adipose Tissue and Thigh Subcutaneous Adipose Tissue
No significant associations were seen between either aSAT or tSAT and the presence of any coronary plaque type or stenosis among either HIV-infected and -uninfected men.
Extent of Coronary Plaque
Visceral Adipose Tissue
Among men with coronary plaque present VAT was not associated with the extent of coronary plaque of any type, regardless of HIV serostatus (Table 5).
Table 5.
Associations Between Extent of Coronary Plaque (Among Men With Plaque Present) and Body Fat Depotsa
| Plaque Type, Analytic Model | Visceral Adipose Tissue |
Abdominal Subcutaneous Adipose Tissue |
Thigh Subcutaneous Adipose Tissue |
||||||
|---|---|---|---|---|---|---|---|---|---|
| All | HIV+ | HIV− | All | HIV+ | HIV− | All | HIV+ | HIV− | |
| Estimate (SE) | Estimate (SE) | Estimate (SE) | Estimate (SE) | Estimate (SE) | Estimate (SE) | Estimate (SE) | Estimate (SE) | Estimate (SE) | |
| CAC | N = 486 | N = 314 | N = 172 | N = 486 | N = 314 | N = 172 | N = 487 | N = 314 | N = 173 |
| Model 1 | 0.01 (0.01) | 0.002 (0.01) | 0.01 (0.02) | −0.001 (0.01) | 0.003 (0.01) | −0.001 (0.01) | −0.04 (0.03) | −0.01 (0.04) | −0.05 (0.04) |
| Model 2 | 0.01 (0.01) | −0.001 (0.01) | 0.02 (0.02) | −0.01 (0.01) | −0.0001 (0.01) | −0.01 (0.02) | −0.08* (0.04) | −0.03 (0.05) | −0.11 (0.06) |
| Noncalcified Plaque (NCP) | N = 423 | N = 277 | N = 146 | N = 423 | N = 277 | N = 146 | N = 423 | N = 277 | N = 146 |
| Model 1 | 0.003 (0.004) | −0.004 (0.01) | 0.01 (0.01) | −0.002 (0.003) | −0.004 (0.003) | 0.003 (0.01) | −0.01 (0.01) | −0.02 (0.02) | 0.01 (0.02) |
| Model 2 | 0.003 (0.01) | −0.004 (0.01) | 0.01 (0.01) | −0.01 (0.01) | −0.01 (0.01) | −0.004 (0.01) | −0.02 (0.02) | −0.02 (0.02) | −0.03 (0.03) |
| Calcified Plaque (CP) | N = 251 | N = 148 | N = 103 | N = 251 | N = 148 | N = 103 | N = 251 | N = 148 | N = 103 |
| Model 1 | −0.001 (0.01) | −0.001 (0.01) | −0.001 (0.01) | 0.001 (0.004) | 0.01 (0.01) | −0.003 (0.01) | −0.01 (0.02) | 0.0003 (0.03) | −0.03 (0.03) |
| Model 2 | −0.004 (0.01) | −0.01 (0.01) | −0.002 (0.01) | −0.002 (0.01) | 0.01 (0.01) | −0.01 (0.01) | −0.04 (0.02) | −0.02 (0.03) | −0.06 (0.04) |
| Mixed Plaque (MP) | N = 234 | N = 151 | N = 83 | N = 234 | N = 151 | N = 83 | N = 235 | N = 151 | N = 84 |
| Model 1 | 0.003 (0.01) | 0.01 (0.01) | −0.002 (0.01) | −0.002b (0.004) | −0.01 (0.01) | 0.01 (0.01) | −0.001 (0.02) | −0.02 (0.03) | 0.02 (0.03) |
| Model 2 | 0.002 (0.01) | 0.02 (0.01) | −0.02 (0.01) | −0.01b (0.01) | −0.02 (0.01) | 0.002 (0.01) | −0.02 (0.02) | −0.02 (0.03) | −0.02 (0.04) |
| Total Plaque Score | N = 538 | N = 337 | N = 201 | N = 538 | N = 337 | N = 201 | N = 539 | N = 337 | N = 202 |
| Model 1 | 0.002 (0.01) | −0.001 (0.01) | 0.01 (0.01) | −0.01* (0.003) | −0.01* (0.004) | 0.001 (0.01) | −0.02 (0.01) | −0.02 (0.02) | −0.004 (0.02) |
| Model 2 | 0.002 (0.01) | 0.001 (0.01) | −0.0002 (0.01) | −0.01** (0.004) | −0.02** (0.01) | −0.01 (0.01) | −0.04* (0.02) | −0.03 (0.02) | −0.05 (0.03) |
Abbreviations: BMI, body mass index; CAC, coronary artery calcium score; CP, calcified plaque score; CV, cardiovascular; HIV, human immunodeficiency virus; MP, mixed plaque score; NCP, noncalcified plaque score; SE, standard error.
a Point estimates represent magnitude and direction of fat/plaque relationships, with significant relationships (P < .05) in bold. Model 1 adjusted for age, race, CV risk factors. Model 2 adjusted for age, race, CV risk factors, and BMI. Estimates represent mean change in log-plaque score per 10-units increase in fat volume.
b HIV interaction P < 0.05.
*P < .05; **P < .01.
Abdominal Subcutaneous Adipose Tissue and Thigh Subcutaneous Adipose Tissue
Abdominal subcutaneous adipose tissue was inversely associated with TPS extent in Models 1 and 2 (P < .05 and P < .01, respectively) among HIV-infected men (P < .05 and P < .01, respectively); no significant associations between aSAT and coronary plaque extent were apparent in HIV-uninfected men. There was a significant interaction by HIV serostatus between aSAT amount and MP extent in both Models (P < .05); among HIV-infected men aSAT was negatively associated with MP extent, and among HIV-uninfected aSAT was positively associated with MP extent, but neither association was statistically significance. Although tSAT amount was generally not associated with the extent of coronary plaque of any type in Model 1, tSAT was inversely associated with extent of CAC (P < .05) and with TPS extent (P < .05) in Model 2 with no interaction by HIV serostatus.
DISCUSSION
In this well characterized group of men who underwent coronary CT imaging, we found several associations between anatomic fat depot volumes and subclinical coronary plaque presence and extent; some of these differed by HIV serostatus and by coronary plaque type. In general, HIV-infected men had less subcutaneous fat (in both the abdomen and thigh) and more VAT than HIV-uninfected men. In analytic models that adjusted for age, race, CVD risk factors, and BMI, VAT was positively associated with a greater likelihood of NCP presence among HIV-infected men (a plaque type previously shown in this cohort to exist in excess among HIV-infected men) but not among HIV-uninfected men. In similarly adjusted models, less aSAT was associated with a greater extent of total plaque (TPS) among HIV-infected men but not HIV-uninfected men.
Our finding of an association between increased VAT and the presence of NCP among HIV-infected persons is unique. Among HIV-infected men, VAT amounts were greater than HIV-uninfected men among normal weight and overweight men but not among obese men. Because HIV-infected men were more likely than HIV-uninfected men to have NCP, to have greater VAT volumes (except among obese men), and to demonstrate an association between greater VAT volume and NCP, this raises the possibility of a VAT/NCP relationship among HIV-infected men. Visceral adipose tissue amount has been positively correlated with CAC amount in 1 Italian cohort of HIV-infected persons [10], but we did not find associations between VAT amount and plaque types other than NCP in our cohort. Reasons for between-cohort discrepant plaque association with VAT are not clear, but they may include the following: (1) other cohorts have not undertaken measurements of subclinical plaque types other than CAC; (2) patients in the Italian cohort attended an HIV metabolic clinic and had a high prevalence of lipodystrophy (including increased VAT) and other metabolic abnormalities; and (3) it is possible that NCP represents newer (younger) plaque that, over time, evolves into more CP. Although cross-sectional data such as ours do not allow conclusions to be drawn as to pathophysiologic sequence of events, the presence of an association between VAT volume and NCP presence in our data but not between VAT volume and NCP extent raises the possibility that VAT amount may be linked to NCP initiation but not to NCP progression.
In our cohort, HIV-infected men had more NCP than HIV-uninfected men [24]; NCP may represent younger plaque that is more prone to rupture than CP. Although the extent to which NCP presence was accounted for or modified by the presence or amount of VAT is unclear, adjustment for VAT did not diminish differences in NCP presence by HIV serostatus (data not shown). Although the extent to which VAT volume comprises a risk for NCP formation is not evaluable in this cross-sectional study, clinical factors associated with increased VAT are also linked with CAD risk. In 1 cohort of HIV-infected persons, VAT amount was independently associated with increased mortality [31]. We are not aware of general population-based studies correlating VAT amount with NCP presence or extent. Evaluation of VAT amount in association with CVD clinical events comprises an area deserving of future study.
Although factors consequent to HIV infection (eg, systemic inflammation and/or immune activation) comprise unique risks for plaque formation, including vascular endothelial function impairment [32], the extent to which these factors are common to the etiology of both NCP and VAT among HIV-infected men or account for relationships between the 2 is unclear. Other work from our group will explore associations between anatomic fat depots and coronary plaque, systemic inflammation, and immune activation.
Our findings of lesser subcutaneous fat volume, aSAT, and tSAT (lipoatrophy) in association with greater overall plaque extent among HIV-infected persons complement findings from other cohorts reporting associations between HIV-related lipoatrophy and risk for CP [10] and Framingham Risk Score [33]. Factors known to increase CAD risk have been associated with HIV-related lipoatrophy; these include insulin resistance [3, 34] and pro-atherogenic hyperlipidemia [1], suggesting the possibility of a causal pathway. These findings may represent long-term adverse effects of prior thymidine analog reverse-transcriptase drug exposure, which are not generally reversible after drug discontinuation.
We noted that regardless of HIV serostatus, less tSAT was associated with greater total coronary plaque (TPS) amount and CAC score. Although our findings of lower median aSAT and tSAT volumes among HIV-infected than uninfected men, regardless of BMI, were not surprising, we are not aware of other reports that have linked lower peripheral fat per se with subclinical atherosclerosis in the general population. One report has linked greater SAT to increased CAC amounts [35]; another has linked reductions in glycation end-production expression in SAT, which is related to lower SAT volume, to increased overall CAD risk [36]. Again, in the context of this cross-sectional study, no causal relationship between amounts of subcutaneous fat and coronary plaque can be established.
Although feasibly anatomic fat changes may be associated with increased coronary plaque risk through known CVD-associated comorbidities, such as insulin resistance and pro-atherogenic patterns of hyperlipidemia (both more common among HIV-infected persons), other paths between “metabolically active” fat and coronary plaque formation may exist. Data exist suggesting that, despite the fact mitochondrial disturbances are similar in VAT and SAT, there is differential induction of pro-inflammatory signaling in VAT compared with SAT and decreased adipogenic gene expression in SAT but not VAT; these differences may result in wasting in SAT but not VAT [23]. Whether or not these same factors influence differential associations between fat depots and specific coronary plaque types is unclear.
Persons with greater VAT and less SAT may eventually be shown to comprise a population to be targeted for more aggressive CVD screening and risk factor reduction. Our findings may suggest that factors known to be associated with increased CVD risk in the general population, such as the associations between VAT, increased hyperlipidemia, and insulin resistance, are also operative among HIV-infected persons, although mechanisms mediating associations between VAT and CVD may differ by HIV serostatus. Although strategies to reduce CVD risk in the general population are valuable among HIV-infected persons, if unique CVD risk factors exist in this population, then established CVD risk assessment and reduction strategies may be insufficient, as recent data profiling the underprediction of CVD events using standard CVD risk prediction equations [37] suggest. Whether or not unique anatomic fat or coronary plaque relationships among HIV-infected persons may inform the CVD risk assessment process in this group is unclear but deserving of further study.
Limitations to our study exist. A cross-sectional study cannot directly assess causality between fat depot volume and coronary plaque. In general, our control group (HIV-uninfected men) was older and less likely to be black than the HIV-infected men. In addition, we did evaluate associations between coronary plaque and other fat depots such as epicardial or liver fat, a subject of other work from our group. Furthermore, we did not have the statistical power to assess anatomic fat or coronary plaque associations in relationship to specific ART exposure. Missing data regarding risk factors involving approximately 10% of study participants required imputation; it is feasible that such imputation may have impacted the results. Finally, this is a study that included only men; the extent to which our findings can be generalizable to women is unclear.
CONCLUSIONS
In summary, we identified unique associations between anatomic fat depot volumes and coronary plaque that differed by HIV serostatus. In particular, our findings of associations between greater VAT volume and NCP presence among HIV-infected men and between subcutaneous fat depletion and some types of coronary plaque, particularly (but not exclusively) among HIV-infected men, are novel. The extent to which this information may be useful in future study evaluating the interplay between visceral and subcutaneous fat volumes with risks for and occurrence of CVD among HIV-infected persons is not yet clear. Further work is necessary to better ascertain factors that may mediate the impact of anatomic fat upon CVD pathogenesis with the hope such work can ultimately help inform the development of improved CVD clinical screening and therapeutic interventions for both HIV-infected and uninfected persons.
Acknowledgments
Financial support. The Multicenter AIDS Cohort Study is funded by the National Institute of Allergy and Infectious Diseases, with additional supplemental funding from the National Cancer Institute (grants UO1-AI-35042, UL1-RR025005, UM1-AI-35043, UO1-AI-35039, UO1-AI-35040, and UO1-AI-35041). This study is funded by the National Heart, Lung, and Blood Institute (grant RO1 HL095129; W. S. P.), with additional support from the National Center for Advancing Translational Sciences, a component of the National Institutes of Health and National Institutes of Health Roadmap for Medical Research (grant UL1 TR 001079).
Potential conflicts of interest. F. J. P. has served as a consultant and/or on the Speakers' Bureau for Gilead Sciences, Janssen Pharmaceuticals, Merck, and Bristol Myers Squibb. T. T. B. has served as a consultant for BMS, GSK, Merck, Abbott, Gilead, ViiV Healthcare, EMD-Serono, and Theratechnologies and has received research funding from Merck and GSK. All authors have submitted the ICMJE Form for Disclosure of Potential Conflicts of Interest. Conflicts that the editors consider relevant to the content of the manuscript have been disclosed.
References
- 1.Montague CT, O'Rahilly S. The perils of portliness: causes and consequences of visceral adiposity. Diabetes 2000; 49:883–8. [DOI] [PubMed] [Google Scholar]
- 2.Riches FM, Watts GF, Hua J et al. . Reduction in visceral adipose tissue is associated with improvement in apolipoprotein B-100 metabolism in obese men. J Clin Endocrinol Metab 1999; 84:2854–61. [DOI] [PubMed] [Google Scholar]
- 3.Gabriely I, Barzilai N. Surgical removal of visceral adipose tissue: effects on insulin action. Curr Diab Rep 2003; 3:201–6. [DOI] [PubMed] [Google Scholar]
- 4.Phillips GB, Jing T, Heymsfield SB. Relationships in men of sex hormones, insulin, adiposity, and risk factors for myocardial infarction. Metabolism 2003; 52:784–90. [DOI] [PubMed] [Google Scholar]
- 5.Safrin S, Grunfeld C. Fat distribution and metabolic changes in patients with HIV infection. AIDS 1999; 13:2493–505. [DOI] [PubMed] [Google Scholar]
- 6.Bacchetti P, Gripshover B, Grunfeld C et al. . Fat distribution in men with HIV infection. J Acquir Immune Defic Syndr 2005; 40:121–31. [DOI] [PMC free article] [PubMed] [Google Scholar]
- 7.Study of Fat Redistribution and Metabolic Change in HIV Infection (FRAM). Fat distribution in women with HIV infection. J Acquir Immune Defic Syndr 2006; 42:562–71. [DOI] [PMC free article] [PubMed] [Google Scholar]
- 8.Hadigan C, Meigs JB, Corcoran C et al. . Metabolic abnormalities and cardiovascular disease risk factors in adults with human immunodeficiency virus infection and lipodystrophy. Clin Infect Dis 2001; 32:130–9. [DOI] [PubMed] [Google Scholar]
- 9.Grunfeld C, Rimland D, Gibert CL et al. . Association of upper trunk and visceral adipose tissue volume with insulin resistance in control and HIV-infected subjects in the FRAM study. J Acquir Immune Defic Syndr 2007; 46:283–90. [DOI] [PMC free article] [PubMed] [Google Scholar]
- 10.Guaraldi G, Stentarelli C, Zona S et al. . Lipodystrophy and anti-retroviral therapy as predictors of sub-clinical atherosclerosis in human immunodeficiency virus infected subjects. Atherosclerosis 2010; 208:222–7. [DOI] [PubMed] [Google Scholar]
- 11.Orlando G, Guaraldi G, Zona S et al. . Ectopic fat is linked to prior cardiovascular events in men with HIV. J Acquir Immune Defic Syndr 2012; 59:494–7. [DOI] [PubMed] [Google Scholar]
- 12.Karmon SL, Moore RD, Dobs AS et al. . Body shape and composition in HIV-infected women: an urban cohort. HIV Med 2005; 6:245–52. [DOI] [PubMed] [Google Scholar]
- 13.Caron M, Auclair M, Lagathu C et al. . The HIV-1 nucleoside reverse transcriptase inhibitors stavudine and zidovudine alter adipocyte functions in vitro. AIDS 2004; 18:2127–36. [DOI] [PubMed] [Google Scholar]
- 14.Addy CL, Gavrila A, Tsiodras S et al. . Hypoadiponectinemia is associated with insulin resistance, hypertriglyceridemia, and fat redistribution in human immunodeficiency virus-infected patients treated with highly active antiretroviral therapy. J Clin Endocrinol Metab 2003; 88:627–36. [DOI] [PubMed] [Google Scholar]
- 15.Saint-Marc T, Partisani M, Poizot-Martin I et al. . A syndrome of peripheral fat wasting (lipodystrophy) in patients receiving long-term nucleoside analogue therapy. AIDS 1999; 13:1659–67. [DOI] [PubMed] [Google Scholar]
- 16.Noor MA, Lo JC, Mulligan K et al. . Metabolic effects of indinavir in healthy HIV-seronegative men. AIDS 2001; 15:F11–8. [DOI] [PMC free article] [PubMed] [Google Scholar]
- 17.Dube MP, Parker RA, Tebas P et al. . Glucose metabolism, lipid, and body fat changes in antiretroviral-naive subjects randomized to nelfinavir or efavirenz plus dual nucleosides. AIDS 2005; 19:1807–18. [DOI] [PubMed] [Google Scholar]
- 18.Carr A, Samaras K, Burton S et al. . A syndrome of peripheral lipodystrophy, hyperlipidaemia and insulin resistance in patients receiving HIV protease inhibitors. AIDS 1998; 12:F51–8. [DOI] [PubMed] [Google Scholar]
- 19.Mulligan K, Grunfeld C, Tai VW et al. . Hyperlipidemia and insulin resistance are induced by protease inhibitors independent of changes in body composition in patients with HIV infection. J Acquir Immune Defic Syndr 2000; 23:35–43. [DOI] [PubMed] [Google Scholar]
- 20.Periard D, Telenti A, Sudre P et al. . Atherogenic dyslipidemia in HIV-infected individuals treated with protease inhibitors. The Swiss HIV Cohort Study. Circulation 1999; 100:700–5. [DOI] [PubMed] [Google Scholar]
- 21.El-Sadr WM, Mullin CM, Carr A et al. . Effects of HIV disease on lipid, glucose and insulin levels: results from a large antiretroviral-naive cohort. HIV Med 2005; 6:114–21. [DOI] [PubMed] [Google Scholar]
- 22.Grunfeld C, Pang M, Doerrler W et al. . Lipids, lipoproteins, triglyceride clearance, and cytokines in human immunodeficiency virus infection and the acquired immunodeficiency syndrome. J Clin Endocrinol Metab 1992; 74:1045–52. [DOI] [PubMed] [Google Scholar]
- 23.Gallego-Escuredo JM, Villarroya J, Domingo P et al. . Differentially altered molecular signature of visceral adipose tissue in HIV-1-associated lipodystrophy. J Acquir Immune Defic Syndr 2013; 64:142–8. [DOI] [PubMed] [Google Scholar]
- 24.Post WS, Budoff M, Kingsley L et al. . Associations between HIV infection and subclinical coronary atherosclerosis. Ann Intern Med 2014; 160:458–67. [DOI] [PMC free article] [PubMed] [Google Scholar]
- 25.Zanni MV, Abbara S, Lo J et al. . Increased coronary atherosclerotic plaque vulnerability by coronary computed tomography angiography in HIV-infected men. AIDS 2013; 27:1263–72. [DOI] [PMC free article] [PubMed] [Google Scholar]
- 26.Kaslow RA, Ostrow DG, Detels R et al. . The Multicenter AIDS Cohort Study: rationale, organization, and selected characteristics of the participants. Am J Epidemiol 1987; 126:310–8. [DOI] [PubMed] [Google Scholar]
- 27.Hacioglu Y, Gupta M, Choi TY et al. . Use of cardiac CT angiography imaging in an epidemiology study - the Methodology of the Multicenter AIDS Cohort Study cardiovascular disease substudy. Anadolu Kardiyol Derg 2013; 13:207–14. [DOI] [PMC free article] [PubMed] [Google Scholar]
- 28.Potretzke AM, Schmitz KH, Jensen MD. Preventing overestimation of pixels in computed tomography assessment of visceral fat. Obes Res 2004; 12:1698–701. [DOI] [PubMed] [Google Scholar]
- 29.Levey AS, Bosch JP, Lewis JB et al. . A more accurate method to estimate glomerular filtration rate from serum creatinine: a new prediction equation. Modification of Diet in Renal Disease Study Group. Ann Intern Med 1999; 130:461–70. [DOI] [PubMed] [Google Scholar]
- 30.Schafer JL. Analysis of Incomplete Multivariate Data. London: Chapman & Hall; 1997. [Google Scholar]
- 31.Scherzer R, Heymsfield SB, Lee D et al. . Decreased limb muscle and increased central adiposity are associated with 5-year all-cause mortality in HIV infection. AIDS 2011; 25:1405–14. [DOI] [PMC free article] [PubMed] [Google Scholar]
- 32.Masia M, Padilla S, Garcia N et al. . Endothelial function is impaired in HIV-infected patients with lipodystrophy. Antivir Ther 2010; 15:101–10. [DOI] [PubMed] [Google Scholar]
- 33.Lake JE, Wohl D, Scherzer R et al. . Regional fat deposition and cardiovascular risk in HIV infection: the FRAM study. AIDS Care 2011; 23:929–38. [DOI] [PMC free article] [PubMed] [Google Scholar]
- 34.Grinspoon S. Insulin resistance in the HIV-lipodystrophy syndrome. Trends Endocrinol Metab 2001; 12:413–9. [DOI] [PubMed] [Google Scholar]
- 35.Ahmadi N, Nabavi V, Yang E et al. . Increased epicardial, pericardial, and subcutaneous adipose tissue is associated with the presence and severity of coronary artery calcium. Acad Radiol 2010; 17:1518–24. [DOI] [PubMed] [Google Scholar]
- 36.Rodino-Janeiro BK, Salgado-Somoza A, Teijeira-Fernandez E et al. . Receptor for advanced glycation end-products expression in subcutaneous adipose tissue is related to coronary artery disease. Eur J Endocrinol 2011; 164:529–37. [DOI] [PubMed] [Google Scholar]
- 37.Thompson-Paul AM, Lichtenstein KA, Armon C et al. . Cardiovascular Disease Risk Prediction in the HIV Outpatient Study (HOPS). In: Conference on Retroviruses and Opportunistic Infections Seattle, Washington. 2015. (Abstract Number: 747). [Google Scholar]