

Abstract
Despite the recent advances in the treatment of tumors with intrinsic chemotherapy resistance, such as melanoma and renal cancers, their prognosis remains poor and new chemical agents with promising activity against these cancers are urgently needed. Sphaeropsidin A, a fungal metabolite whose anticancer potential had previously received little attention, was isolated from Diplodia cupressi and found to display specific anticancer activity in vitro against melanoma and kidney cancer subpanels in the National Cancer Institute (NCI) 60-cell line screen. The NCI data revealed a mean LC50 of ca. 10 µM and a cellular sensitivity profile that did not match that of any other agent in the 765,000 compound database. Subsequent mechanistic studies in melanoma and other multidrug-resistant in vitro cancer models showed that sphaeropsidin A can overcome apoptosis as well as multidrug resistance by inducing a marked and rapid cellular shrinkage related to the loss of intracellular Cl− and the decreased HCO3 − concentration in the culture supernatant. These changes in ion homeostasis and the absence of effects on the plasma membrane potential were attributed to the sphaeropsidin A-induced impairment of regulatory volume increase (RVI). Preliminary results also indicate that depending on the type of cancer, the sphaeropsidin A effects on RVI could be related to Na–K–2Cl electroneutral cotransporter or Cl−/HCO3 − anion exchanger(s) targeting. This study underscores the modulation of ion-transporter activity as a promising therapeutic strategy to combat drug-resistant cancers and identifies the fungal metabolite, sphaeropsidin A, as a lead to develop anticancer agents targeting RVI in cancer cells.
Keywords: Melanoma, Sphaeropsidin A, Apoptosis, Ion transporter, Cell volume, NKCC1, Anion exchanger, Cl−/HCO3−
Introduction
Such malignancies as melanoma, glioblastoma, non-small lung cell and advanced renal cancers, among others, have been generally refractory to standard chemotherapies with cytotoxic agents due to their high levels of intrinsic resistance to apoptosis and/or the development of the multidrug resistance (MDR) phenotype [1–3]. The prognosis is somewhat better with the recently approved therapies based on targeted agents. For example, in the last several years, four drugs have been approved by the US Food and Drug Administration (FDA) for the treatment of melanoma: ipilimumab, a monoclonal antibody targeting CTLA4, vemurafenib and dabrafenib, V600E-mutated BRAF inhibitors, and trametinib, an MEK inhibitor [4]. These drugs display response rates up to 50 %, compared with dacarbazine’s low 5–10 %, and result in increased overall and/or progression-free survivals [5, 6]. However, melanoma cells develop frequent and rapid resistance to these treatments by bypassing through other MAPK pathways (CRAF or PI3K), developing mutations in MEK or NRAS, and overexpressing BRAF or V600E-truncated BRAF [4, 7].
In another example, anti-angiogenic renal cancer therapies involving bevacizumab or tyrosine kinase inhibitors such as sunitinib, sorafenib and pazopanib demonstrated increased progression-free survival and increased overall response rates compared with interferon in a meta-analysis [8]. Nevertheless, approximately 25 % of patients display first-line resistance to these therapies and the remaining 75 % will develop acquired resistance after 5 to 11 months of treatment [9, 10]. The resistance can be often overcome with mTORC1-targeting agents, such as temsirolimus or everolimus [11], but the administration of these therapies can also be accompanied by the development of rapid resistance due to the upregulation of downstream effectors of the PI3K/Akt/mTOR pathway [12].
Recent studies indicate that changes in expression levels of ion channels and transporters play integral part in cancer biology and represent promising targets for therapeutic intervention [13]. Moreover, ion channel and transporter downregulation or overexpression are often important mechanisms responsible for the development of drug resistance and the associated impairment of apoptosis. For example, in one such mechanism of resistance, changes in membrane-embedded ion transporters affect ion balance and lead to the inhibition of cell shrinkage, and thus the impairment of apoptosis [14]. Therefore, it appears that targeting ion channels and transporters with novel chemical agents could represent a promising therapeutic strategy against drug-resistant cancers.
Nature is a main source of novel drug leads in medicine [15, 16] and, in particular, in the area of cancer [15, 17]. Indeed, since the 1940s, approximately 75 % of the registered small anticancer molecules are linked to natural compounds [15]. One poorly investigated natural product is sphaeropsidin A (Fig. 1), a pimarane diterpene isolated from phytopathogenic fungus Diplodia cupressi [18] and more recently from Diplodia quercivora [19]. It has been reported to exert cytotoxic effects in vitro [20–22] with a potency similar to cisplatin or etoposide as well as anti-migratory effects [21], although its mode of action or specific activity against a particular type of cancer has not been investigated. The present study shows for the first time that sphaeropsidin A is effective against drug-resistant cancer models, including melanoma and renal cancer cells, and that its anticancer effects occur by targeting regulatory volume increase (RVI). The latter effect is related, at least partly, to the Na–K–2Cl cotransporter NKCC1 targeting in kidney cells and anion exchanger(s) Cl−/HCO3 − in melanomas. These results highlight the potential use of sphaeropsidin A as a novel avenue for research to treat cancers or reverse acquired resistance to conventional chemotherapy or targeted therapy.
Fig. 1.
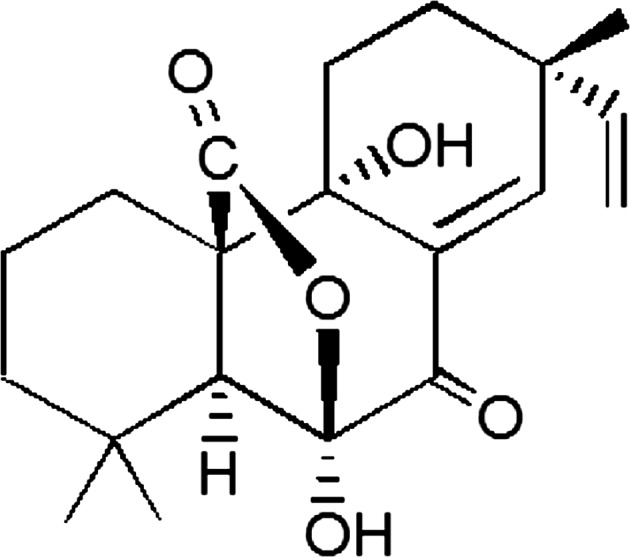
Structure of sphaeropsidin A
Materials and methods
Cell lines and compounds
SKMEL-28 melanoma (obtained from the American Type Culture Collection (ATCC) code HTB-72) and mouse B16F10 melanoma (obtained from the ATCC code CRL-6475) cells were cultivated in RPMI1640 culture medium supplemented with 10 % decomplemented fetal bovine serum (FBS), glutamine (0.6 mg/ml), penicillin (200 IU/ml), streptomycin (200 IU/ml) and gentamicin (0.1 mg/ml). Human embryonic kidney (HEK 293) cells were maintained and routinely passaged in DMEM-F12 culture medium supplemented with 10 % FBS and 1 % penicillin/streptomycin (Invitrogen, Gent, Belgium) at 37 °C under 95 % air and 5 % CO2. Normal human epidermal melanocyte cell line was purchased from PromoCell (code C-12400) and cultivated in their melanocyte growth medium.
The epidermal carcinoma-derived cell line KB-3-1 together with the doxorubicin-selected, ABCB1-overexpressing subline KB-C1 were provided by Dr. Shen (Bethesda, USA). The promyelocytic leukemia cell line HL60 and its ABCB1-overexpressing, vincristine-selected subline HL60/vinc were provided by Dr. M. Center (Kansas State University, Manhattan, KS). The small cell lung carcinoma cell line GLC-4 and its ABCC1- and MVP-overexpressing, doxorubicin-selected subline GLC-4/adr were provided by Dr. E.G. deVries (Groningen, The Netherlands). The breast adenocarcinoma cell line MDA-MB-231 with the respective ABCG2-transfected subclone MDA-MB-231/bcrp was provided by Prof. D.D. Ross (University of Maryland, Greenebaum Cancer Center, Baltimore, MD). Additionally, human umbilical vein endothelial cells (HUVEC) were established and maintained in endothelial basal medium EBM-2 (Lonza, MD, USA) supplemented according to the instructions of the manufacturer. Primary human melanocytes for the MTT assay were isolated from skin biopsies using dispase I (Sigma) and cultivated in melanocyte growth medium (Ready-to-use, PromoCell). Skin biopsies were obtained with written consent of each donor and under approval of the Ethics Committee of the Medical University of Vienna. All other culture media were purchased from Sigma-Aldrich GmbH (St. Louis, MO) and supplemented with 10 % fetal calf serum (PAA, Linz, Austria). Cultures were regularly controlled for Mycoplasma contamination.
Sphaeropsidin A was purified from D. cupressi purchased from Centraalbureau voor Schimmelcultures of Baarn (The Netherlands), strain 261.85 CBS, as previously described [22].
Quantitative videomicroscopy
The morphological changes in sphaeropsidin A-treated cells were determined using computer-assisted phase-contrast microscopy in the mouse B16F10 and the human SKMEL-28 melanoma cell lines as detailed elsewhere [22]. The melanoma cells were monitored for 72 h in the absence or presence of sphaeropsidin A. The movies were produced on the obtained time-lapse image sequences and enabled rapid screening for cellular effects [22]. In each control or sphaeropsidin A-treated condition, damaged cells were quantified on the basis of morphological features as illustrated in Fig. 3A. The experiments were conducted once in triplicate, and the quantification was performed by two independent investigators.
Fig. 3.
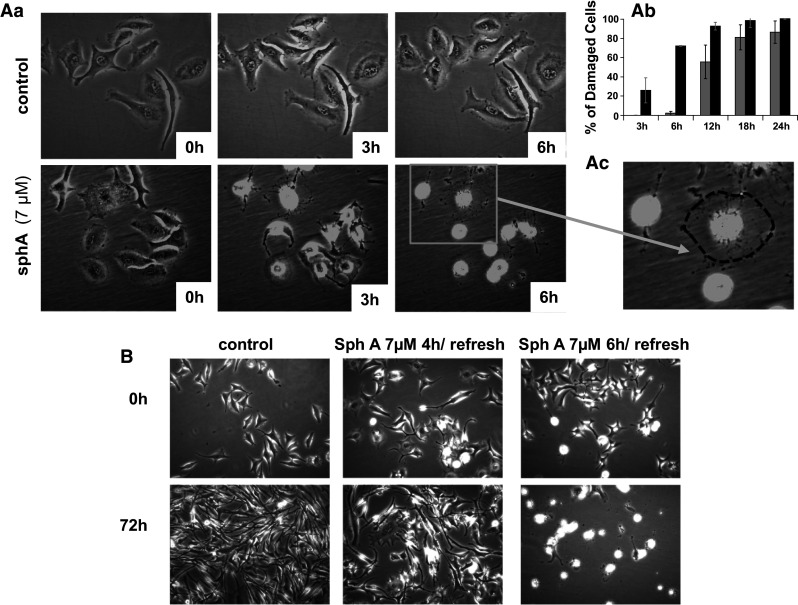
Videomicroscopic study of sphaeropsidin A-induced effects on SKMEL-28 human melanoma cells. Aa Morphological illustrations of sphaeropsidin A-induced effects on SKMEL-28 cells over time. Ab Quantification of the percentage of damaged cells (see enlarged panel in Ac for illustration of such cells with the initial spread cell shape in dotted lines) over time. The data are presented as the mean ± SEM of the three values (triplicates) per condition quantified by two independent investigators. Black columns SKMEL-28; gray columns B16F10. B Reversibility assay: morphological illustrations of SKMEL-28 cells at 0 and 72 h of observation after short periods of treatment with sphaeropsidin A (4 or 6 h, respectively)
Cell death evaluation
Trypan blue staining
Cell viability was assessed using the Trypan blue exclusion test. SKMEL-28 cells were cultured in 25-cm2 flasks and treated with or without 7 µM sphaeropsidin A for 4 h. The cell culture flasks were rinsed twice with PBS (Lonza, Braine, Belgium) before incubation for 3 min with a 1:1 Trypan blue solution (Sigma-Aldrich, Bornem, Belgium) in PBS. The staining solution was removed for the evaluation of the cells under a phase-contrast microscope (GX 20). Five pictures per flask (one flask per experimental condition) were taken for quantification of the proportion of blue-stained cells.
Apoptosis determination
Apoptosis induction was evaluated in SKMEL-28 cells twice (once in triplicate: open dots in Fig. 4D; once in quadruplicate: black squares in Fig. 4D) through TUNEL staining using the APO-AF kit following the manufacturer’s instructions (BD Laboratories, Erembodegem, Belgium) [23].
Fig. 4.
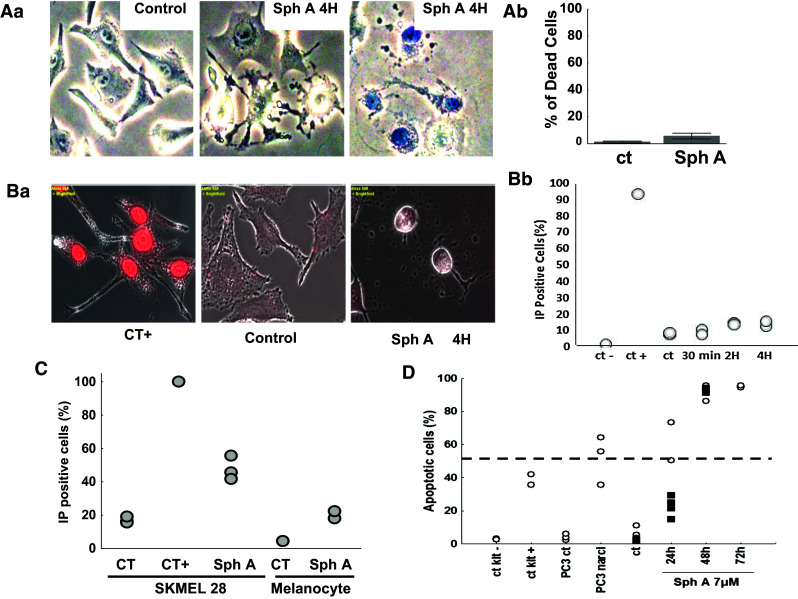
Viability and membrane integrity of SKMEL-28 cells treated with sphaeropsidin A. Aa Typical pictures of control versus sphaeropsidin A [SphA]-treated cells after Trypan blue staining. Ab Rare positive cells appearing in the treated condition, assessing the success of the technique. The graph illustrates the percentage of dead cells (blue-stained cells). The data are presented as the mean ± SEM of the five fields evaluated per experimental condition. Ba Propidium iodide staining of SKMEL-28 cells in microscopy. Merged bright-field and fluorescent pictures are provided. The damaged cells following sphaeropsidin A treatment displayed no plasma membrane permeabilization. Bb Quantification of the proportion of propidium iodide-stained cells by flow cytometry. Ten thousand cells were evaluated per sample (two samples per condition). C Comparison of membrane permeability to propidium iodide between SKMEL-28 melanoma cells and normal human melanocytes treated 30 h with 7 µM of sphaeropsidin A or left untreated. Experiment was conducted once in triplicate for SKMEL-28 (except the positive control in simplicate) and in duplicate for the melanocytes. D Apoptosis determination in SKMEL-28 cells treated with 7 µM sphaeropsidin A for 24, 48 and 72 h. Two independent experiments represented by the black squares and white dots, respectively, are shown
Plasma membrane cell permeability
Propidium iodide staining
SKMEL-28 cells were plated 48 h before treatment with or without 7 µM sphaeropsidin A for 30 min, 2 h, or 4 h. The coverslips were rinsed twice with PBS. The staining was performed with 0.8 µg/ml propidium iodide (Sigma-Aldrich) in PBS for 20 min at 37 °C. The positive control consisted of SKMEL-28 cells fixed and permeabilized with ice-cold 70 % ethanol for 4 h at −20 °C before staining and further analyses. Fluorescence was evaluated using a fluorescence microscope (Axio Vision Imager 2; Zeiss, Zaventem, Belgium) at GX 40. Similarly, the flasks/wells were rinsed and stained. Adherent cells were detached using Trypsin–EDTA, centrifuged and resuspended in RPMI without phenol red for analysis by flow cytometry (Cell Lab Quanta; Beckman Coulter, Analis, Suarlee, Belgium). The experiment was conducted once in duplicate.
A second experiment was conducted with SKMEL-28 melanoma and normal melanocyte cell lines treated for 30 h with 7 µM of sphaeropsidin A or left untreated. Both detached and adherent cells of each sample were pooled, centrifuged and stained with 0.8 µg/ml propidium iodide for 15 min at 4 °C. After two washes with PBS, cells were resuspended in fresh PBS for flow cytometry analysis (Cell Lab Quanta).
Cell volume measurement
Cell volume was analyzed by flow cytometry in parallel with the TUNEL staining analysis using Cell Lab Quanta (Beckman Coulter, Analis, Suarlee, Belgium). With this instrument, cell volume measurement is based on the Coulter principle—the disruption of an electric current between two electrodes.
Ion concentrations in the supernatants of cell cultures
SKMEL-28 melanoma cells were cultured in 25-cm2 flasks and allowed to adhere for at least 24 h before the experimental procedure was performed when the cells reached approximately 70 % confluency. Four milliliters per flask of fresh RPMI1640 cell culture medium supplemented as detailed above was applied on the cells for 4 h in the absence or presence of 7 µM sphaeropsidin A in pentaplicate. Flasks were hermetically closed during these 4 h. Supernatants were then collected and transferred into tubes with agar dedicated to blood sample analyses, including plasmatic ion concentration measurements. Five tubes containing fresh culture medium that was not in contact with cells were also used. The absence of effects of sphaeropsidin A on ion measurements was checked and confirmed. Ion concentrations were determined by LBS Medical Laboratories (Brussels, Belgium) using a standard procedure for blood sample analysis. Results were provided as ionograms, and ion concentrations were expressed as mEq/L or mg/dl and further converted to molarity values.
pH supernatant measurements
SKMEL-28 melanoma cells were cultured in 25-cm2 flasks and allowed to adhere for at least 24 h before the experimental procedure was performed when the cells reached approximately 70 % of confluence. Four milliliters per flask of fresh RPMI1640 cell culture medium supplemented as detailed above was applied on the cells for 4 h in the absence or presence of 7 µM sphaeropsidin A in triplicate. After 2, 4 and 6 h of treatment in hermetically closed flasks, supernatants were collected and the pH was measured with an inoLab pH 720 pH meter (inoLab, VWR, Leuven, Belgium). The pH of each sample was measured three times and the means of each sample were calculated. Results are presented as mean ± standard error of three replicates measured three times each.
Plasma membrane potential and K+ current measurements
Experiments were performed with cells seeded into 35-mm Petri dishes at 2000 cells per cm2. All current clamp (I = 0) and voltage clamp experiments were performed using the conventional whole-cell recording configuration of the patch clamp technique as previously described [24].
The physiological saline solution (PSS) comprised the following: 140 mM NaCl, 1 mM MgCl2, 4 mM KCl, 2 mM CaCl2, 11.1 mM d-glucose and 10 mM HEPES, adjusted to pH 7.4 with NaOH. The pipette solution for the whole-cell recordings contained the following: 125 mM K-glutamate, 20 mM KCl, 1 mM MgCl2, 1 mM Mg-ATP, 10 mM HEPES, 0.7 mM CaCl2 and 1 mM EGTA, adjusted to pH 7.2 with KOH. Experiments were conducted using the Axopatch 200B patch clamp amplifier (Axon Instrument) and data, digitized using the 1322-A Digidata converter (Axon Instrument), were stored on a computer using Clampex of pClamp 9.2 software (Axon Instrument). The patch clamp data were analyzed using both Clampfit 10.2 and OriginPro 8.5 software (Microcal Inc., Northampton, MA, USA).
Evaluation of the effects of sphaeropsidin A on Na+/K+ ATPase and the NKCC co-transporter
Confluent HEK 293 cells, maintained in DMEM:F12 with 10 % fetal bovine serum in 10-cm culture dishes, or SKMEL-28 cells, maintained as described above, were washed with Ca2+-free Hank’s balanced salt solution (HBSS) for 5 min, followed by treatment with 0.05 % Trypsin–EDTA for 1 min at 37 °C. Detached cells from 1 × 10-cm dishes were resuspended in 16 ml of complete culture medium and plated in 8 × 35-mm dishes (2 ml of cells per dish; ratio 1:8), pre-coated overnight with 0.1 mg/ml poly-l-lysine. Cells were allowed to attach for 2 h prior to flux analysis. For uptake experiments, the culture medium was aspirated and replaced with 1 ml of an isosmotic solution containing 140 mM NaCl, 5 mM KCl, 2 mM CaCl2, 0.8 mM MgSO4, 5 mM glucose, 5 mM HEPES (pH 7.4) and 300–310 mOsM. After the preincubation period, the medium was aspirated and replaced with 1 ml of an identical solution or identical solution supplemented with 80 mM sucrose (380 mOsM for determining NKCC1 activity), containing 1 μCi/mL 86Rb (PerkinElmer). After 15 min of uptake, the solution was aspirated and the cells were washed three times with ice-cold solution. The cells were then lysed for 1 h with 500 μl of 0.25 M NaOH and then neutralized with 250 μl of glacial acetic acid. A 300-μl aliquot was then added to 5 ml of liquid scintillation fluid (Biosafe II; Research Products International) for counting, and 30 μl was used for protein assays (Bradford assay; BioRad). A 5-μl aliquot of the uptake solution was counted as the standard. Uptakes are expressed in pmol of K+/mg of protein/min. Na+/K+ pump activity was determined through the effect of adding of 100 μM ouabain, whereas NKCC1 activity was measured through the effect of adding 20 μM bumetanide. Sphaeropsidin A was tested at concentrations of 0.01–100 μM with the drug being added during both the preincubation and uptake periods. Each experimental condition was measured in triplicate, and the experiments were performed twice.
Western blot analysis
Cells plated in 35-mm dishes as described above were pre-incubated for 30 min with or without 100 μM sphaeropsidin A in an isotonic saline, and then incubated for 10 additional minutes in isotonic or hypertonic saline with or without the compound. Cells were then briefly washed and exposed to 150 μl lysis buffer (100 mM NaCl, 50 mM NaF, 10 mM Na-phosphate—pH 7.2, 2 mM EDTA, 150 μM Na-vanadate, 1 % Triton and protease inhibitors) for 30 min on ice. The cells were then scraped, and the solution recovered and pelleted for 10 min at 14,000 rpm. Equal amounts of protein (70 μg) were loaded and separated on a 12 % SDS polyacrylamide gel and electroblotted onto 0.45 μm polyvinylidene fluoride membranes (ThermoFisher Scientific) through a semi-dry process. The membranes were incubated for 2 h at room temperature in blocking solution (5 % nonfat milk in TBST, i.e., 150 mM NaCl, 10 mM Tris, 0.5 % Tween 20), followed by two rinses in TBST and an overnight incubation at 4 °C with a 1:1000 polyclonal phospho-SPAK/OSR1 antibody (S877B, MRC University of Dundee) in TBST containing 5 % BSA. Membranes were then washed in TBST for 3 h with frequent changes, incubated with horseradish peroxidase-conjugated anti-sheep secondary antibody in blocking solution (1:5000) for 1 h at RT and washed again for 2 h in TBST. Protein bands were then visualized by chemiluminescence (ECL Plus, Amersham Biosciences, Piscataway, NJ).
Results
Evaluation of sphaeropsidin A in the NCI 60-cell line panel highlights its marked anticancer effects against melanomas and kidney cancers
The anticancer effects of sphaeropsidin A were first analyzed in the NCI panel of 60 cancer cell lines at 10 µM (Fig. 2a, shown with the permission of the NCI). The data obtained revealed that the residual growth ranged between 0 and 138 % depending on the cell line analyzed (Fig. 2a). Interestingly, the whole sets of both melanoma and kidney cancer cell models appeared to be more sensitive to sphaeropsidin A than the mean response of the 60 cancer cell lines, with growth inhibition generally above 90 % at 10 µM compared with the mean of 60 %. In contrast, all of the leukemia cell lines appeared to be poorly sensitive, with a growth reduction of at best 32 %. The response of the other cancer cell types varied with the cell line under study.
Fig. 2.

Analysis of the anticancer effects of sphaeropsidin A by the NCI identifies melanoma and kidney cancer cell lines as the most responsive tumor models. a Characterization of the effects induced by 10 μM sphaeropsidin A in the NCI 60-cell line panel. Cell lines are grouped by cancer type [origin]. “0” represents the mean growth inhibition of the 60 cell lines, i.e., 60 % of growth inhibition. The difference between the growth inhibition of a specific cell line and mean inhibition is represented by a bar: if it is more sensitive, the bar is on the right; if it is less sensitive, the bar is on the left. b Determination of the concentration that reduced by 50 % the global growth [GI50] of each cell line after 48 h of culture. “0” represents the mean GI50 of the 60 cell lines, i.e., 1.6 µM. Log10 differences are represented by the bars. c Determination of the 50 % lethal concentration [LC50] of each cell line compared to the mean LC50 [“0”]. The scale of the bars is in log10 as for b
The mean NCI 50 % growth inhibitory concentration (GI50) equals 1.6 µM, while the 50 % lethal concentration (LC50), which is more relevant to cell death induced with sphaeropsidin A is 20.4 µM. Although cell-specific GI50s vary only from 0.3 to 6.3 µM (Fig. 2b), the LC50 values are associated with marked differences in response among the cell lines. The LC50 profile (Fig. 2c) displays high similarity to the response of the panel at 10 µM, with melanomas and kidney cancers being the most sensitive and leukemia models being the less sensitive ones for which no LC50 could be reached, until at least 100 µM. These data highlighted that melanoma and kidney cancer cell lines were more sensitive to sphaeropsidin A than the remaining cancer cell types and, therefore, melanoma and kidney cells were chosen for the current study.
The differential cell sensitivity was then evaluated for sphaeropsidin A at both GI50 and LC50 levels and compared to the profiles of 765,000 compounds in the NCI database using the COMPARE algorithm [25] as was successfully done with other types of compounds [26, 27]. The calculated “Compare Correlation Coefficients” (the CCC index) came close (CCC > 0.7) to only one compound, NSC 205098 or 5-iodo-1-methyl-3′-methylidenespiro[indole-3,5′-oxolane]-2,2′-dione, which displayed GI50 and LC50 profiles similar to the those of sphaeropsidin A. However, no information on its anticancer mechanisms of action has been published to date.
Sphaeropsidin A can overcome various multidrug resistance phenotypes
To evaluate the sphaeropsidin A ability to overcome apoptosis resistance and/or multidrug resistance mechanisms, its anticancer effects were evaluated on four cancer models, each of which included both parent and distinct drug-resistance phenotypes; these four models are described in detail by Mijatovic et al. [28]. The resistant models displayed similar or even higher sensitivity to sphaeropsidin A than their non-resistant counterparts (Table 1). Moreover, sphaeropsidin A was less active against several primary non-cancerous cell models such as HUVEC endothelial cells and primary melanocytes—but not against fibroblast cell lines—than against cancer cells (Table 1).
Table 1.
Activity of sphaeropsidin A against cancer cells and their drug-resistant sublines as well as non-malignant cell types
| Cell line | Resistance mechanisma | Sphaeropsidin A (µM) IC50 ± SD |
Resistance factorb | Control drug resistance factorb |
|---|---|---|---|---|
| Malignant cells | ||||
| KB-3-1 | 4.13 ± 0.7 | |||
| KB-C1 | ABCB1 | 2.08 ± 0.1 | 0.50 | >500 (doxorubicin) |
| MDA 231 | 1.72 ± 0.1 | |||
| MDA 231 bcrp | ABCG2 | 1.09 ± 0.04 | 0.81 | >100 (mitoxantrone) |
| GLC4 | 1.09 ± 0.04 | |||
| GLC4/adr | ABCC1, MVP | 1.30 ± 0.03 | 1.20 | >100 (doxorubicin) |
| HL60 | 1.36 ± 0.29 | |||
| HL60 vinc | ABCB1 | 1.32 ± 0.51 | 0.97 | >1000 (vincristine) |
| Non-malignant cells | ||||
| Melanocytes | 13.3 ± 0.20 | |||
| HUVEC | 6.98 ± 0.05 | |||
aThe main resistance mechanisms against the selection drugs are indicated
bResistance factors were calculated by dividing the sphaeropsidin A IC50 values of the drug-resistant sublines by the respective values for the parental cell lines. Control drugs affected by the resistance mechanisms were included to prove activity of the resistance mechanism
ABCB1 P-glycoprotein, ABCG2 breast cancer resistance protein, ABCC1 MRP1, MVP major vault protein
Sphaeropsidin A induces rapid cellular shrinkage of melanoma cells that becomes irreversible after 6 h of treatment
The anticancer effects of sphaeropsidin A on SKMEL-28 cells were further investigated by videomicroscopy, which revealed a marked cellular shrinkage appearing within the first 6–12 h of treatment (Fig. 3A). The proportion of such affected cells reached 100 % in the first 24 h of treatment (gray columns, Fig. 3Ab). Similar data were obtained for B16F10 melanoma cells (black columns, Fig. 3Ab; [22]).
In previous studies [22], it was established that sphaeropsidin A is degraded in the culture medium leading to 80 % of sphaeropsidin A remaining after 12 h and 60 % after 24 h at 37 °C. Therefore, to ascertain whether the observed effects were related to sphaeropsidin A itself and/or its degradation products, reversibility assays were performed. It was observed that 6 h of treatment was sufficient to lead to 100 % of damaged cells after 72 h (Fig. 3B), whereas after 4 h of treatment, SKMEL-28 cells could still recover their spreading and morphology if the medium was refreshed (Fig. 3B). Therefore, sphaeropsidin A, rather than its metabolites, is likely the compound responsible for the marked and rapid cellular shrinkage that is irreversibly induced after 6 h of treatment.
Sphaeropsidin A-induced cellular shrinkage is not related to plasma membrane permeabilization and necrotic process, but leads finally to apoptosis induction
To understand whether the cell shrinkage process was related to necrosis, it was further evaluated whether the plasma membrane was disrupted by sphaeropsidin A. Trypan blue exclusion assays revealed that only 10 % of treated SKMEL-28 cells for 4 h were positively stained (Fig. 4Ab). Indeed, the shrinking cells were not stained (middle panel Fig. 4Aa). The plasma membrane integrity was further confirmed by evaluation of its permeability to propidium iodide (PI). Figure 4Ba clearly shows that shrunken SKMEL-28 cells were not permeable to PI. Quantitative data of the number of PI-stained cells were obtained by flow cytometry analysis, revealing that only 15 % of the cells were PI stained after 4 h of sphaeropsidin A treatment (Fig. 4Bb). The number of stained cells reached about 50 % after 30 h of treatment for SKMEL-28 cancer cells, whereas normal melanocytes were less affected with about only 20 % of PI positive cells (Fig. 4C). Nevertheless, it was found that this non-necrotic shrinkage of SKMEL-28 cells led to marked apoptosis after 24–48 h of treatment (Fig. 4D). Similar data were obtained with respect to B16F10 cells (data not shown). Thus, apoptotic cell death occurred subsequently to the cellular shrinkage.
Sphaeropsidin A affects cellular ion homeostasis
To validate that the cellular shrinkage observed in SKMEL-28 melanoma cells was effectively related to a cellular volume decrease, cellular volume changes after 24, 48 and 72 h of sphaeropsidin A treatment were assessed using flow cytometry. A time-dependent decrease in the cellular volume was confirmed (Fig. 5a). Rapid changes in the cell volume are regulated by water and ion homeostasis such as potassium ions through potassium channels. Because potassium is also the most abundant intracellular ion (150 mEq/L), the effect of sphaeropsidin A on potassium ion efflux of SKMEL-28 melanoma cells was assessed using the patch clamp technique and the whole-cell configuration. The potassium current–voltage relationship revealed the absence of a significant effect of sphaeropsidin A on the potassium currents of SKMEL-28 melanoma cells (Fig. 5b). Notably, for non-physiological potentials (up to 50 mV), sphaeropsidin A slightly increased potassium currents, but this effect could not explain the cellular shrinkage in which an increase in potassium currents was expected [29]. The plasma membrane potential recorded by the patch clamp technique was also not affected by sphaeropsidin A treatment at 10 µM (Fig. 5c), demonstrating the absence of a direct effect of this drug on electrogenic ion channels that regulate the membrane potential such as potassium channels. Ionograms of RPMI1640 culture medium supernatants demonstrated a significant and marked increase in the chloride concentration that was elevated by 1 mM unit after 4 h of sphaeropsidin A treatment (Fig. 5d). In contrast, the bicarbonate concentration was decreased by 1 mM unit compared to control cell supernatants (Fig. 5e). No significant changes in sodium, potassium, calcium or phosphorous were noted (data not shown), but pH decreased over time when SKMEL-28 cells were treated with sphaeropsidin A (7 µM) (Fig. 5f). Thus, it was proposed that sphaeropsidin A could target electroneutral transporter(s) or pump(s) involving a chloride transmembrane gradient, such as the Na–K–2Cl cotransporter NKCC1 or Cl−/HCO3 − antiport.
Fig. 5.
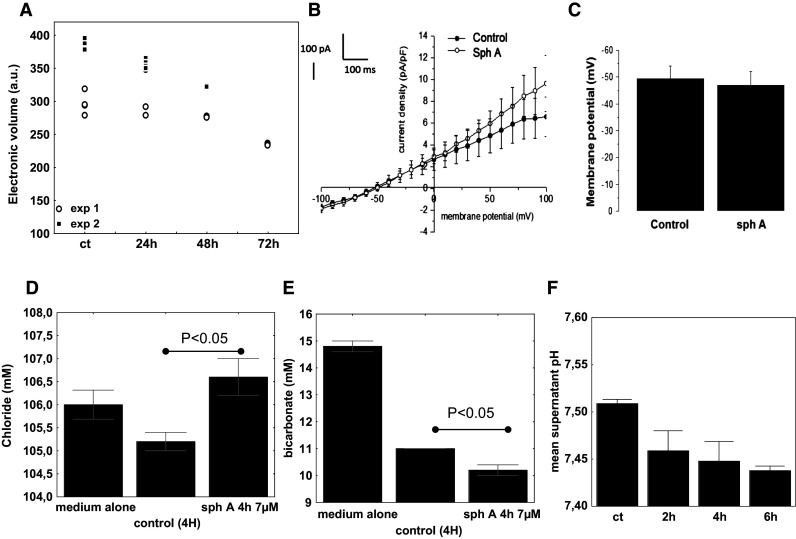
Evaluation of sphaeropsidin A effects on cell volume, plasma membrane potential and ions. a Analysis of cell volume by flow cytometry. Two independent experiments represented by the black squares and white dots, respectively, are shown (sph A: 7 µM). b Current–voltage relationships obtained before and after application of 10 µM sphaeropsidin A for 3 min in SKMEL-28 cells. Current–voltage relationships were obtained by dividing the amplitude of the averaged steady-state currents elicited between −100 and +100 mV by the respective cell capacitance. N = 5, mean ± SEM. c Membrane potential recorded in the current clamp mode [I = 0, pCa 6.4] in SKMEL-28 cells before and after application of 10 µM sphaeropsidin A for 3 min. N = 5, mean ± SEM. d–e Ion concentrations in the SKMEL-28 cell supernatants. Results are expressed for both chloride [D] and bicarbonate [E] in mM as mean ± SEM of five values. f pH measurements of the supernatants of SKMEL-28 cells left untreated or treated with 7 µM of sphaeropsidin A over time. Results are expressed as mean ± SEM of triplicates
The evaluation of sphaeropsidin A effects on NKCC1-dependent potassium influx in HEK293 cells showed a dose-dependent inhibition (Fig. 6a). The use of HEK293 embryonic kidney cells expressing the NKCC1 isoform led to the determination of the 50 % inhibitory concentration of sphaeropsidin A, which equaled 3 µM (Fig. 6b). In contrast, sphaeropsidin A induced a stimulation of the sodium pump-dependent potassium influx in the presence of bumetanide, an NKCC1 inhibitor used as a diuretic (Fig. 6c). Further mechanistic study of sphaeropsidin A-induced effects on NKCC1 showed that under both isotonic and hypertonic conditions, sphaeropsidin A induced a marked decrease in OSR1 and SPAK phosphorylation in HEK293 cells (Fig. 6d).
Fig. 6.

Effect of sphaeropsidin A on Na+/K+ pump and Na–K–2Cl cotransporter function in HEK-293 cells. a K+ influx measured under hypertonic [380 mOsM] conditions in the presence of 100 µM ouabain to suppress Na+/K+ pump activity. The majority of the flux is bumetanide sensitive. Sphaeropsidin A was tested at concentrations ranging from 0.01 to 100 µM. Bars represent mean ± SEM (n = 3). Fluxes are presented in nmoles × mg protein−1 × min−1. b Dose–response curve of sphaeropsidin A for NKCC1 function. K+ uptakes were measured in triplicate in HEK293 cells exposed to concentrations of sphaeropsidin A ranging from 10 nM to 100 µM. Ouabain was present in all of the conditions to suppress Na+/K+ pump activity. Flux was expressed as a percentage of the control [influx measured in the absence of sphaeropsidin A]. Dotted lines represent the IC50 measured at 3 µM. c K+ influx measured under isosmotic [320 mOsM] conditions in the presence of 20 µM bumetanide to suppress NKCC1 function. The majority of the flux is ouabain sensitive. Sphaeropsidin A (Sph A) was tested at concentrations ranging from 0.01 to 33 µM. d Western blot analysis of phospho-SPAK (S383) and phospho-OSR1 (S325) in HEK293 cells exposed to sphaeropsidin (100 μM) or not under isotonicity or hypertonicity. The single sheep polyclonal antibody recognizes the identical SPAK and OSR1 epitopes
Surprisingly, K+ uptake in SKMEL-28 cells, whose basal level is approximately one-third of the one of HEK293 cells, was revealed to be independent of NKCC1, as no inhibition could be evidenced in the presence of bumetanide (Fig. 7a). By contrast, ouabain was able to decrease the K+ currents in SKMEL-28 cells by ca. 80 % (Fig. 7a). Effects of sphaeropsidin A on K+ transport in SKMEL-28 cells were nevertheless investigated under hypertonic conditions. After preincubation, cells were exposed to 380 mOsM solution in the absence of ouabain and K+ uptake was measured. As seen in Fig. 7b, at moderately low doses (3–10 µM) sphaeropsidin A had no effect, compared with a small increase in K+ uptake at higher doses (33–100 µM). Again, the small increase in K+ uptake likely comes from activation of the Na+/K+ pump, whereas the absence of a bumetanide effect indicates that the cells do not have an Na–K–2Cl cotransporter that can be activated by hypertonicity.
Fig. 7.

Absence of Na–K–2Cl cotransporter function and sphaeropsidin A effect on K+ influx in SKMEL-28. a Side-by-side comparison of K+ influx in HEK293 cells and SKMEL-28 melanoma cells. Whereas ouabain (100 μM) significantly reduces K+ influx in both cell lines, bumetanide (20 μM) only reduces K+ influx in HEK293 cells. b Absence of inhibitory effect of sphaeropsidin A (3–100 μM) on K+ influx in SKMEL-28 cells exposed to hypertonicity. Experiment was performed in the absence of ouabain. All bars represent mean of K+ flux expressed in nanomoles K+ × mg protein−1 × min−1 ± SD (N = 3). Ou ouabain, bum bumetanide, Sph A sphaeropsidin A
Sphaeropsidin A could act on anion exchangers in melanoma cells
Considering that SKMEL-28 melanoma cells seem to lack functional NKCC1 cotransporter, the NCI cell line transcriptomic database for mRNA expression of NKCC1 and NKCC2 was investigated. There appeared to be no obvious correlation between the LC50 cellular sensitivity profile and NKCC1 or NKCC2 mRNA expression levels (data not shown). Because SKMEL-28 cells lost chloride while both bicarbonate concentration and pH are accordingly decreased in the extracellular medium, it appeared possible that Cl−/HCO3 − anion exchangers were targeted by sphaeropsidin A. Thus, the NCI transcriptomic cell line database was analyzed and it was found that anion exchanger 2 and 3 isoforms (Fig. 8a, b) were overexpressed at the mRNA level in melanomas and most of kidney cancer cell lines, while leukemia cell lines, which are not sensitive to sphaeropsidin A up to 100 µM (Fig. 2c), express low relative mRNA levels of these antiporters. Similarly, the investigation of AE1, 2 and 3 expression levels in public transcriptomic databases (GSE7553 and GSE3189) of melanocytic lesions highlighted increased expression of AE2 in melanoma as compared to benign naevi or skin samples (Fig. 8c) and in melanoma metastatic lesions as compared to primary tumors (Fig. 8d). AE3 appeared to be also increased in metastatic melanomas as compared to primary melanomas (Fig. 8d). Further investigations of sphaeropsidin A effects on these antiports will thus be conducted in the near future to elucidate the action of sphaeropsidin A on Cl−/HCO3 − anion exchangers.
Fig. 8.
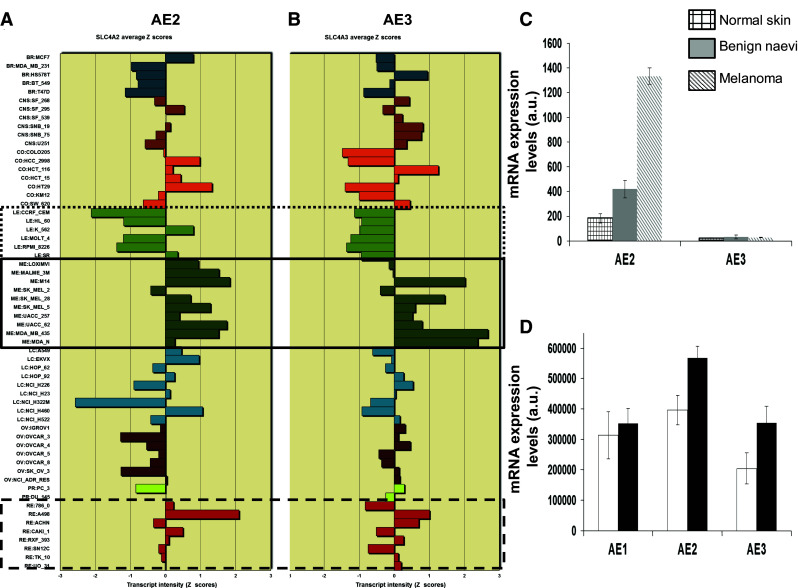
Relative mRNA expression levels of Cl−/HCO3 − antiport isoforms in the NCI 60 cell line panel and melanoma databases. a Anion exchanger 2. b Anion exchanger 3. Full line square is a focus on melanoma cell lines, hatched line squares on renal cancer cell lines and dotted line square on leukemia cell lines. c mRNA expression levels of AE2 and AE3 from the GSE3189 database in normal skin samples (N = 7; squared bars), benign naevi (N = 18; gray bars) and melanomas (N = 45; line hatched bars). Results are presented as mean ± SEM. d Similar analysis was conducted with data from GSE7553 dataset. White bars represent primary melanoma tumor samples (N = 14) and black bars metastatic melanomas (N = 40). Note that GSE3189 does not contain any probe for AE1
Discussion
The results obtained in the current study indicate that high levels of apoptosis resistance can be overcome with sphaeropsidin A, an agent that induces the loss of cellular chloride. Indeed, the loss of chloride, as well as that of potassium, is a hallmark of and a mandatory prerequisite to apoptosis [30, 31]. Through extrinsic or intrinsic pathways, various pro-apoptotic stimuli induce Cl− efflux within 2–4 h via the volume-sensitive outwardly rectifying Cl− channel (VSOR Cl−) associated with apoptosis volume decrease (AVD), a phenomenon that precedes the subsequent apoptotic events, such as cytochrome c release, caspase-3 activation and DNA laddering [30–32]. Indeed, the use of Cl− channel blockers rescues cells from apoptosis. In line with this mechanism, Okada and Maeno [31] indicated that “sustained shrinkage may switch on apoptotic machinery” and that “the cell death could be brought under control by adjusting the cell volume or by manipulating cell volume regulatory mechanisms”. Although chloride is considered as a “minor” anion, it is the major permeant ionic species involved in the Gibbs–Donnan equilibrium resulting from the osmotic force generated by intracellular molecules (e.g., nucleic acids and proteins) as well as the asymmetric distribution of permeant ions created by the impermeant anions [33, 34]. Indeed, the intracellular chloride concentration [Cl−]i is a more sensitive indicator of cell volume change than cell volume itself [33].
Cell volume is controlled by regulatory volume increase (RVI) and regulatory volume decrease (RVD) mechanisms initiated by isosmotic cell shrinkage or swelling, respectively [30, 31, 33]. RVI is typically mediated by either NKCC1 or functionally coupled NHE1 and Cl−/HCO3 − exchangers [33]. The results described herein suggest that sphaeropsidin A targets RVI via possibly NKCC1 and/or Cl−/HCO3 − anion exchanger inhibition. Specifically, sphaeropsidin A induced clear RVI blockage-linked events such as Cl− efflux associated with a net decrease in the HCO3 − extracellular concentration and cell culture medium acidification (Figs. 4, 5). All these presently observed features could be explained as illustrated in Fig. 9 with sphaeropsidin A-induced inhibitory effects on NKCC1 cotransporter and/or Cl−/HCO3 − exchangers that lead in turn to the effects observed on the Na+/K+-ATPase and NHE1.
Fig. 9.

The proposed mechanism for sphaeropsidin A effects on ion homeostasis. a In [cancer] cells expressing both the Na–K–2Cl cotransporter (NKCC1) and a Cl−/HCO3 − antiporter, Cl− enters the cell through these two transporters under control conditions. There is also an efflux of HCO3 − through Cl−/HCO3 − antiporter. Na+ enters the cell through NKCC1 and the Na+/H+ antiporter, and moves out of the cell through the Na+/K+ pump. b In the presence of sphaeropsidin A, Cl− influx is reduced following NKCC1 cotransporter and probably Cl−/HCO3 − exchanger inhibition. This leads to a local increase of external Cl− concentration and a reduction of external HCO3 − concentration. The inhibition of NKCC1 cotransporter and the activation of Na+/K+ pump by sphaeropsidin A induced an increase of external Na+ concentration that is used to increase the activity of Na+/H+ antiporter leading to external pH acidification. In the absence of NKCC1 function (e.g., in SKMEL28 cells), the Cl−/HCO3 − exchanger would be the only target of sphaeropsidin A, still affecting HCO3 − and H+ balance and leading to extracellular acidification
During apoptosis, AVD occurs in three phases which include early AVD, a recovery transition stage and a late AVD that leads to further reduction in cell volume [35]. The recovery stage is mediated by a transient RVI stimulation in the apoptotic process [35]. However, the observed RVI inhibition with sphaeropsidin A treatment suggests that in this case the cellular shrinkage was most likely the causal event of apoptosis and not a consequence of apoptosis induction by sphaeropsidin A. Indeed, the direct effect on [Cl−]i leading to sustained shrinkage triggers the apoptotic process directly [35], bypassing classical apoptotic induction pathways and overcoming apoptosis resistance as observed in the present study (Table 1). Similarly, the loop diuretics furosemide and bumetanide, known NKCC1 inhibitors, were also shown to overcome the MDR status of bladder cancer in vitro [36] and to sensitize glioma cells to apoptosis [37], respectively. These observations identified the cotransporter as one of likely targets of sphaeropsidin A, despite the fact that bumetanide itself displays no anticancer effects, at least up to 10 μM (NCI database). Consistently, we observed a robust inhibitory effect of sphaeropsidin A on NKCC1 function, at least in kidney cells. This effect was unlikely due to a direct effect of the compound on NKCC1, but rather mediated through inhibition of the cotransporter’s regulatory kinases, SPAK and OSR1 (Fig. 6d) [38]. Interestingly, SKMEL-28 cells failed to demonstrate functional Na–K–2Cl cotransport, thereby indicating that sphaeropsidin A affects an alternative Cl− transport mechanism involved in RVI in these cells. The most likely candidate is therefore the Cl−/HCO3 − exchanger (Fig. 8).
Expression of all three anion exchanger (AE1, AE2 and AE3) has been shown to be dysregulated in various types of cancer. In clear cell renal carcinoma, AE2 and AE3 mRNA expression levels are increased, but not AE1 [39]. In the present study, we found similar features with respect to melanomas (Fig. 8). Even if the activity of these exchangers does not fully parallel their expression [39], it appears that AE could play major roles in intracellular pH regulation, in particular in moderate acidic conditions observed in the cancer microenvironment [40]. Moreover, multidrug-resistant (MDR) cancers seem to overexpress AE at their mRNA levels, while their activity again appeared to be decreased at least at the basal level [41–43]. Indeed, MDR cancer cells treated with pro-apoptotic agents such as cisplatin display increased RVI transient recovery phase as compared to non-MDR models due to AE contributing to their resistant phenotype [44]. The overexpression of AE by MDR cells could explain the high sensitivity of MDR models to sphaeropsidin A, such as that observed in the present study. Accordingly, the use of either a Cl−/HCO3 − exchanger inhibitor DIDS or an AE2 oligonucleotide antisense led to apoptosis of highly aggressive hepatocarcinoma cells [45, 46]. AE2 appears of potential interest to combat several cancers because of the differential expression of its variants AE2a, AE2b1 or AE2b2 [47]. In cancer cells, the apical–basal epithelial polarity becomes rear–front polarity with NKCC1, NHE1 and Cl−/HCO3 − exchangers located at the leading edge of migrating cancer cells [48, 49]. More precisely, the regulatory pathway WNK-SPAK/OSR1-NKCC1 plays critical roles in glioma cell migration [50, 51]. Consistent with these observations, sphaeropsidin A was shown to inhibit breast cancer cell migration in vitro [21].
Finally, a comparison of sphaeropsidin A structure with those of known NKCC1 and Cl−/HCO3 − inhibitors reveals an important structural similarity. Thus, sphaeropsidin A together with NKCC1 inhibitor ethacrynic acid [52], WNK-SPAK/OSR1-NKCC1/NKCC2 pathway inhibitor STOCK1S-50699 [53] and Cl−/HCO3 − exchanger antagonist DPOFA [54] contain reactive Michael acceptor functionalities (Fig. 10, highlighted in blue). These α,β-unsaturated ketone and imine moieties are capable of covalently modifying their intracellular targets through the reactions with active site cysteines and lysines leading to a more effective inhibition of ion-transporter proteins known to be particularly sensitive to such alkylating agents [55].
Fig. 10.

Chemical structures of agents affecting NKCC1 and Cl−/HCO3 − ion transporters. The reactive Michael acceptor functionality is highlighted in blue and the arrows indicate the sites of potential reactions with active site nucleophiles
In conclusion, the present study provides evidence for the modulation of ion-transporter activity as a novel therapeutic strategy to combat drug-resistant cancers. The work identifies the fungal metabolite, sphaeropsidin A, as a lead agent to target chemotherapy-resistant cancers via a new mechanism of action based on RVI inhibition. This natural product appears to be effective regardless of the mode RVI mechanism, e.g., through NKCC1 or the combination of NHE and AE, expressed in a particular cancer cell type. Because upregulation of ion-transporter expression often plays a role in the development of drug resistance and the associated impairment of apoptosis, the reversal of the acquired resistance to conventional chemotherapy or targeted therapy with sphaeropsidin A and/or its analogs is a related area of promise. However, the lack of stability of sphaeropsidin A for in vivo delivery alone or in combination with chemotherapy is of concern and efforts to improve its metabolic properties by generating a library of analogs are currently ongoing and will be reported in due course.
Acknowledgments
R.K. is a director of research with the Fonds National de la Recherche Scientifique (FRS-FNRS; Belgium). E.D. is supported by NIH grants GM74771 and DK93501. A.K. acknowledges National Cancer Institute (Grant CA186046-01A1). A.C. and C.V. acknowledge University of Tours, INSERM, the "Région Centre" of France (LIPIDS project of ARD2020 Biomédicaments), the “Ligue Nationale Contre le Cancer”, Canceropole Grand Ouest, the Association “CANCEN” and Tours’ Hospital oncology association ACORT.”
Conflict of interest
The authors declare that they have no competing interests.
Footnotes
E. Delpire and R. Kiss are co-senior authors.
References
- 1.Buti S, Bersanelli M, Sikokis A, Maines F, Facchinetti F, Bria E, Ardizzoni A, Tortora G, Massari F. Chemotherapy in metastatic renal cell carcinoma today? A systematic review. Anticancer Drugs. 2013;24:535–554. doi: 10.1097/CAD.0b013e3283609ec1. [DOI] [PubMed] [Google Scholar]
- 2.Luke JJ, Schwartz GK. Chemotherapy in the management of advanced cutaneous malignant melanoma. Clin Dermatol. 2013;31:290–297. doi: 10.1016/j.clindermatol.2012.08.016. [DOI] [PMC free article] [PubMed] [Google Scholar]
- 3.Garbe C, Eigentler TK, Keilholz U, Hauschild A, Kirkwood JM. Systematic review of medical treatment in melanoma: current status and future prospects. Oncologist. 2011;16:5–24. doi: 10.1634/theoncologist.2010-0190. [DOI] [PMC free article] [PubMed] [Google Scholar]
- 4.Sullivan RJ, Flaherty KT. Major therapeutic developments and current challenges in advanced melanoma. Br J Dermatol. 2014;170:36–44. doi: 10.1111/bjd.12698. [DOI] [PubMed] [Google Scholar]
- 5.Chapman PB, Hauschild A, Robert C, Haanen JB, Ascierto P, Larkin J, Dummer R, Garbe C, Testori A, Maio M, Hogg D, Lorigan P, Lebbe C, Jouary T, Schadendorf D, Ribas A, O’Day SJ, Sosman JA, Kirkwood JM, Eggermont AM, Dreno B, Nolop K, Li J, Nelson B, Hou J, Lee RJ, Flaherty KT, McArthur GA. BRIM-3 Study Group. Improved survival with vemurafenib in melanoma with BRAF V600E mutation. N Engl J Med. 2011;364:2507–2516. doi: 10.1056/NEJMoa1103782. [DOI] [PMC free article] [PubMed] [Google Scholar]
- 6.Hauschild A, Grob JJ, Demidov LV, Jouary T, Gutzmer R, Millward M, Rutkowski P, Blank CU, Miller WH, Jr, Kaempgen E, Martín-Algarra S, Karaszewska B, Mauch C, Chiarion-Sileni V, Martin AM, Swann S, Haney P, Mirakhur B, Guckert ME, Goodman V, Chapman PB. Dabrafenib in BRAF-mutated metastatic melanoma: a multicentre, open-label, phase 3 randomised controlled trial. Lancet. 2012;380:358–365. doi: 10.1016/S0140-6736(12)60868-X. [DOI] [PubMed] [Google Scholar]
- 7.Sullivan RJ, Flaherty KT. Resistance to BRAF-targeted therapy in melanoma. Eur J Cancer. 2013;49:1297–1304. doi: 10.1016/j.ejca.2012.11.019. [DOI] [PubMed] [Google Scholar]
- 8.Iacovelli R, Alesini D, Palazzo A, Trenta P, Santoni M, De Marchis L, Cascinu S, Naso G, Cortesi E. Targeted therapies and complete responses in first line treatment of metastatic renal cell carcinoma. A meta-analysis of published trials. Cancer Treat Rev. 2014;40:271–275. doi: 10.1016/j.ctrv.2013.09.003. [DOI] [PubMed] [Google Scholar]
- 9.Porta C, Sabbatini R, Procopio G, Paglino C, Galligioni E, Ortega C. Primary resistance to tyrosine kinase inhibitors in patients with advanced renal cell carcinoma: state-of-the-science. Expert Rev Anticancer Ther. 2012;12:1571–1577. doi: 10.1586/era.12.81. [DOI] [PubMed] [Google Scholar]
- 10.Ravaud A, Gross-Goupil M. Overcoming resistance to tyrosine kinase inhibitors in renal cell carcinoma. Cancer Treat Rev. 2012;38:996–1003. doi: 10.1016/j.ctrv.2012.01.003. [DOI] [PubMed] [Google Scholar]
- 11.Calvo E, Ravaud A, Bellmunt J. What is the optimal therapy for patients with metastatic renal cell carcinoma who progress on an initial VEGFr-TKI? Cancer Treat Rev. 2013;39:366–374. doi: 10.1016/j.ctrv.2012.06.010. [DOI] [PubMed] [Google Scholar]
- 12.Figlin RA, Kaufmann I, Brechbiel J. Targeting PI3K and mTORC2 in metastatic renal cell carcinoma: new strategies for overcoming resistance to VEGFR and mTORC1 inhibitors. Int J Cancer. 2013;133:788–796. doi: 10.1002/ijc.28023. [DOI] [PubMed] [Google Scholar]
- 13.Cuddapah VA, Sontheimer H. Ion channels and transporters in cancer. 2. Ion channels and the control of cancer cell migration. Am J Physiol Cell Physiol. 2011;301:C541–C549. doi: 10.1152/ajpcell.00102.2011. [DOI] [PMC free article] [PubMed] [Google Scholar]
- 14.Hoffmann EK, Lambert IH. Ion channels and transporters in the development of drug resistance in cancer cells. Phil Trans R Soc B. 2014;369:20130109. doi: 10.1098/rstb.2013.0109. [DOI] [PMC free article] [PubMed] [Google Scholar]
- 15.Newman DJ, Cragg GM. Natural products as sources of new drugs over the 30 years from 1981 to 2010. J Nat Prod. 2012;75:311–335. doi: 10.1021/np200906s. [DOI] [PMC free article] [PubMed] [Google Scholar]
- 16.Cragg GM, Newman DJ. Natural products: a continuing source of novel drug leads. Biochim Biophys Acta. 2013;1830:3670–3695. doi: 10.1016/j.bbagen.2013.02.008. [DOI] [PMC free article] [PubMed] [Google Scholar]
- 17.Cragg GM, Grothaus PG, Newman DJ. Impact of natural products on developing new anti-cancer agents. Chem Rev. 2009;109:3012–3043. doi: 10.1021/cr900019j. [DOI] [PubMed] [Google Scholar]
- 18.Sparapano L, Bruno G, Fierro O, Evidente A. Studies on structure-activity relationship of sphaeropsidins A-F, phytotoxins produced by Sphaeropsis sapinea f. sp. cupressi . Phytochemistry. 2004;65:189–198. doi: 10.1016/j.phytochem.2003.11.006. [DOI] [PubMed] [Google Scholar]
- 19.Andolfi A, Maddau L, Basso S, Linaldeddu BT, Cimmino A, Scanu B, Deidda A, Tuzi A, Evidente A. Diplopimarane, a 20-nor-ent-pimarane produced by the oak pathogen Diplodia quercivora. J Nat Prod. 2014;77:2352–2360. doi: 10.1021/np500258r. [DOI] [PubMed] [Google Scholar]
- 20.Weber RW, Kappe R, Paululat T, Mösker E, Anke H. Anti-Candida metabolites from endophytic fungi. Phytochemistry. 2007;68:886–8892. doi: 10.1016/j.phytochem.2006.12.017. [DOI] [PubMed] [Google Scholar]
- 21.Wang XN, Bashyal BP, Wijeratne EM, U’Ren JM, Liu MX, Gunatilaka MK, Arnold AE, Gunatilaka AA. Smardaesidins A-G, isopimarane and 20-nor-isopimarane diterpenoids from Smardaea sp., a fungal endophyte of the moss Ceratodon purpureus . J Nat Prod. 2011;74:2052–2061. doi: 10.1021/np2000864. [DOI] [PMC free article] [PubMed] [Google Scholar]
- 22.Lallemand B, Masi M, Maddau L, De Lorenzi M, Dam R, Cimmino A, Moreno y Banuls L, Andolfi A, Kiss R, Mathieu V, Evidente A. Evaluation of in vitro anticancer activity of sphaeropsidins A-C, fungal rearranged pimarane diterpenes, and semisynthetic derivatives. Phytochem Lett. 2012;5:770–775. doi: 10.1016/j.phytol.2012.08.011. [DOI] [Google Scholar]
- 23.Mathieu V, Le Mercier M, De Neve N, Sauvage S, Gras T, Roland I, Lefranc F, Kiss R. Galectin-1 knockdown increases sensitivity to temozolomide in a B16F10 mouse metastatic melanoma model. J Invest Dermatol. 2007;127:2399–2410. doi: 10.1038/sj.jid.5700869. [DOI] [PubMed] [Google Scholar]
- 24.Chantome A, Girault A, Potier M, Collin C, Vaudin P, Pagès JC, Vandier C, Joulin V. KCa2.3 channel-dependent hyperpolarization increases melanoma cell motility. Exp Cell Res. 2009;315:3620–3630. doi: 10.1016/j.yexcr.2009.07.021. [DOI] [PubMed] [Google Scholar]
- 25.Paull KD, Shoemaker RH, Hodes L, Monks A, Scudiero DA, Rubinstein L, Plowman J, Boyd MR. Display and analysis of patterns of differential activity of drugs against human tumor cell lines: development of mean graph and COMPARE algorithm. J Natl Cancer Inst. 1989;81:1088–1092. doi: 10.1093/jnci/81.14.1088. [DOI] [PubMed] [Google Scholar]
- 26.Frédérick R, Bruyère C, Vancraeynest C, Reniers J, Meinguet C, Pochet L, Backlund A, Masereel B, Kiss R, Wouters J. Novel trisubstituted harmine derivatives with original in vitro anticancer activity. J Med Chem. 2012;55:6489–6501. doi: 10.1021/jm300542e. [DOI] [PubMed] [Google Scholar]
- 27.Mathieu V, Van Den Berge E, Ceusters J, Konopka T, Cops A, Bruyère C, Pirker C, Berger W, Trieu-Van T, Serteyn D, Kiss R, Robiette R. New 5-aryl-1H-imidazoles display in vitro antitumor activity against apoptosis-resistant cancer models, including melanomas, through mitochondrial targeting. J Med Chem. 2013;56:6626–6637. doi: 10.1021/jm400287v. [DOI] [PubMed] [Google Scholar]
- 28.Mijatovic T, Jungwirth U, Heffeter P, Hoda MA, Dornetshuber R, Kiss R, Berger W. The Na+/K+-ATPase is the Achilles heel of multi-drug-resistant cancer cells. Cancer Lett. 2009;282:30–34. doi: 10.1016/j.canlet.2009.02.048. [DOI] [PubMed] [Google Scholar]
- 29.Remillard CV, Yuan JXJ. Activation of K+ channels: an essential pathway in programmed cell death. Am J Physiol Lung Cell Mol Physiol. 2004;286:L49–L67. doi: 10.1152/ajplung.00041.2003. [DOI] [PubMed] [Google Scholar]
- 30.Okada Y, Shimizu T, Maeno E, Tanabe S, Wang X, Takahashi N. Volume-sensitive chloride channels involved in apoptotic volume decrease and cell death. J Membr Biol. 2006;209:21–29. doi: 10.1007/s00232-005-0836-6. [DOI] [PubMed] [Google Scholar]
- 31.Okada Y, Maeno E. Apoptosis, cell volume regulation and volume-regulatory chloride channels. Comp Biochem Physiol A: Mol Integr Physiol. 2001;130:377–383. doi: 10.1016/S1095-6433(01)00424-X. [DOI] [PubMed] [Google Scholar]
- 32.Dezaki K, Maeno E, Sato K, Akita T, Okada Y. Early-phase occurrence of K+ and Cl− efflux in addition to Ca2+ mobilization is a prerequisite to apoptosis in HeLa cells. Apoptosis. 2012;17:821–831. doi: 10.1007/s10495-012-0716-3. [DOI] [PubMed] [Google Scholar]
- 33.O’Neill WC. Physiological significance of volume-regulatory transporters. Am J Physiol. 1999;276:C995–C1011. doi: 10.1152/ajpcell.1999.276.5.C995. [DOI] [PubMed] [Google Scholar]
- 34.Delpire E, Staley KJ. Novel determinants of the neuronal Cl− concentration. J Physiol. 2014;592:4099–4114. doi: 10.1113/jphysiol.2014.275529. [DOI] [PMC free article] [PubMed] [Google Scholar]
- 35.Hoffmann EK. Ion channels involved in cell volume regulation: effects on migration, proliferation, and programmed cell death in non adherent EAT cells and adherent ELA cells. Cell Physiol Biochem. 2011;28:1061–1078. doi: 10.1159/000335843. [DOI] [PubMed] [Google Scholar]
- 36.Speers AG, Lwaleed BA, Featherstone JM, Sallis BJ, Cooper AJ. Furosemide reverses multidrug resistance status in bladder cancer cells in vitro. J Clin Pathol. 2006;59:912–915. doi: 10.1136/jcp.2005.033100. [DOI] [PMC free article] [PubMed] [Google Scholar]
- 37.Algharabil J, Kintner DB, Wang Q, Begum G, Clark PA, Yang SS, Lin SH, Kahle KT, Kuo JS, Sun D. Inhibition of Na[+]-K[+]-2Cl[−] cotransporter isoform 1 accelerates temozolomide-mediated apoptosis in glioblastoma cancer cells. Cell Physiol Biochem. 2012;30:33–48. doi: 10.1159/000339047. [DOI] [PMC free article] [PubMed] [Google Scholar]
- 38.Delpire E, Austin TM. Kinase regulation of Na+–K+–2Cl− cotransport in primary afferent neurons. J Physiol. 2010;588:3365–3373. doi: 10.1113/jphysiol.2010.190769. [DOI] [PMC free article] [PubMed] [Google Scholar]
- 39.Karumanchi SA, Jiang L, Knebelmann B, Stuart-Tilley AK, Alper SL, Sukhatme VP. VHL tumor suppressor regulates Cl−/HCO3 − exchange and Na+/H+ exchange activities in renal carcinoma cells. Physiol Genomics. 2001;5:119–128. doi: 10.1152/physiolgenomics.2001.5.3.119. [DOI] [PubMed] [Google Scholar]
- 40.Lee AH, Tannock IF. Heterogeneity of intracellular pH and of mechanisms that regulate intracellular pH in populations of cultured cells. Cancer Res. 1998;58:1901–1908. [PubMed] [Google Scholar]
- 41.Roepe PD, Wei LY, Cruz J, Carlson D. Lower electrical membrane potential and altered pHi homeostasis in multidrug-resistant (MDR) cells: further characterization of a series of MDR cell lines expressing different levels of P-glycoprotein. Biochemistry. 1993;32:11042–11056. doi: 10.1021/bi00092a014. [DOI] [PubMed] [Google Scholar]
- 42.Roepe PD, Weisburg JH, Luz JG, Hoffman MM, Wei LY. Novel Cl(−)-dependent intracellular pH regulation in murine MDR 1 transfectants and potential implications. Biochemistry. 1994;33:11008–11015. doi: 10.1021/bi00202a021. [DOI] [PubMed] [Google Scholar]
- 43.Luz JG, Wei LY, Basu S, Roepe PD. Transfection of mu MDR 1 inhibits Na(+)-independent Cl−/–HCO3 exchange in Chinese hamster ovary cells. Biochemistry. 1994;33:7239–7249. doi: 10.1021/bi00189a028. [DOI] [PubMed] [Google Scholar]
- 44.Poulsen KA, Andersen EC, Hansen CF, Klausen TK, Hougaard C, Lambert IH, Hoffmann EK. Deregulation of apoptotic volume decrease and ionic movements in multidrug-resistant tumor cells: role of chloride channels. Am J Physiol Cell Physiol. 2010;298:C14–C25. doi: 10.1152/ajpcell.00654.2008. [DOI] [PubMed] [Google Scholar]
- 45.Liu CJ, Hwang JM, Wu TT, Hsieh YH, Wu CC, Hsieh YS, Tsai CH, Wu HC, Huang CY, Liu JY. Anion exchanger inhibitor DIDS induces human poorly-differentiated malignant hepatocellular carcinoma HA22T cell apoptosis. Mol Cell Biochem. 2008;308:117–125. doi: 10.1007/s11010-007-9619-y. [DOI] [PubMed] [Google Scholar]
- 46.Hwang JM, Kao SH, Hsieh YH, Li KL, Wang PH, Hsu LS, Liu JY. Reduction of anion exchanger 2 expression induces apoptosis of human hepatocellular carcinoma cells. Mol Cell Biochem. 2009;327:135–144. doi: 10.1007/s11010-009-0051-3. [DOI] [PubMed] [Google Scholar]
- 47.Malumbres R, Lecanda J, Melero S, Ciesielczyk P, Prieto J, Medina JF. HNF1alpha upregulates the human AE2 anion exchanger gene (SLC4A2) from an alternate promoter. Biochem Biophys Res Commun. 2003;311:233–240. doi: 10.1016/j.bbrc.2003.09.200. [DOI] [PubMed] [Google Scholar]
- 48.Pedersen SF, Hoffmann EK, Novak I. Cell volume regulation in epithelial physiology and cancer. Front Physiol. 2013;4:233. doi: 10.3389/fphys.2013.00233. [DOI] [PMC free article] [PubMed] [Google Scholar]
- 49.Haas BR, Sontheimer H. Inhibition of the sodium-potassium-chloride cotransporter isoform-1 reduces glioma invasion. Cancer Res. 2010;70:5597–5606. doi: 10.1158/0008-5472.CAN-09-4666. [DOI] [PMC free article] [PubMed] [Google Scholar]
- 50.Zhu W, Begum G, Pointer K, Clark PA, Yang SS, Lin SH, Kahle KT, Kuo JS, Sun D. WNK1-OSR1 kinase-mediated phospho-activation of Na+–K+–2Cl− cotransporter facilitates glioma migration. Mol Cancer. 2014;13:31. doi: 10.1186/1476-4598-13-31. [DOI] [PMC free article] [PubMed] [Google Scholar]
- 51.Haas BR, Cuddapah VA, Watkins S, Rohn KJ, Dy TE, Sontheimer H. With-No-Lysine Kinase 3 (WNK3) stimulates glioma invasion by regulating cell volume. Am J Physiol Cell Physiol. 2011;301:C1150–C1160. doi: 10.1152/ajpcell.00203.2011. [DOI] [PMC free article] [PubMed] [Google Scholar]
- 52.Pogorevici A, Velciov SM, Secrii RV. The molecular and physiopathological mechanisms involved in response reduction to chronic diuretics therapy. TMJ. 2007;57:58–67. [Google Scholar]
- 53.De Los Heros P, Alessi DR, Gourlay R, Campbell DG, Deak M, Macartney TJ, Kahle KT, Zhang J. The WNK-regulated SPAK/OSR1 kinases directly phosphorylate and inhibit the K+–Cl− co-transporters. Biochem J. 2014;458:559–573. doi: 10.1042/BJ20131478. [DOI] [PMC free article] [PubMed] [Google Scholar] [Retracted]
- 54.Iserovich P, Qin Q, Petrukhin K. DPOFA, a Cl−/HCO3 − exchanger antagonist, stimulates fluid absorption across basolateral surface of the retinal pigment epithelium. BMC Ophthalmol. 2011;11:33. doi: 10.1186/1471-2415-11-33. [DOI] [PMC free article] [PubMed] [Google Scholar]
- 55.Wilson MC, Meredith D, Bunnun C, Sessions RB, Halestrap AP. Studies on the DIDS-binding site on monocarboxylate transporter 1 suggest a homology model of the open conformation and a plausible translocation cycle. J Biol Chem. 2009;284:20011–20021. doi: 10.1074/jbc.M109.014217. [DOI] [PMC free article] [PubMed] [Google Scholar]