

Abstract
Background
Diagnostic errors can occur, in infectious diseases, when anti-microbial immune responses involve several temporal scales. When responses span from nanosecond to week and larger temporal scales, any pre-selected temporal scale is likely to miss some (faster or slower) responses. Hoping to prevent diagnostic errors, a pilot study was conducted to evaluate a four-dimensional (4D) method that captures the complexity and dynamics of infectious diseases.
Methods
Leukocyte-microbial-temporal data were explored in canine and human (bacterial and/or viral) infections, with: (i) a non-structured approach, which measures leukocytes or microbes in isolation; and (ii) a structured method that assesses numerous combinations of interacting variables. Four alternatives of the structured method were tested: (i) a noise-reduction oriented version, which generates a single (one data point-wide) line of observations; (ii) a version that measures complex, three-dimensional (3D) data interactions; (iii) a non-numerical version that displays temporal data directionality (arrows that connect pairs of consecutive observations); and (iv) a full 4D (single line-, complexity-, directionality-based) version.
Results
In all studies, the non-structured approach revealed non-interpretable (ambiguous) data: observations numerically similar expressed different biological conditions, such as recovery and lack of recovery from infections. Ambiguity was also found when the data were structured as single lines. In contrast, two or more data subsets were distinguished and ambiguity was avoided when the data were structured as complex, 3D, single lines and, in addition, temporal data directionality was determined. The 4D method detected, even within one day, changes in immune profiles that occurred after antibiotics were prescribed.
Conclusions
Infectious disease data may be ambiguous. Four-dimensional methods may prevent ambiguity, providing earlier, in vivo, dynamic, complex, and personalized information that facilitates both diagnostics and selection or evaluation of anti-microbial therapies.
Introduction
Investigating the properties of infectious disease-related data may improve diagnostics and research. To that end, four-dimensional (three-dimensional plus temporal) approaches may be useful. While pursued for many years [1], four-dimensional (4D) methods remain scarce: the Web of Science™ currently retrieves less than ten hits when ‘four-dimensional analysis’ and ‘infection’ are searched.
Biological complexity is a major set of properties to be investigated. Infectious disease data may reveal, at least, four properties associated with complexity: (i) emergence, (ii) irreducibility, (iii) unpredictability, and (iv) autonomy [2–8]. Emergence is the central concept: it refers to the new features detected when a complex structure is assembled, which are not observed when its constitutive parts are individually measured [2]. Emergence cannot be reduced to the properties of any one variable. Unpredictability denotes the inability to anticipate emergence when only ‘simple’ and/or isolated variables are analyzed, e.g., immunoglobulins express emergent properties, which are neither reducible to first principles nor predictable [3]. Similarly, the emergent features of three-dimensional (3D) interactions–e, g, those associated with multi-cellularity–cannot be predicted by bi-dimensional models [4]. Autonomy is characterized by non-linearity: because causes and effects are not coupled, the effect (emergence) is numerically autonomous from the cause(s) [2].
Emergence may reflect hidden relationships: information usually non-observable may become apparent when the data are shaped as complex structures [9]. While complexity has been partially investigated in infections affecting non-human species [9, 10], this group of properties has not yet been explored in humans, including personalized medical practices.
A second set of interesting properties includes ‘one-to-many’/‘many-to-one’ relationships [11, 12]. Such properties occur when one structure (e.g., a cell type) participates in two or more functions and also when several structures act in the same function, e.g. (i) monocytes both promote and destroy neutrophils (‘one-to-many’ interactions) and (ii) both lymphocytes and monocytes are involved in antigen recognition (‘many-to-one’ interactions [13, 14]).
Spatial-temporal relativity is another property of biological data, not yet assessed in infectious diseases [15]. It refers to data collected over long periods of time, which may occupy a small portion of the space (plot) used to analyze the data, while observations collected over short periods of time–such as recent infections–may occupy a large plot space.
Biological spatial-temporal relativity may result in non-interpretable (ambiguous) data. Ambiguity occurs when numerically similar data express different biological conditions [16].
To prevent ambiguity, dynamics (temporal changes) should be investigated. To assess dynamics, it is necessary to address the fact that, in infections, numerous temporal scales may co-exist. Because anti-microbial immunity may simultaneously involve responses lasting from nanosecond to weeks and larger temporal scales [17, 18], any pre-selected temporal scale may fail to capture all biological changes–at least some processes will be missed.
To avoid information loss, pattern recognition should be considered. When arrows that connect two temporal observations are used (temporal data directionality) and 3D/4D patterns are assessed, emergence may be detected, even when space is not uniform [19–24].
Pattern recognition of perpendicular data subsets is facilitated by the use of 3D/4D plots. Perpendicular data subsets reflect non-overlapping data distributions. Such data subsets tend to differ at statistical levels, regardless of their number of observations.
Methods that detect 3D perpendicular data subsets could address the limitations of the ‘single structure/single sequence/single function’ paradigm–which no longer holds [25]. Because biology is characterized by much fewer structures than functions–as shown by the fact that only five cell types (lymphocytes, monocytes, neutrophils, eosinophils, and basophils) protect against a much larger number of microbes–, methods that explore data combinations are needed, which may take advantage of (i) a rather low number of interdependent relationships [26], (ii)‘one-to-many/many-to one’ relationships (e.g., the fact that no cell type, alone, performs any function, but two or more cell types do [12, 13]); and (iii) the informative value of emergence. Validity augments when hidden information is unveiled [9, 27, 28].
To validate methods likely influenced by the unpredictability of biological complexity, numerous comparisons–across individuals, populations, host species and/or microbes–are crucial. When similar patterns are observed across species and pathogens, the likely explanation is that such patterns are highly conserved and, therefore, reproducible [29–31].
Here, infectious disease data were investigated with two methods: (i) an approach that assesses cell types in isolation; and (ii) a method that measures immuno-microbial-spatial-temporal data interactions. The goals of this pilot study were (i) to elucidate whether infectious disease data express ambiguity; and (ii) to determine whether methods that capture complex dynamics prevent ambiguity and/or extract more information.
Materials and Methods
Longitudinal canine and human leukocyte and microbial data
Three sets of data on human infections were analyzed. The first set included seven septicpatients with no history of chronic non-infectious diseases, who were infected by various bacteria and met at least three systemic inflammatory response syndrome (SIRS) criteria [32]: body temperature > 38°C, heart rate > 90 beats/minute, tachypnea or hyperventilation (>20 breaths/minute or PACO2 < 32 mm Hg at sea level), and white blood cell count ≥ 12000 or ≤ 4000/μl. Blood leukocyte percentagess were determined, over three days, since hospital admission (Table A in S1 File).
Human blood leukocytes were also collected from two non-septic but infected patients (Tables B, C in S1 File). The first case was a 49-year old man previously diagnosed with human immunodeficiency virus (HIV), who presented with ~ 1% CD4+ T cells and, over four months, experienced methicillin-resistant and -sensitive Staphylococcus aureus (MRSA and MSSA, respectively) mediated infections. The second case was a 60-year old man that received a hip implant who, over seven months, had recurrent MSSA infections [33, 34].
To elucidate whether the 4D method could be applied to non-human species, blood leukocytes and bacteriological tests were explored in one dog (Table D in S1 File). Over 9 months, the animal was spontaneously infected, first, by the opportunistic Enterobacter cloacae [35] and, later, by Staphylococcus pseudointermedius (a common cause of skin infections [36]).
Laboratory methods
Identification and quantification of human leukocytes (lymphocytes [L], neutrophils [N] and monocytes [M]) were conducted with an automated hematology analyzer (Coulter LH 780 Analyzer, Beckman Coulter International SA, Nyon, Switzerland). Blood culture was performed with the automated Bactec 9249 instrument (Becton Dickinson, New Jersey, USA). The pathogens isolated from blood were identified and tested for their antimicrobial susceptibility with the automated microbiology system Phoenix 100 (Becton Dickinson, New Jersey, USA). Similar techniques were utilized to conduct canine studies in a veterinary hospital.
Methods
These studies were approved by the Scientific Committee of the Thriasio Hospital, Magoula, Greece (protocol 57/16-02-2015) and the Human Research Review and Institutional Animal Care and Use (IACUC) committees of the University of New Mexico (protocols numbers 13–463 and 13-101022-T-HSC). Informed consent was not provided because this study was conceived after patients were discharged or died. Patient records were de-identified prior to analysis.
To diminish data variability, a single (one data-point wide) line of observations was created–a structure that eliminates variability from all dimensions except the one defined by the single line. For example, a bi-dimensional plot that measures, in one axis, the phagocyte/ lymphocyte ratio (the sum of M and N percents divided over the L percentage) and, in the other axis, the L%, creates a single line of data points [37].
Three-dimensional (3D) plots were used to extract more information. The addition of depth, to height and width, may uncover data patterns that uni- or bi-dimensional plots cannot reveal.
To estimate complexity, dimensionless indicators were utilized [9, 10, 38, 39], consisting of combinations of counts, percentages, ratios, or products derived from primary variables. When the percents of L, M, and N are used in an equation that includes many interactions (e.g., the {[M/L * N/M] / [N/L * L/M]) over ([M+L/N] * [L+N/M] / [N+M]/L * [M/N]}), a dimensionless number is created: the number produced does not describe any known biological structure.
Dimensionless indicators (DI) can capture many levels of complexity. For instance, in the DI described above, one level of complexity (level I) is estimated by each ratio of the first element or ‘numerator’ (M/L, N/M, N/L, and L/M). Two more interactions (of level II complexity) are measured by each product (M/L * N/M, N/L * L/M). Complexity level III is evaluated by the composite ratio of the numerator ([M/L * N/M] / [N/L * L/M]). Because the second element (‘denominator’) has the same structure, the number of interactions doubles when the denominator is calculated. An additional interaction (complexity level IV) is generated when the numerator and the denominator are simultaneously analyzed. When three DIs are assessed in 3D space, the number of interactions increases three times and one more interaction (level V complexity) is produced when the overall (3D) relationship is plotted. Thus, the example shown above covers at least (4 x 2 +1 x 2 +1 x 3 +1) 58 interactions and five levels of complexity.
Furthermore, a sixth level of complexity was considered when dynamics were addressed [18]. Using non-numerical indicators (arrows that connected pairs of consecutive observations), temporal directionality was investigated. Such arrows detected multi-directional data flows.
This design revealed distinct 3D/4D patterns, which distinguished data subsets. The validity of each subset was determined by analyzing microbial test results and/or leukocyte data.
Data analysis
Because all DIs–except a few indicators (N/L, M/N, M/L, N*L, M*N and M*L)–, included the same data contents, DI were not described but identified with descriptors written in italics (e. g., AAR). Because DIs expressed hypothetical interactions, they were not biologically observable and, statistically, they were neither interpretable nor predictable [40]. However, after distinct spatial patterns (such as perpendicular data inflections) were detected, data subsets were differentiated and statistical comparisons among subsets were justified. Because differences among data subsets were based on their immune profiles, validations were biologically grounded. Dimensionless indicators were generated by a proprietary algorithm [9]. Leukocyte percents, products, or ratios were compared with the Mann-Whitney test, which tested whether medians differed across data subsets (Tables E-H in S1 File). Plots and statistical analyses were created or conducted with Minitab 17® (State College, PA, USA). The data described in the Table I in S1 File can be analyzed statistically with the procedure reported in the footnote of Table J in S1 File.
Results
The classic method was not predictive: leukocyte data did not separate different clinical presentations, such as infected and non-infected or fever-positive and -negative individuals (blue boxes, Fig 1a–1d). The analysis of temporal data did not improve discrimination (Fig 1e–1h).
Fig 1. Classic analysis of immuno-microbial data.

The classic method did not discriminate: leukocyte data distributions overlapped among different biological conditions, such as fever-positive and fever-negative individuals or individuals that recovered or did not recover from infections (blue boxes, a-d). The analysis of temporal data did not improve discrimination (e-h). Four studies were evaluated, including: (i) one dog [a, e], (ii) one human infected by MSSA [b, f]; (iii) one human HIV case, with a secondary MRSA infection [c, g]), and (iv) seven humans presenting with sepsis [d, h]).
Lack of discrimination was also observed when single (one data point-wide) lines were investigated within three-dimensional (3D) plots. In all studies, some numerically similar data points expressed different clinical conditions (ambiguity). Ambiguity was associated with spatial-temporal relativity: data points that corresponded to recent infections occupied more space and/or exhibited broader data ranges than observations not associated with recent infections and/or recorded over longer periods (Fig 2a–2d). Multi-directional temporal ambiguity was also detected: some pairs of consecutive observations displayed similar numerical values but expressed different temporal directionality (arrows within boxes, Fig 3a–3d).
Fig 2. Spatial-temporal data ambiguity.
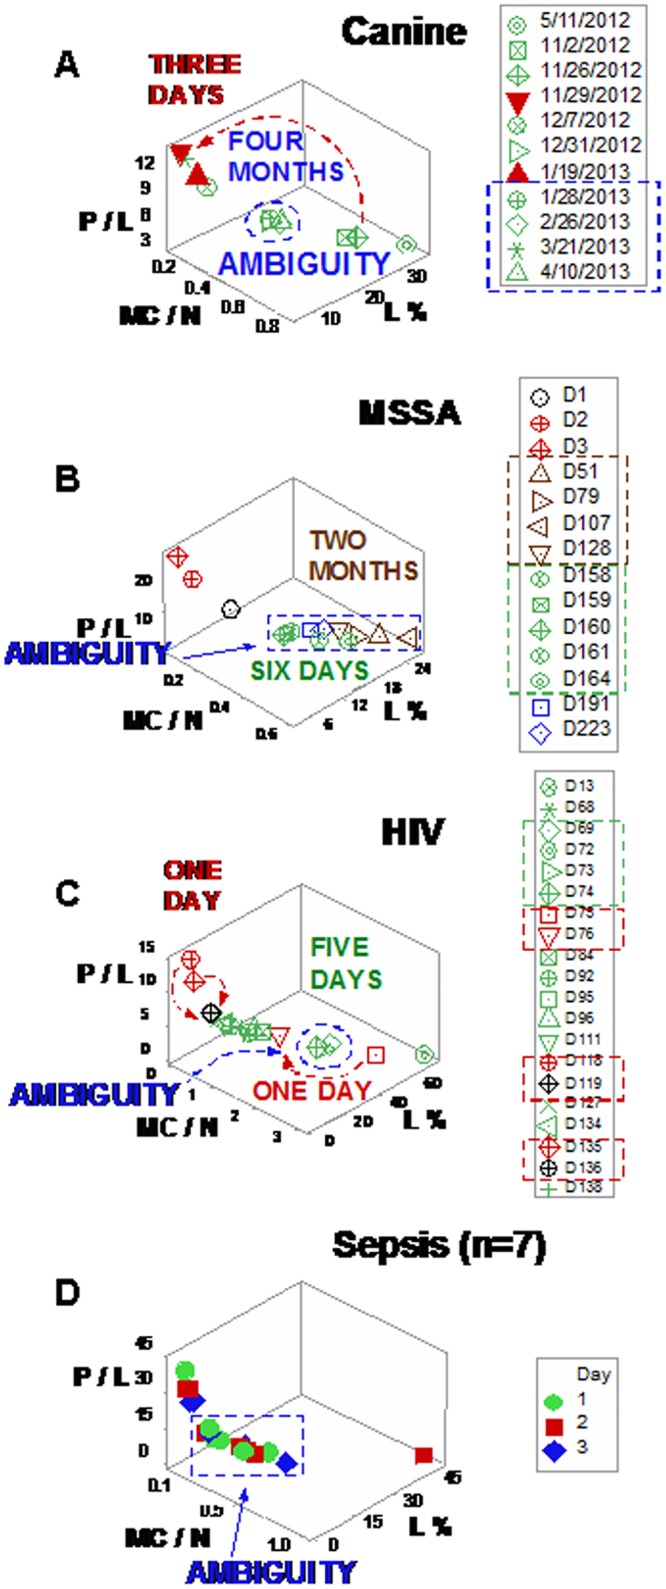
Ambiguity (numerically similar observations that expressed different biological conditions) was also documented when three-dimensional (3D) relationships were explored and single (one data point-wide) lines of observations were utilized to explore longitudinal data. Ambiguity exhibited spatial-temporal relativity: data points that corresponded to recent infections occupied more space and/or exhibited broader data ranges than observations not associated with recent infections and/or recorded over longer periods (a-d). For instance, observations recorded within three days (red arrow, a) displayed a broader data range than observations collected over the following four months (blue oval, a). Consequently, no numerical value of leukocyte data, per se, could distinguish recent from older or protracted responses.
Fig 3. Multi-directional data ambiguity.
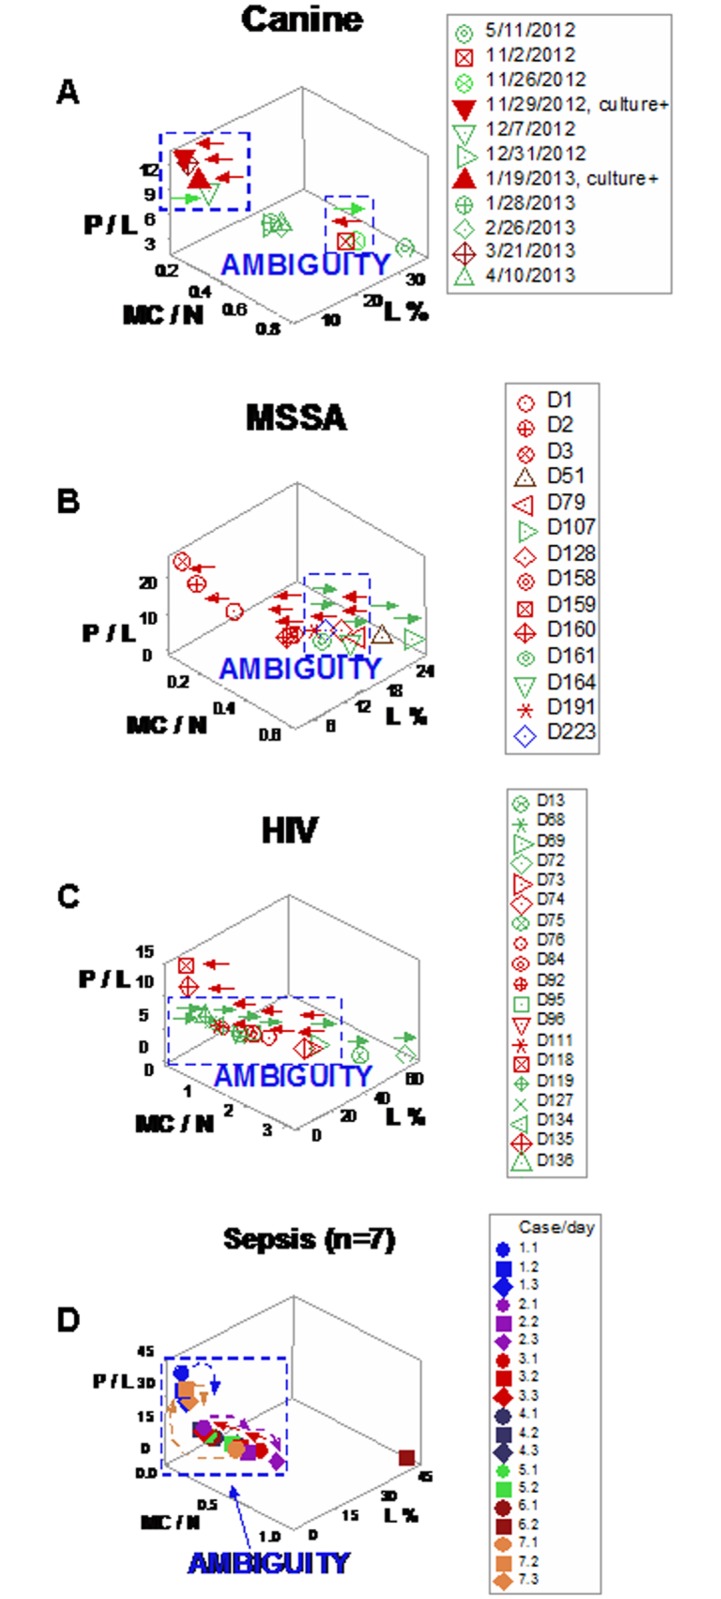
Ambiguity was also expressed when temporal data directionality was evaluated: arrows that connected pairs of consecutive observations displayed different temporal directionality even when they exhibited similar numerical information (boxes, a-d). Such pattern indicated that some dynamic changes took place at temporal scales smaller than the one utilized. Therefore, the 3D, single line of data points defined by the L%, the phagocyte/lymphocyte (P/L) and the mononuclear cell/neutrophil (MC/N) ratios failed to discriminate dynamics: some observations with similar numerical values, which expressed different biological conditions, were not distinguished.
Discrimination improved when dimensionless indicators (DIs) were utilized. For instance, three-dimensional (3D) canine patterns revealed two (‘left’ and ‘right’) data subsets (Fig 4a and 4b). The L%, the N/L and M/L ratios of such data subsets did not overlap (Fig 4c).
Fig 4. Canine leukocyte spatial-temporal relationships.

When dimensionless indicators (DIs) were utilized and three-dimensional (3D) patterns were considered, canine data revealed two (‘left’ and ‘right’) subsets (a, b). Spatial data subsets exhibited non-overlapping lymphocyte percentages and N/L and M/L ratios (c). When temporal data directionality was considered, arrows expressing different directionality (d) increased discrimination: 4D (spatial-temporal) patterns distinguished five subsets (in addition to the first observation) and non-overlapping N% differentiated the ‘right side/left-to-right flow’ observations from the first one (horizontal lines indicate non-overlapping data subsets, e).
Arrows with different directionality helped distinguish observations that expressed similar numerical values. Three data flows were detected in canine responses: (i) a left-to-right flow (red arrows), (ii) a right-to-left flow (green arrows), and (iii) a vertical, top-down flow (purple arrow, Fig 4d). Spatial-temporal flows differentiated five subsets from the first data point. Non-overlapping N/L and M/L ratio values discriminated left-side/right-to-left flow- from left-side/top-down flow-related observations (horizontal lines, Fig 4e). In addition, non-overlapping M/N data intervals distinguished right-side/left-to-right- from right-side/right-to-left flow data points (Fig 4e). When leukocyte profiles were analyzed, at least four comparisons among spatial (3D) or spatial-temporal (4D) subsets reached statistical significance (Table E in S1 File).
Three spatial subsets were identified when the MSSA hip implant human case was explored with dimensionless indicators (Fig 5a). All data points associated with antibiotic therapy were clustered within one subset, even though antibiotics were administered in two non-consecutive periods (green symbols and green boxes, Fig 5b). Fifteen leukocyte-related comparisons differed among the three spatial patterns (P≤0.04, Fig 5c and Table F in S1 File). Arrows that connected pairs of consecutive observations detected three ‘bottom-up’ and two ‘top-down’ observations (Fig 5d, red and blue arrows, respectively). Four spatial-temporal patterns were detected (Fig 5e). ‘Vertical/bottom-up’ observations showed statistically significantly higher N/L values than ‘vertical/top-down’ data points (horizontal line, Fig 5e and Table F in S1 File). The MSSA case also indicated antibiotic-related effects. Higher M/L values were observed after the first, but before the second antibiotic treatments (horizontal line, Fig 5f).
Fig 5. Human leukocyte spatial-temporal (MSSA/hip implant-related) relationships.

Three data subsets were identified when the MSSA/hip implant human case was explored with dimensionless indicators (a). All data points associated with antibiotic therapy were clustered within one subset (green polygon, b), even though antibiotics were administered in two non-consecutive periods (green boxes, b). The ‘vertical’ subset exhibited statistically significantly higher M/L values than the ‘bottom, left’ subset (c). When arrows that connected pairs of consecutive observations were assessed, three ‘bottom-up’ and two ‘top-down’ observations were detected (red and blue arrows, respectively, d). Changes in directionality were detected within one day: at days 159/160, one ‘bottom-up’ data point was followed by one ‘top-down’ observation (d). Spatial-temporal patterns (temporal data flows) differentiated four data subsets (e). The use of arrows distinguished ‘vertical, bottom-up’ from ‘vertical, top-down’ observations (horizontal line, e).
Informative patterns were also observed, in the HIV case, when DIs were analyzed. While viral load values were not informative (they exhibited more than 1000-fold changes among clinically stable observations, Fig 6a), data associated with bacterial isolations predominated in the ‘vertical’ data subset (Fig 6b). A second set of DIs amplified the detection of observations horizontally displayed (Fig 6c). Combining the patterns displayed by the first set of DIs with those expressed by the second set, data points were divided into ‘top vertical’ and ‘left horizontal’ observations and, together with ‘right horizontal’ data points, three data subsets were spatially differentiated (Fig 6d). The immune profile of such datasets showed non-overlapping L% and M/N ratio intervals (Fig 6d). Temporal flows distinguished data points that displayed similar numerical values but differed in directionality (days 118–119; and 135–136; arrows, boxes, Fig 6e and 6f). While the spatial (3D) analysis detected three data subsets, the spatial-temporal (4D) assessment differentiated five subsets and exhibited non-overlapping L %, M %, M/N, and N/L distributions (Fig 6g). Seven comparisons among subsets detected by either 3D or 4D patterns reached statistically significant differences (Table G in S1 File).
Fig 6. Human leukocyte spatial-temporal (HIV/MRSA-related) relationships.

Viral load values of the HIV+ patient were not informative: they exhibited more than 1000-fold changes among clinically stable observations (arrows indicating green symbols, a). In contrast, dimensionless indicators (DIs) differentiated two spatial (‘vertical’ and ‘horizontal’) subsets, which included two MRSA isolations within the vertical subset (set I, b), while all bacteria-negative data points were horizontally located (set II, b). A second set of DIs separated the ‘vertical’ data points into two sub-subsets: (i) the ‘top vertical’ and (ii) the ‘left horizontal’ groups, which did not overlap with the remaining (‘right horizontal’) data points (c). At least the L% and the M/N ratio distinguished the three spatial data subsets (d). More information was extracted when arrows that connected pairs of consecutive observations were measured (e, f). The assessment of spatial-temporal data directionality differentiated, twice, changes that took place within one day (days 118–119; and 135–136; arrows, e, f). While the spatial (3D) analysis detected only two or three data subsets (b, c), the spatial-temporal (4D) assessment distinguished five data subsets (g). For instance, the L%, M%, N/L, and M/N ratios differentiated ‘top vertical’ from the remaining observations (blue horizontal lines, g). The L% and N/L ratio also distinguished the ‘left/top-down’ observation from the ‘left/bottom-up’ observations (green horizontal lines, g). Furthermore, the N/L ratio discriminated the ‘right horizontal’ from the remaining subsets (red horizontal line, g). Some leukocyte profiles were associated with antibiotic therapy, for instance, higher M/L values were observed after antibiotics were prescribed, even after antibiotic therapy was discontinued (h).
Long-term antibiotic-related immune responses were also suggested in the HIV case. Higher M/L values were observed, even after cessation of antibiotic therapy (boxes, Fig 6h).
When dimensionless indicators were used to evaluate septic patients, three (‘left’, ‘vertical’, and ‘right’) subsets were detected (Fig 7a). The L% and the N/L ratio differentiated the ‘left’ from the remaining subsets, while M% values distinguished the ‘vertical’ from the ‘right’ subset (Fig 7b). Different temporal data flows were exhibited by several data points that expressed similar numerical values, which discriminated eight spatial-temporal patterns (Fig 7c and 7d). While several of such subsets only included one or two data point(s) (so, no statistical test could be conducted), spatial-temporal patterns prevented ambiguity; for instance, ‘right side/left-to-right’ and ‘bottom/right-to-left’ observations were differentiated from ‘right side/right-to-left’ and ‘bottom/left-to-right’ data points, respectively (Fig 7d).
Fig 7. Longitudinal relationships in septic humans.

Spatial patterns differentiated three data subsets among 7 septic patients analyzed with dimensionless indicators: (i) a vertical subset, (ii) a right subset, and (iii) the remaining observation, or ‘left’ subset (a). Higher M% and M/N ratio values distinguished the ‘right’ subset from the remaining data points, while higher L% and lower N/L ratio values differentiated the ‘left’ data point from the remaining observations (horizontal lines, b). Discrimination further improved when temporal and multidirectional data flows were assessed: several numerically similar observations displayed different directionalities (c). While not all observations could be analyzed statistically because some patterns included only one or two data point(s), the spatial-temporal analysis detected non-overlapping M% and M/N ratio distributions that differentiated by the ‘right’ subset with a left-to-right directional flow from the ‘right’ subset with a right-to-left flow (boxes, d). Non-numerical information (arrows) also distinguished ‘bottom/right-to-left’ from ‘bottom/left-to-right’ observations (boxes, d).
Discrimination was also achieved when leukocyte-explicit, low-complexity–not dimensionless–indicators were utilized. Two non-randomly distributed (perpendicular) data subsets were detected when the phagocyte/lymphocyte (P/L), the mononuclear cell/neutrophil (MC/N), and the neutrophil/lymphocyte (N/L) ratios were evaluated in septic patients (Fig 8a). When observations were classified according to the observed spatial patterns, eight between-subset comparisons differed statistically (Fig 8b; Tables I, J in S1 File).
Fig 8. Spatial analysis of low-complexity indicators.
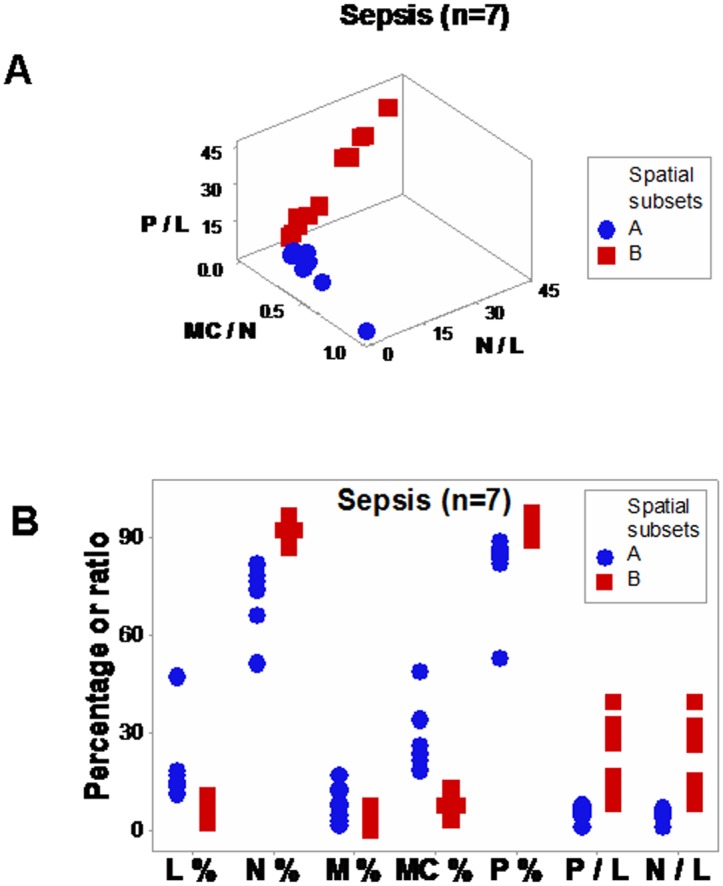
Even in its simplest version–which did not utilize dimensionless indicators–, the 4D method was more informative than the non-structured analysis reported in Fig 1. When low-complexity indicators that measured interactions involving two or more cell types were spatially analyzed (the phagocyte/lymphocyte [P/L], the mononuclear cell/neutrophil [MC/N], and the neutrophil/lymphocyte [N/L] ratios), two subsets of septic patients-related data, perpendicular to one another, were detected (a). The spatial analysis exhibited a single (one data point-wide) line of observations (a). When leukocyte data were partitioned according to the spatial patterns, several comparisons reached statistical significance ((b) and Table J in S1 File).
Spatial-temporal information also supported personalized assessments, even when low-complexity interactions were measured. Based on data directionality, flows that started in the center or left and, over time, moved to the right (Fig 9a and 9b) were distinguished from those that progressed from the right to the left side of the plot (‘right-to-left’ flows, Fig 9c–9e).
Fig 9. Spatial-temporal and personalized data analysis.

When the leukocyte data of five septic patients tested daily over three days were analyzed on personalized bases, several temporal patterns were observed (the data of the two remaining septic patients were not analyzed because they were tested only two days). At least two directionalities were differentiated: (i) data flows that came from the center or left and, over time, moved to the right (‘from left-to-right’, a, b); and (ii) responses that followed the opposite directionality (c-e). These responses were induced by: A. baumannii (a), E. faecalis (b), S. liquefaciens (c), and E. coli (d, e).
Discussion and Conclusions
Data ambiguity is not rare: it is observed across species and syndromes, when infectious disease-related data are analyzed as simple (non-structured) variables. To prevent ambiguity-related errors, spatial-temporal (4D) data interactions were evaluated. Findings revealed that 4D analysis may distinguish data subsets and prevent ambiguity.
Methodological considerations
The detection of hidden data interactions (i.e., emergent patterns) demonstrated that 4D approaches can extract more information than alternatives. Because validity is questionable when hidden information is not ruled out, findings supported the validity of the combinatorial approach [41, 42].
In addition, spatial-temporal relativity was documented [15]. Relativity was associated with ambiguous (non-interpretable) data. When ambiguity occurs, numerical procedures, such as statistical analyses and mathematical modeling, cannot be conducted [16]. Data ambiguity -here observed in infections- has also been reported in neurology [16].
To prevent ambiguity, a method was designed to reduce noise, detect complexity, and capture anti-microbial immune dynamics (temporal changes). To reduce variability, the data were structured as single (one data point-wide) lines of data points. This strategy was combined with the analysis of complexity and temporal data directionality. Because no uni- or bi-dimensional plot can reveal 3D/4D patterns, to detect complexity, the circularity of 3D data interactions was assessed [9, 10, 31]. Arrows that expressed where each data point came from/went to measured temporal data flows, even when they occurred within brief timeframes.
The use of arrows that connected pairs of consecutive observations met the definition proposed by Nielsen and Jorgensen: ‘orientors’ are indicators that identify short-term, immediate directionality (qualitative information) but lack long-term predictability [20]. Yet, the 4D method exceeded such criteria: it analyzed qualitative and quantitative data.
In agreement with earlier reports, distinct patterns emerged when, over time, one indicator changed in larger (or smaller) magnitudes than the remaining indicators [43]. Because the 4D method demonstrated multi-directional data flows, the central assumption of reductionist methods (the presence of only uni-directional flows) was rejected [22].
The impact of the 3D/4D combinatorial approach was summarized in the contrast shown by Figs 2d, 8a and 8b: while the same data were analyzed with the same variables (and 3D plots were used in both analyses), no discrimination (ambiguity) was revealed in Fig 2d, but distinct (and informative) patterns were conveyed by Fig 8a and 8b. The difference was due to a double strategy, implemented in Fig 8a and 8b: (i) the construction and measurement of interactions that involved two or more cell types (not isolated variables, such as the lymphocyte percent [measured in Fig 2d]), and (ii) the observation of perpendicular patterns–a procedure that separates subsets that differ in one or more immunological function(s) and, given their non-overlapping distributions, results in statistically significant differences (Fig 8b). This means that statistical analysis should be conducted after (not before) data subsets are distinguished [9].
Clinical applications and extraction of new information
The 4D approach partitioned the data into subsets [44]. Applications include: (i) earlier detection of infection, (ii) identification of subsets that differ in immune profiles (pathogenesis-based diagnostics), (iii) selection and evaluation of therapies, and (iv) prevention of ambiguity.
For instance, canine leukocyte patterns detected inflammation even when bacteriological tests were negative (open circle with a cross embedded, Fig 4d). Such information enables clinicians to intervene and/or prognosticate, earlier.
Higher M/L values were observed in the MSSA recurrent infection, after antibiotics were prescribed for the first time (Fig 5c). Such profile was consistent with reports that indicate monocytes increase earlier (approximately 3 days after initiation of an immune response) than lymphocytes [45]. However, because high M/L values were also observed after cessation of antibiotic treatments (in recurrent infections), the 4D method may also be used to explore topics of major medical interest: antibiotic-immunological-bacterial-temporal interactions [46].
New (and in vivo) methods are needed to reduce lengthy procedures and other limitations associated with in vitro perspectives. For example, antibiotic susceptibility tests cannot measure tissue environmental conditions, such as hypoxia [47]. While classic methods have focused on the microbe and used in vitro (or, when animal models are used, in vivo) approaches, such methods are error-prone because they (i) do not assess poly-microbial infections, (ii) ignore the fact that animal models do not truly represent human infection conditions, (iii) do not account for differences across individuals, and (iv) do not measure immune dynamics [48–52].
Earlier and more informative methods are also needed to evaluate antibiotics [53, 54]. Such new methods could consider (i) the predominant cell type(s) involved in some infections and (ii) the fact that some antibiotics synergize with (or inhibit) specific cell types [55–58]. For instance, immune responses against Salmonella species differ: those against typhoid fever-causing agents are monocyte-mediated, while responses against gastroenteritis-causing serovars are neutrophil-mediated [58]. In Pseudomonas aeruginosa-related infections, amikacin is synergistic with neutrophils but ciprofloxacin is not [59]. In spite of such reports, no method is available to explore antibiotic-immunologic-microbial-temporal relationships with earlier, in vivo inputs.
Changes in directional flows (observed even within a few hours) demonstrated earlier evaluations of antibiotic therapy are feasible and data ambiguity may be prevented. For example, the temporal flows of human leukocyte data demonstrated (three times) that antimicrobial interventions may interact not only with the microbe but also with the immune system (days 160–161 [hip implant/MSSA case, Fig 5d], and days 119–120 and 135–146 [HIV case, Fig 6e and 6f]).
This evaluation–conducted as a part of a process aimed at exploring the properties of infectious disease data–may, later, be implemented by clinicians that use a clinician-friendly software package. While such a package has not yet been developed (and, therefore, this approach is not ready for application in clinical settings), a simpler but informative approximation is already feasible: when data points are located within the range characterized by high P/L and N/L, as well as low MC/N values, an infection cannot be ruled out (red symbols, Fig 8a); in contrast, when observations exhibit high MC/N and low P/L and N/L values, recovery is likely (blue symbols, Fig 8a). When such data subsets are perpendicular to one another, they tend to differ at statistical significant levels, as shown here (Tables I, J in S1 File). When personalized data are considered, the presence or absence of data inflections may support or modify earlier decisions. For instance, when a data inflection is observed within one day, it may be suspected that such change is not a random effect and, consequently, earlier (diagnostic- and/or treatment-related) decisions may be defensible (Fig 9a). In contrast, when temporal data flows do not change in directionality, it may be suspected that earlier decisions were not effective and, consequently, they might be reevaluated (Fig 9e). When only a minor change in the data flow is observed (Fig 9b), an additional test (conducted a few hours later) and/or pattern amplification strategies (e.g., reducing the scale of the axis of interest) may improve data visualization.
While no data representation can replace clinical expertise, data visualizations that integrate several leukocyte data combinations may facilitate earlier interpretations. When–after a therapy is prescribed in response to a neutrophil-predominant profile, i. e., one characterized by a high N/L value–a shift toward a mononuclear cell-predominant profile is observed, the hypothesis that the infection is progressing toward recovery is supported. In contrast, when a neutrophil-predominant profile remains even after therapy, a revision of the earlier decision may be considered. Because directionality-based analyses do not require population-based metrics, 4D methods may apply to personalized medicine–where new methods are needed [18, 44].
The 4D analysis of infectious disease-related data properties–including dynamics and complexity–can prevent ambiguity and foster data partitioning into subsets, facilitating earlier, personalized, explanatory (immunology-based) inferences. To further explore such properties, prospective studies are recommended.
Supporting Information
(DOC)
Data Availability
All relevant data are within the paper and its Supporting Information files.
Funding Statement
The authors have no support or funding to report.
References
- 1.Bork P, Serrano L (2005) Towards cellular systems in 4D. Cell 121: 507–509. 10.1016/j.cell.2005.05.001 [DOI] [PubMed] [Google Scholar]
- 2.de Haan J (2006) How emergence arises. Ecol Complex 3:293–301. 10.1016/j.ecocom.2007.02.003 [DOI] [Google Scholar]
- 3.Casadevall A, Fang FC, Pirofski LA (2011) Microbial virulence as an emergent property: consequences and opportunities. PLoS Pathog 7(7): e1002136 10.1371/journal.ppat.1002136 [DOI] [PMC free article] [PubMed] [Google Scholar]
- 4.Yip D, Cho CH (2013) A multicellular 3D heterospheroid model of liver tumor and stromal cells in collagen gel for anti-cancer drug testing. Biochem Biophys Res Commun 433: 327–332. 10.1016/j.bbrc.2013.03.008 [DOI] [PubMed] [Google Scholar]
- 5.Stephan A (2006) The dual role of ‘emergence’ in the philosophy of mind and in cognitive science. Synthese 151:485–498. 10.1007/s11229-006-9019-y [DOI] [Google Scholar]
- 6.Huneman P (2012) Determinism, predictability and open-ended evolution: lessons from computational emergence. Synthese 185:195–214. 10.1007/s11229-010-9721-7 [DOI] [Google Scholar]
- 7.San Miguel M, Johnson JH, Kertesz J, Kaski K, Díaz-Guilera A, MacKay RS, et al. (2012) Challenges in complex systems science. Eur Phys J Special Topics 214:245–271. [Google Scholar]
- 8.Van Regenmortel M.H.V. (2007) The rational design of biological complexity: A deceptive metaphor. Proteomics 7, 965–975. 10.1002/pmic.200600407 [DOI] [PubMed] [Google Scholar]
- 9.Leitner G, Blum S, Rivas AL (2015) Visualizing the indefinable: three-dimensional complexity of ‘infectious diseases’. PLoS ONE 10(4):e0123674 10.1371/journal.pone.0123674 2015 [DOI] [PMC free article] [PubMed] [Google Scholar]
- 10.Rivas AL, Hoogesteijn AL, Piccinini R (2015) Beyond numbers: the informative patterns of staphylococcal dynamics. Curr Pharm Des 21: 2122–2130. 10.2174/1381612821666150310104053 [DOI] [PubMed] [Google Scholar]
- 11.Vepsäläinen K, Spence JR (2000) Generalization in Ecology and Evolutionary Biology: from hypothesis to paradigm. Biol Philos 15: 211–238. 10.1023/A:1006636918716 [DOI] [Google Scholar]
- 12.Uversky VN, Oldfield CJ, Midic U, Xie H, Xue B, Vucetic S, Iakoucheva LM, et al. (2009). Unfoldomics of human diseases: linking protein intrinsic disorder with diseases. BMC Genomics 10(Suppl 1):S7 10.1186/1471-2164-10-S1-S7 [DOI] [PMC free article] [PubMed] [Google Scholar]
- 13.Wynn TA, Chawla A, Pollard JW (2013) Macrophage biology in development, homeostasis and disease. Nature 496:445–454. 10.1038/nature12034 [DOI] [PMC free article] [PubMed] [Google Scholar]
- 14.Knowlton ER, Lepone LM, Li J, Rappocciolo G, Jenkins FJ, Rinaldo CR (2013) Professional antigen presenting cells in human herpesvirus 8 infection. Front Imunol 3: 427 10.3389/fimmu.2012.00427 [DOI] [PMC free article] [PubMed] [Google Scholar]
- 15.Auffrey C, Nottale L (2008) Scale relativity theory and integrative systems biology 1. Founding principles and scale laws. Prog Biophys Mol Biol 97: 79–114. 10.1016/j.pbiomolbio.2007.09.002 [DOI] [PubMed] [Google Scholar]
- 16.Amarasingham A, Geman S, Harrison MT (2015) Ambiguity and nonidentifiability in the statistical analysis of neural codes. PNAS 112: 6455–6460. 10.1073/pnas.1506400112 [DOI] [PMC free article] [PubMed] [Google Scholar]
- 17.Qu Z, Garfinkel A, Weiss JN, Nivala M (2011) Multi-scale modeling in biology: how to bridge the gaps between scales? Prog Biophys Mol Biol 107:21–31. 10.1016/j.pbiomolbio.2011.06.004 [DOI] [PMC free article] [PubMed] [Google Scholar]
- 18.D’Alessandro LA, Hoehme S. Henney A, Drasdo D, Klingmüller U (2015) Unraveling liver complexity from molecular to organ level: Challenges and perspectives. Prog Biophys Mol Biol 117: 78e86 10.1016/j.pbiomolbio.2014.11.005 [DOI] [PubMed] [Google Scholar]
- 19.Groesser SN, Schaffernicht M. Mental models of dynamic systems: taking stock and looking ahead. Sys Dyn Rev 28:46–68, 2012. 10.1002/sdr.476 [DOI] [Google Scholar]
- 20.Nielsen SN, Jorgensen SE (2013) Goal functions, orientors and indicators (GoFOrIt’s) in ecology. Application and functional aspects–strengths and weaknesses. Ecol Indic 28:31–47. 10.1016/j.ecolind.2012.12.015 [DOI] [Google Scholar]
- 21.Lake K (2012) Visualizing spacetime curvature via gradient flows. I. Introduction. Physical Review D 86: 104031 10.1103/PhysRevD.86.104031 [DOI] [Google Scholar]
- 22.Humphreys P. Synchronic and diachronic emergence. Minds and Machines 18:431–442, 2008. 10.1007/s11023-008-9125-3 [DOI] [Google Scholar]
- 23.Ricca RL. Detecting structural complexity: from visiometrics to genomics and brain research In: MATHKNOW Emmer M, Quarteroni A (Eds.): Springer-Verlag; 2009; Italia, Milano; 167–181. [Google Scholar]
- 24.Ludewig B, Stein JV, Sharpe J, Cervantes-Barragan L, Thiel V, Bocharov G (2012) A global “imaging” view on systems approaches in immunology. Eur J Immunol 42: 3116–3125. 10.1002/eji.201242508 [DOI] [PubMed] [Google Scholar]
- 25.Uversky VN, Davé V, Iakoucheva LM, Malaney P, Metallo SJ, Pathak RR, et al. (2014) Pathological unfoldomics of uncontrolled chaos: intrinsically disordered proteins and human diseases. Chem Rev 114: 6844–6879. 10.1021/cr400713r [DOI] [PMC free article] [PubMed] [Google Scholar]
- 26.Rosslenbroich B (2011) Outline of a concept for organismic systems biology. Semin Cancer Biol 21:156–164. 10.1016/j.semcancer.2011.06.001 [DOI] [PubMed] [Google Scholar]
- 27.Noble D (2010) Biophysics and systems biology. Phil Trans R Soc A 368:1125–1139. 10.1098/rsta.2009.0245 [DOI] [PMC free article] [PubMed] [Google Scholar]
- 28.Nish S, Medzhitov R (2011) Host defense pathways: role of redundancy and compensation in infectious disease phenotypes. Immunity 34: 629–636. 10.1016/j.immuni.2011.05.009 [DOI] [PMC free article] [PubMed] [Google Scholar]
- 29.Woese CR (2004) A new biology for a new century. Microbiol Mol Bio Rev 68: 173–186. 10.1128/MMBR.68.2.173-186.2004 [DOI] [PMC free article] [PubMed] [Google Scholar]
- 30.Wolkenhauer O, Green S (2013) The search for organizing principles as a cure against reductionism in systems medicine. FEBS J 280: 5938–5948. 10.1111/febs.12311 [DOI] [PubMed] [Google Scholar]
- 31.Rivas AL, Jankowski MD, Piccinini R, Leitner G, Schwarz D, Anderson KL, et al. (2013) Feedback-based, system-Level properties of vertebrate-microbial interactions. PLoS ONE 8(2): e53984 10.1371/journal.pone.0053984 [DOI] [PMC free article] [PubMed] [Google Scholar]
- 32.Balk RA (2014) Systemic inflammatory response syndrome (SIRS) Where did it come from and is it still relevant today? Virulence 5:20–26. 10.4161/viru.27135 [DOI] [PMC free article] [PubMed] [Google Scholar]
- 33.Decousser J-W, Desroches M, Bourgeois-Nicolaos N, Potier J, Jehl F, Lina G, Cattoir V, et al. (2015) Susceptibility trends including emergence of linezolid resistance among coagulase-negative staphylococci and meticillin-resistant Staphylococcus aureus from invasive infections. Int J Antimicrob Agents 46: 622–630. 10.1016/j.ijantimicag.2015.07.022 [DOI] [PubMed] [Google Scholar]
- 34.Valour F, Tasse J,.Trouillet-Assant S, Rasigade J-P, Lamy B, Chanard E, Verhoeven P, et al. (2014) Methicillin-susceptible Staphylococcus aureus clonal complex 398: high prevalence and geographical heterogeneity in bone and joint infection and nasal carriage. Clin Microbiol Infect 20: O772–O775. 10.1111/1469-0691.12567 [DOI] [PubMed] [Google Scholar]
- 35.Bannoehr J, Guardabassi L (2012) Staphylococcus pseudintermedius in the dog: taxonomy, diagnostics, ecology, epidemiology and pathogenicity. Vet Dermatol 23: 253–e52. 10.1111/j.1365-3164.2012.01046.x [DOI] [PubMed] [Google Scholar]
- 36.Sidjabat HE, Hanson HD, Smith-Moland E, Bell JM, Gibson JS, Filippich LJ, et al. (2007) Identification of plasmid-mediated extendedspectrum and AmpC b-lactamases in Enterobacter spp. Isolated from dogs. J Med Microbiol 56:426–434. 10.1099/jmm.0.46888-0 [DOI] [PubMed] [Google Scholar]
- 37.Fair JM, Rivas AL (2015) Systems Biology and ratio-based, real-time disease surveillance. Transb Emerg Dis 62: 437–445. 10.1111/tbed.12162 [DOI] [PubMed] [Google Scholar]
- 38.Klinke DJ (2009) Validating a dimensionless number for glucose homeostasis in humans. Ann Biomed Eng 37:1886–1896. 10.1007/s10439-009-9733-y [DOI] [PMC free article] [PubMed] [Google Scholar]
- 39.Nadell CD, Bucci V, Drescher K, Levin SA, Bonnie LC, Bassler BLC, et al. (2013) Cutting through the complexity of cell collectives. Proc R Soc B 280:20122770. 10.1098/rspb.2012.2770 [DOI] [PMC free article] [PubMed] [Google Scholar]
- 40.Van Regenmortel MHV (2007) The rational design of biological complexity: a deceptivemetaphor. Proteomics 7:965–975. [DOI] [PubMed] [Google Scholar]
- 41.Becker JM, Rai A, Ringle CM, Völckner F. (2013) Discovering unobserved heterogeneity in structural equation models to avert validity threats. MIS Quarterly 37: 665–694. [Google Scholar]
- 42.Hutchinson WJ, Kamakura WA, Lynch JG (2000) Unobserved heterogeneity as an alternative explanation for “reversal” effects in behavioral research. J Consumer Res 27:324–344. 10.1086/317588 [DOI] [Google Scholar]
- 43.Osinga HM, Sherman A, Tsaneva-Atanasova K (2012) Cross-currents between biology andmathematics: the codimension of pseudo-plateau bursting. Discrete Contin DynSyst 32:2853–2877. 10.3934/dcds.2012.32.2853 [DOI] [PMC free article] [PubMed] [Google Scholar]
- 44.Boomer JS, Green JM, Hotchkiss RS (2014) The changing immune system in sepsis: is individualized immuno-modulatory therapy the answer? Virulence 5:45–56. 10.4161/viru.26516 [DOI] [PMC free article] [PubMed] [Google Scholar]
- 45.Newson J, Stables M, Karra E, Arce-Vargas F, Quezada S, Motwani M, et al. (2014) Resolution of acute inflammation bridges the gap between innate and adaptive immunity. Blood 124:1748–1764. 10.1182/blood-2014-03-562710 [DOI] [PMC free article] [PubMed] [Google Scholar]
- 46.Pomorska-Mól M, Pejsak Z (2012) Effects of antibiotics on acquired immunity in vivo—current state of knowledge. Pol J Vet Sci 15: 583–589. [DOI] [PubMed] [Google Scholar]
- 47.Shima K, Szaszak M, Solbach W, Gieffers J, Rupp J (2011) Impact of a low-oxygen environment on the efficacy of antimicrobials against intracellular Chlamydia trachomatis. Antimicrob Agents Chemother 55: 2319–2324. 10.1128/AAC.01655-10 [DOI] [PMC free article] [PubMed] [Google Scholar]
- 48.Zhang M, Sala C, Dhar N, Vocat A, Sambandamurthy VK, Sharma S, et al. (2014) In vitro and in vivo activities of three oxazolidinones against nonreplicating Mycobacteriumtuberculosis. Antimicrob Agents Chemother 58: 3217–3223. 10.1128/AAC.02410-14 [DOI] [PMC free article] [PubMed] [Google Scholar]
- 49.Moriarty TF, Grainger DW, Richards RG (2014) Challenges in linking preclinical anti-microbial research strategies with clinical outcomes for device-associated infections. Eur Cell Mater 28:112–128. [DOI] [PubMed] [Google Scholar]
- 50.Busscher HJ, van der Mei HC, Subbiahdoss G, Jutte PC, van den Dungen JJ, Zaat SA, et al. (2012) Biomaterial-associated infection: locating the finish line in the race for the surface. Sci Transl Med 4: 153rv110. [DOI] [PubMed] [Google Scholar]
- 51.Grainger DW, van der Mei HC, Jutte PC, van den Dungen JJ, Schultz MJ, van der Laan BF, et al. (2013) Critical factors in the translation of improved antimicrobial strategies for medical implants and devices. Biomaterials 34: 9237–9243. 10.1016/j.biomaterials.2013.08.043 [DOI] [PubMed] [Google Scholar]
- 52.Firsov AA, Strukova EN, Shlykova DS, Portnoy YA, Kozyreva VK, Edelstein MV, et al. (2012) Bacterial resistance studies using in vitro dynamic models: the predictive power of the mutant prevention and minimum inhibitory antibiotic concentrations. Antimicrob Agents Chemother 57: 4956–4962, 2013. 10.1128/AAC.00578-13 [DOI] [PMC free article] [PubMed] [Google Scholar]
- 53.Azimian A, Havaei SA, Fazeli H, Naderi M, Ghazvini K, Samiee SM, et al. (2012) Genetic characterization of a vancomycin-resistant Staphylococcus aureus isolate from therespiratory tract of a patient in a university hospital in northeastern Iran. J Clin Microbiol 50: 3581–3585, 2012. 10.1128/JCM.01727-12 [DOI] [PMC free article] [PubMed] [Google Scholar]
- 54.Davis JS, Van Hal S, Tong SYC (2015) Combination antibiotic treatment of serious methicillin-resistant Staphylococcus aureus infections. Semin Respir Crit Care Med 36:3–16. 10.1055/s-0034-1396906 [DOI] [PubMed] [Google Scholar]
- 55.Akinnusi ME, Hattemer A, Gao W, El-Solh AA (2011) Does linezolid modulate lung innate immunity in a murine model of methicillin-resistant Staphylococcus aureus pneumonia? Crit Care Med 39:1944–1952. 10.1097/CCM.0b013e31821bd79e [DOI] [PubMed] [Google Scholar]
- 56.Towhid ST, Schmidt E-M, Tolios A, Münzer P, Schmid E, Borst O, et al. (2013) Stimulation of platelet death by vancomycin. Cell Physiol Biochem 31:102–112. 10.1159/000343353 [DOI] [PubMed] [Google Scholar]
- 57.Anuforom O, Wallace GR, Piddock LV (2015) The immune response and antibacterial therapy. Med Microbiol Immunol 204:151–159. 10.1007/s00430-014-0355-0 [DOI] [PubMed] [Google Scholar]
- 58.Raffatellu M, Chessa D, Wilson RP, Tükel Ç, Akcelik M, Bäumler AJ (2006) Capsule-mediated immune evasion: a new hypothesis explaining aspects of typhoid fever pathogenesis. Infect Immun 74: 19–27. 10.1128/IAI.74.1.19-27.2006 [DOI] [PMC free article] [PubMed] [Google Scholar]
- 59.Chatzimoschou A, Simitsopoulou M, Antachopoulos C, Walsh TJ, Roilides E (2015) Interactions with human polymorphonuclear leukocytes against established biofilms of Pseudomonas aeruginosa. Antimicrob Agents Chemother 59:2198–2205. 10.1128/AAC.04934-14 [DOI] [PMC free article] [PubMed] [Google Scholar]
Associated Data
This section collects any data citations, data availability statements, or supplementary materials included in this article.
Supplementary Materials
(DOC)
Data Availability Statement
All relevant data are within the paper and its Supporting Information files.