

Abstract
Resonance assignments are the first step in most NMR studies of protein structure, function, and dynamics. Standard protein assignment methods employ through-bond backbone experiments on uniformly 13C/15N-labeled proteins. For larger proteins, this through-bond assignment procedure often breaks down due to rapid relaxation and spectral overlap. The challenges involved in studies of larger proteins led to efficient methods for 13C labeling of side chain methyl groups, which have favorable relaxation properties and high signal-to-noise. These methyls are often still assigned by linking them to the previously assigned backbone, thus limiting the applications for larger proteins. Here, a structure-based procedure is described for assignment of 13C1H3-labeled methyls by comparing distance information obtained from three-dimensional methyl–methyl nuclear Overhauser effect (NOE) spectroscopy with the X-ray structure. The Ile, Leu, or Val (ILV) methyl type is determined by through-bond experiments, and the methyl–methyl NOE data are analyzed in combination with the known structure. A hierarchical approach was employed that maps the largest observed “NOE-methyl cluster” onto the structure. The combination of identification of ILV methyl type with mapping of the NOE-methyl clusters greatly simplifies the assignment process. This method was applied to the inactive and active forms of the 42-kDa ILV 13C1H3-methyl labeled extracellular signal-regulated kinase 2 (ERK2), leading to assignment of 60% of the methyls, including 90% of Ile residues. A series of ILV to Ala mutants were analyzed, which helped confirm the assignments. These assignments were used to probe the local and long-range effects of ligand binding to inactive and active ERK2.
Graphical abstract
Side chain methyl groups represent valuable probes for nuclear magnetic resonance (NMR) studies, where the rapid rotation of the methyl group combined with transverse relaxation-optimization (TROSY)-based techniques leads to higher signal-to-noise and resolution for larger proteins as compared with backbone amide groups.1–3 Chemical shift perturbations, nuclear Overhauser effect (NOE)-derived distances, and relaxation dispersion-derived kinetic data on methyl groups have been used to study regulation and activity in a variety of protein systems ranging from 30 kDa to 1 MDa.1,4,5 Detailed interpretation of the NMR data on methyl groups requires sequence-specific assignments. For favorable cases, the backbone resonance assignment can be extended to methyl resonances as shown for Ile Cδ1, Leu Cδ, and Val Cγ (ILV) methyl assignment on the 81-kDa malate synthase G.6 A “divide-and-conquer” approach was applied to a 670 kDa α7β7β7α7 20S proteasome, where methyl assignments were made for the individual α and β subunits and then mapped onto the larger protein complex and confirmed using methyl–methyl NOE data and mutagenesis.7,8 A high-throughput, systematic mutagenesis strategy has also been used to assign Ile and Ala methyls in the 468-kDa homododecameric PhTET2 protein.9 This approach employs efficient methods for expression and purification of a large set of single-site mutations, which are then analyzed by two-dimensional (13C,1H) heteronuclear multiple quantum coherence (HMQC)-type spectra.
Structure-based strategies have been developed for resonance assignment in proteins, where the structure of the protein, or a homology model of the protein, has already been determined.10–12 Various programs have been developed for structure-based methyl resonance assignment in proteins that combine the structural data with experimental data and theoretical information including distance information obtained from NOESY and/or paramagnetic relaxation enhancement (PRE) experiments, predictions of the 1H and 13C chemical shifts of methyl groups, labeling strategies that allow identification of residue-type or stereospecific assignment of methyls.9,13–20 Methods that employ PRE data require production of multiple constructs or mutant proteins, which is challenging for proteins that are not highly expressed in isotopically labeled media. Thus, to make NMR an accessible technique to a wider array of proteins, it is important to develop complementary methods that allow even partial methyl assignments with a minimum number of isotopically labeled protein samples.
Here we present a structure-based strategy for obtaining partial ILV side chain methyl assignments using three-dimensional (3D) methyl–methyl NOESY and 3D through-bond methyl side chain “out-and-back” experiments on two different isotopically ILV methyl-labeled samples combined with the X-ray structure (Figure 1). This strategy was applied to the 42-kDa protein, extracellular signal-regulated kinase 2 (ERK2), which had no pre-existing ILV methyl assignments. This method yielded 60% of Ile, Leu, and Val assignments, including 90% of Ile assignments. ERK2 is a critical component in the mitogen-activated protein (MAP) kinase signal cascade, where it helps regulate many cellular processes including proliferation, differentiation, and survival.21 Aberrant activation of ERK2 is found in multiple diseases, including cancer, diabetes, and heart disease.22 Previous studies yielded partial assignments (∼50%) of the backbone amides in ERK2,23 but these included few assignments of methyls. We previously studied conformational dynamics in both active and inactive ERK2 using ILV methyl probes,24 and the work here gives the detailed description of our methyl-assignment procedure. The structure-based method employed here bypasses the requirement for protein backbone assignments. Thus, this method provides a valuable approach for obtaining methyl assignments in larger proteins, where the structure, or structural-homologue, is known and backbone assignments are intractable.
Figure 1.

Hierarchical strategy for structure-based assignment of the ILV methyl resonances in ERK2. (a) Identification of methyl residue type (I, L, or V) utilizes both the 13C chemical shifts and through-bond correlation experiments. (b) The predicted and observed Ile–Ile NOE clusters are analyzed first using a hierarchy of largest to smallest clusters. If there is only a single observed and predicted Ile cluster of a particular size, then this cluster can be uniquely mapped onto the X-ray structure. If a cluster cannot be uniquely mapped using only Ile–Ile NOEs then additional Ile–Val and Ile–Leu NOEs are progressively analyzed to try to uniquely map each cluster onto the structure. (c) Once specific clusters have been mapped onto the X-ray structure, the patterns and sizes of the predicted and observed methyl–methyl NOEs are qualitatively analyzed to assign individual methyl resonances within a cluster to specific residues in the sequence. Examples for various criteria are given in italics.
The methyl assignments obtained by the approach described here were previously used to identify altered conformational dynamics upon activation of ERK2.24 Those functional studies of ERK2 were extended here where these methyl groups were used to probe the effects of binding of two different ligands to active and inactive ERK2: a non-hydrolyzable ATP analogue, AMP-PNP; and a peptide Elk1D, which is derived from the transcription factor Elk1, a substrate of ERK2. Analysis of the NMR data showed that AMP-PNP induced long-range effects in both active and inactive ERK2 and that AMP-PNP shows slow kinetics for binding to ERK2 on the NMR chemical shift time scale. In contrast, the binding of the peptide Elk1D induced only local effects around the binding site and showed fast kinetics for binding. These studies illustrate how structure-based methyl assignment procedures can be used to study protein function in larger proteins.
MATERIALS AND METHODS
Protein Preparation
The expression and purification of wild-type 0P-ERK2 in Escherichia coli BL21(DE3) cells were performed as described.24 The samples used in the 2D (13C,1H) HMQC and 3D NOESY experiments were uniformly 2H/15N-labeled and selectively ILV-methyl-labeled on Ile (13CδH3), Leu (13CδH3, 12CδD3), Val (13CγH3, 12CγD3), using labeled α-keto-3-(methyl-D3)-butyric acid-4-13C and 2-ketobu-tyric acid-4-13C precursors before induction as described.24 The protein for the 3D-HMCMCBCA experiment was uniformly 2H/15N-labeled with selective labeling of Ile (13CδH3, 13CγD2), Leu (13CδH3, 12CδD3, 13CγD, 13CβD2), Val (13CγH3, 12CγD3, 13CβD, 13CαD) using the precursors 2-keto-3-(methyl-D3)-1,2,3,4-13C4-3-D1-butyrate and 2-keto-3,3-D2-1,2,3,4-13C4-butyrate.1 This sample was grown in minimal media in 99% D2O with 3 g/L D-glucose 12C6-D7 and 1 g/L 15NH4Cl. The sample of 2P-ERK2 was prepared from 0P-ERK2 using a constitutively active MAP kinase kinase as described.24 Ile, Leu, or Val to Ala mutations (I101A, L102A/Q103A, L105A, L110A, L113A, I124A, L154A, L155A, L161A, L198A, L235A, and I238A) were prepared from wild-type ERK2 using the QuikChange Mutagenesis kit (Stratagene), and these 0P-ERK2 mutants were prepared the same as the samples used in NOESY experiments. All NMR samples were exchanged to a buffer containing 50 mM Tris pH 7.4, 150 mM NaCl, 5 mM MgSO4, 0.1 mM EDTA, 5 mM DTT, 99% D2O, and 2.5% (v/v) glycerol, and concentrated to 0.3–0.4 mM for wild-type 0P- or 2P-ERK2, and 0.1–0.2 mM for the mutant 0P-ERK2.
NMR Experiments
All the NMR experiments were performed at 25 °C on a Varian VNMRS 800 MHz spectrometer with a z-axis gradient cryoprobe. Two-dimensional (13C, 1H) TROSY-HMQC experiments on wild-type and mutant ERK2 were performed as described,24 with acquisition times ranging from 1 to 4 h, depending upon the sample concentration. The 3D (13C, 13C, 1H) HMCMCBCA experiment on 0P-ERK2 was performed as described.6 The 3D (13C, 13C, 1H) HMQC-NOESY-HMQC experiments25 were performed on 0P- and 2P-ERK2 using a 350 ms mixing time with total acquisition times of 96 and 82 h, respectively. The 3D (1H, 13C, 1H) HMQC-NOESY experiments26 were performed similarly except with a mixing time of 300 ms. The NMR data were processed with the NMRPipe software package.27 The points in each indirect dimension were linear-predicted in a forward–backward manner,28 and the time-domain data in all dimensions were apodized with a cosine bell and zero filled prior to Fourier transformation. Baseline corrections were applied after Fourier transformation as needed. The spectra were further visualized and analyzed using the program CcpNmr Analysis.29
Analysis of X-ray Structure
Protons were added to the X-ray structure coordinates of ERK2 (PDB 1ERK) using the program http://spin.niddk.nih.gov/bax/nmrserver/pdbutil/sa.html. Distances between centers of the methyl protons were estimated using an in-house script. Empirically derived cutoffs of 8.0, 7.1, and 6.3 Å were used to define I–I, I–L/V, and V/L–V/L clusters, which take into account the lower intensities of L/V resonances in the samples used here. Solvent accessible surface areas for ERK2 were estimated using the server GETAREA30 (http://curie.utmb.edu/getarea.html), with a 1.4 Å radius spherical water probe.
Binding of Elk1D to ERK2
The peptide Elk1D31 (QKGRKPRDLELPLSPSL, ANASPEC) was prepared in the same buffer as the ERK2 sample. Elk1D was titrated into 0P-(50 μM) or 2P-ERK2 (80 μM) where 5 h 2D (13C, 1H) TROSY-HMQC spectra were collected and analyzed for each titration point. The titration was stopped when there were no longer any changes in the chemical shifts of the complex. The combined chemical shift perturbation (CSPC,H) for individual methyls was calculated using the equation:32
| (1) |
where CSPH and CSPC are the chemical shift perturbations (in ppm) of ERK2 in the 1H and 13C dimensions. The Kd values were estimated by globally fitting CSPC,H with the following equation:
| (2) |
where CSPC,H(max) is the maximum chemical shift perturbation between free and bound ERK2, and [Elk1D] and [ERK2] are the total concentrations of Elk1D and ERK2 for each titration point. A single Kd was fit for all the methyls with individual CSPC,H(max) values for each methyl resonance.
Binding of AMP-PNP to ERK2
A 50 mM AMP-PNP (Sigma-Aldrich) stock solution was prepared in the same buffer as the ERK2 sample described above. The 0P- and 2P-ERK2 samples used in the AMP-PNP binding experiment were prepared using the same procedure as the samples used in the 3D-NOESY experiments, except that these two samples were grown in a protonated background. A set of 5 h 2D (13C, 1H) TROSY-HMQC spectra were collected on the ∼0.26 mM 0P-ERK2 and ∼0.3 mM 2P-ERK2 samples with AMP-PNP concentrations of 0, 0.1, 0.2, 0.3, 1.0, 2.1, and 4.2 mM in the titrations on 0P-ERK2, and 0, 0.15, 0.3, 0.6, 1.2, and 2.4 mM in the titrations on 2P-ERK2. The combined chemical shift perturbation (CSPC,H) of each methyl was calculated as described above.
RESULTS
Strategy for Assignment of ILV Methyls in Proteins with Known Structure
The strategy employed here for resonance assignment of an ILV 13CH3-methyl labeled protein with a known X-ray structure is illustrated in Figure 1 and involves comparing the observed methyl–methyl NOEs with those predicted from the structure. To simplify this comparison, three levels of analysis were employed. The first level is identification of the methyl type (I, L, or V) for both partners in each NOE using through-bond 13C, 1H correlation experiments (Figure 1a). The second level is comparison of the predicted and observed NOEs in a hierarchical manner starting with Ile–Ile NOEs followed progressively by Ile-Val, Ile-Leu, Val-Val, Val-Leu, and Leu-Leu NOEs (Figure 1b). The rationale for this hierarchy is that NOEs involving Ile methyls have a higher signal-to-noise than Val/Leu methyls in the labeling strategy used here, and there are generally fewer Ile or Val residues in a protein than Leu residues.33 This level also involves ranking of the sizes of so-called “NOE clusters.” A NOE cluster is defined as two or more methyls of the same residue type (e.g., Ile) that are linked through NOEs as well as methyls of other residue types (e.g., Leu/Val) that show NOEs to the methyls of the original residue type. For example, an Ile methyl is included in an Ile-NOE cluster if it shows an NOE to at least one other Ile, and a Val/Leu residue is included in the cluster if its methyl(s) show NOEs to an Ile residue in the cluster. The number of methyls of a certain residue type within the cluster determines the size of a cluster. For example, an n-residue Ile cluster is a NOE cluster including n Ile methyls that are linked through NOEs. The hierarchical approach employed here analyzes the NOE clusters with largest number of Ile residues first. If there is a single n-residue Ile-cluster observed in the NOESY spectra and also predicted in the structure, then this cluster can be uniquely mapped onto the protein. When there is ambiguity in the mapping, the next step in the analysis involves comparison of predicted and observed Ile methyl to Val/Leu methyl NOEs within this cluster. As more Ile-NOE clusters are mapped onto the structure, this reduces the number of possibilities for the remaining clusters.
The same approach is used to map Val-NOE clusters onto the protein followed by Leu-NOE clusters (Figure 1b). At this point, most of the methyls in a cluster have not been assigned to specific residues but have only been associated with one or more clusters in the structure. The next level of analysis involves qualitative comparison of the patterns and sizes of the NOEs with the predicted methyl–methyl distances from the X-ray structure (Figure 1c). This allows residue-specific resonance assignments for many methyl groups and ambiguous or tentative assignments for others. Additional information, such as NMR data on single-site ILV mutants, can then be used to confirm or extend the methyl resonance assignments. The application of this strategy for ERK2 was done manually, but this hierarchical NOE-cluster approach to ILV methyl resonance assignment is well suited to automation.
Identification of Residue Type for ILV Methyls in 0P-ERK2
The first step in the assignment of the ILV methyls in 0P-ERK2 was to determine whether a resonance belonged to an Ile, Val, or Leu residue. Figure S1 shows the ILV methyl region of the 2D (13C, 1H) TROSY-HMQC spectrum on an Ileδ1-[13CH3], Leuδ/Valγ-[13CH3,12CD3], U-[15N,12C,2H]-la-beled 0P-ERK2 sample that was generated as described in Methods. ERK2 has 144 Ile, Leu, and Val methyls, and 140 resonances (97%) were observed in the HMQC spectrum of 0P-ERK2 (Figure S1). The Ile Cδ1-methyl resonances were readily identified based on their distinctive 13C-chemical shifts,14 where the criteria used here were that methyls with 13C chemical shifts <18 ppm were identified as Ile. As discussed below, the HMCMCBCA experiment was used to further validate identification of Ile residues. ERK2 has 28 Ile residues and 26 resolved peaks were observed in the Ile methyl region of the HMQC spectrum (Figure S1). Analysis of the HMQC spectra of mutants of ERK2 and the NOE patterns observed in wild-type ERK2 showed that two sets of Ile resonances were overlapped, and therefore all 28 Ile methyls were observed in the HMQC spectrum of 0P-ERK2.
The next step in the resonance assignment was determining whether the non-Ile methyl resonances originated from a Leu or Val residue. A total of 112 of the 116 expected Leu/Val-methyl resonances were observed in the HMQC spectrum of 0P-ERK2 (Figure S1). A through-bond “out-and-back” 3D (13C, 13C, 1H) HMCMCBCA experiment6 was employed here on methyl protonated (Ileδ1-[13CH3], Leuδ/Valγ-[13CH3,12CD3]), and Ileγ/Leuβ,γ/Valα,β-[13C], U-[15N,12C,2H]-labeled 0P-ERK2 (Figure 2a and Methods). This experiment correlates an individual Ile, Leu, or Val-methyl group with aliphatic carbons on the same side chain. Only one non-methyl 13C resonance is observed in the aliphatic carbon dimension of the HMCMCBCA spectrum for each Ile residue, confirming residue-type identification of Ile methyls, whereas up to two non-methyl resonances are observed for both Leu (Cβ, Cγ) and Val (Cα, Cβ) residues (Figure 2b). It is also possible to determine the number of carbon–carbon bonds between the 13C and the methyl group from analysis of both the sign and chemical shift of these 13C resonances.6 Residue-type identification for the majority of the Leu and Val residues was made using the distinct chemical shift ranges of the Leu Cβ and Val Cα resonances (Figure 2b and BMRB34). These chemical shift ranges would correctly identify residue type for 99.7% of the Val and Leu methyls based on data in the BMRB (see Figure 2b). If further confirmation is needed, a through-bond 3D HMCM[CG]CBCA experiment6 can be used to distinguish Leu and Val residues independent of the chemical shifts, as previously described for 0P-ERK2.24 This led to identification of 62 of the 88 Leu methyls and 25 of the 28 Val methyls in 0P-ERK2. For 12 Val and 19 Leu residues, the unique chemical shifts of the Cα, Cβ (Val) or Cβ, Cγ (Leu) resonances made it possible to assign both methyl resonances of the same residue. The labeling method employed here does not allow a priori stereospecific assignments of the pro-R and pro-S methyl groups in Leu or Val, although in some cases stereospecific assignment could be deduced by analysis of the NOE data and crystal structure.
Figure 2.

Identification of methyl residue type in ERK2 using 13C chemical shifts and through-bond 3D HMCMCBCA spectra. (a) The pattern of 13C-labeling for Ile, Leu, and Val residues in the ERK2 samples used in this 3D experiment, where, as previously described,1 several of the side chain carbons in Ile, and backbone carbons in Leu, originate from the 12C-labeled glucose and not from the 13C-labeled precursor (see Methods). The aliphatic carbons colored blue and magenta have opposite signs for their resonances in the 3D spectrum. (b) Strip plots of the 3D HMCMCBCA spectrum for 0P-ERK2 showing distinct chemical shifts for Leu and Val aliphatic carbons. In the 13C aliphatic dimension, Ile residues have one peak, whereas two peaks of opposite sign (colored blue and magenta) are observed for Leu (Cγ and Cβ) and Val (Cβ and Cα). The brackets denote the typical range of chemical shift (average ± 3σ, 99.7%) for a specific aliphatic carbon in ILV using data from the BMRB.34 The identity of Leu and Val was primarily determined by the distinct chemical shifts of the Val Cα and the Leu Cβ resonances (see text).
Ile-NOE Clusters as the Starting Point for Methyl Resonance Assignments in 0P-ERK2
Identification of Ile-NOE clusters in the 3D NOESY spectra was the next step in resonance assignment in 0P-ERK2 (Figure 1b). The isotope-labeled sample used in the NOESY experiment has complete 13CH3 labeling of the δ1 methyl on Ile,35 whereas the racemic mixture of the precursor metabolite results in 13CH3-labeling of only one of two methyl groups on each Leu and Val residue in an individual protein.36 Although this labeling scheme leads to ∼50% lower signal-to-noise for the Leu or Val methyl resonances relative to Ile methyls in the TROSY-HMQC spectrum, as discussed by Kay and co-workers,37,38 it actually yields better sensitivity and resolution in both 2D HMQC and 3D NOESY spectra for Leu or Val resonances than having both methyls 13CH3-labeled in Leu or Val. NOE clusters of Ile residues were therefore used first because these methyls have more intense NOE cross peaks than Val/Leu methyls (assuming equivalent relaxation and methyl–methyl distances) and because there is only one labeled methyl per residue, which avoids complications involving stereospecific assignments. Two 3D NOESY spectra were collected that had either (13C, 13C, 1H) or (1H, 13C, 1H) frequency labeling periods (see Methods). An Ile methyl in the Ile-NOE cluster must show an NOE(s) to at least one other Ile in the cluster; however, not all Ile methyls in a cluster will show NOEs to each other, especially for larger clusters.
Thirty Ile-Ile methyl NOE cross peaks were observed in the 3D (13C, 13C, 1H) NOESY spectrum of 0P-ERK2, arising from multiple Ile clusters. The largest Ile-NOE cluster in the 3D (13C, 13C, 1H) NOESY spectrum of 0P-ERK2 consisted of six Ile residues, giving rise to 18 Ile–Ile NOE cross peaks (Figure 3a). The second largest Ile-NOE cluster consisted of three Ile residues, with five pairs of two-residue Ile-NOE clusters (referred to below as Ile-pairs).
Figure 3.

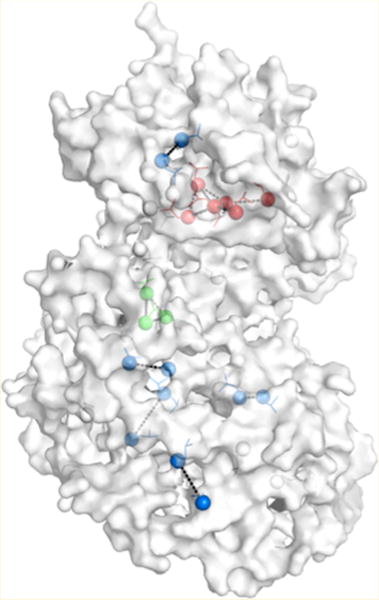
Mapping of Ile-methyl-NOE clusters onto the X-ray structure of ERK2. (a) Strip plots of the 3D (13C, 13C, 1H) HMQC-NOESY-HMQC spectra for 0P-ERK2 illustrating the Ile-methyl-NOE clusters in the protein. Diagonal peaks are marked with squares, the horizontal solid lines indicate NOE cross peaks to other methyls, and dashed lines indicate where a cross peak is not observed. Asterisks mark peaks that arise from bleed-through in the third dimension from a different methyl resonance, and double asterisks indicate noise peaks or artifacts. The numbers at the bottom of each strip plot are the 13C chemical shift for this methyl plane. (b) Geometry models illustrating the various Ile-methyl-NOE clusters in ERK2. The numbers at the vertex represent the methyl for that strip plot in (a) and a line connecting two vertices indicates an observed NOE between these two methyls with single and double headed arrows indicating that one and two NOE cross peaks, respectively, were observed between the two resonances. (c) Ile-methyl clusters in the X-ray structure of ERK2 that fit the geometry models in (b). The upper panel shows the only six-residue Ile-methyl cluster (using an 8 Å cutoff), the middle panel shows the only three-residue Ile-methyl cluster, and the bottom two panels show two of the five 2-residue Ile-methyl clusters. Ile side chains are shown as red lines, their Cδ1 methyls as red spheres and the backbone is a gray ribbon.
The crystal structure of 0P-ERK2 was analyzed using an 8 Å cutoff to identify potential Ile-NOE clusters. This cutoff was empirically derived and is approximately the longest distance observed for methyl–methyl NOEs in the 350 ms mixing time 3D NOESY spectrum of ERK2. The largest Ile-methyl-cluster predicted in 0P-ERK2 involves Ile residues I54, I70, I84, I87, I101, I345 in the N-terminal lobe (Figure 3c), which was uniquely mapped to the six-residue Ile-NOE cluster observed in the NOESY spectra (Figure 3a,b). The second largest Ile cluster in the X-ray structure involves Ile residues I81, I138, I163, which could be uniquely mapped to the single three-residue Ile-NOE cluster. 0P-ERK2 has five pairs of Ile methyls separated by less than 8 Å consisting of I51–I88, I131–I215, I196–I207, I225–I241, and I209–I300. These five Ile-pairs match the five two-residue Ile-NOE clusters observed in the NOESY spectra (Figure 3a,b). Thus, 19 of the 28 Ile residues were found in the 7 Ile-NOE clusters observed in the NOESY spectra (Figure 3b), whereas the other 9 Ile methyls were too distant from other Iles to be involved in an Ile-NOE cluster.
The five two-residue Ile-clusters in 0P-ERK2 could not be uniquely mapped using only Ile-Ile NOEs. This led to the next level of analysis that utilized Ile to Val/Leu methyl–methyl NOEs (Figure 1b). Because of the 50% 13CH3-labeling of Val/Leu methyls, a slightly shorter cutoff of 7.1 Å was used to predict Ile to Leu or Val NOEs. Using the hierarchical approach (Figure 1), the Ile-Val NOEs were analyzed first, since there are many fewer Val than Leu residues in ERK2. Only one Ile-pair had predicted and observed NOEs to four Val residues and could be uniquely mapped to I51–I81 (Figure S2). Three Ile-pairs had predicted and observed NOEs to one Val residue; thus, analysis of Ile-Leu NOEs was performed next to map these Ile-pairs onto the structure. These three Ile-pairs showed Ile-Leu NOEs to five, five, or one Leu residues, which allowed the last one to be uniquely mapped onto the structure (Figure S3). The other two Ile-pairs were distinguished based on their patterns of Ile-Val, Ile-Leu, and Val-Leu NOEs (Supporting Information). The last Ile-pair had only one predicted and observed Ile-Leu NOE and no predicted or observed Ile-Val NOEs, which enabled unique mapping of this pair to I196–I207.
The seven observed Ile-NOE clusters were unambiguously mapped onto the structure as described above, but in practice additional information was used to confirm this mapping. For example, as seen in Figure S4, the single three-residue Ile-cluster in 0P-ERK2 (I138-163-181) can be linked to the I131–I215 cluster because both show NOEs to two connecting Leu residues (L153 and L161). This additional level of analysis lends confidence to the mapping and subsequent resonance assignments of residues in a cluster.
The sizes of the observed and predicted methyl–methyl NOEs were next used to make sequence-specific resonance assignments in 0P-ERK2 (Figure 1c). We previously described how comparison of the observed and predicted methyl–methyl NOE led to sequence-specific assignment of residues in the six-residue Ile cluster.24 To make assignments of the three-residue Ile cluster, I163 in the three-residue Ile cluster was assigned to the resonance that showed the most intense NOEs to the Leu residues L153 and L161 (see Figure S4). I138 was assigned to the methyl that showed NOEs to multiple other Leu residues, including L161, L148, and L135. The last methyl in the three-residue Ile cluster, which has the fewest NOEs to Leu residues, was assigned to I81. This general approach was then used to extend methyl resonance assignment to the rest of protein as discussed in Supporting Information.
Single Site ILV Mutants Were Used to Confirm Resonance Assignments in 0P-ERK2
A set of 12 Ile, Leu, or Val to Ala mutants of 0P-ERK2 was used to help confirm the methyl assignments obtained from the NOE data (Figure 4). In optimal cases, where there is little effect on the chemical shifts of other methyl resonances, a mutated I, L, or V residue can be directly assigned from the loss of one (Ile) or two (Leu/Val) peak(s) in the 2D HMQC spectrum of the mutant when compared with the wild-type protein.9 There was only one such case in 0P-ERK2 (I124A, Figure 4b) where unambiguous assignment could be confidently made solely from comparison of mutant and WT spectra. In most cases, the chemical shifts of other methyls were also perturbed by the mutation (Figure S5), and these spectra then represented additional data that complement the NOE-derived distance constraints. For example, the overlay of the Ile region of the HMQC spectra of L161A and WT ERK2 (Figure 4c) showed significant chemical shift perturbations for the methyl resonances that had been assigned to I163, I131, and I215 based on NOE analysis. These perturbations are consistent with the X-ray structure (Figure 4d) where these three Ile methyls are in proximity to the L161 methyls. Thus, although mutants that only show loss of ILV methyl resonance(s) with no perturbation of other methyls in their HMQC spectra are easy to interpret and directly lead to assignments, as illustrated by Boisbouvier and co-workers,9 mutants that show perturbations of other methyl resonances provide valuable information for structure-based assignment that complement the NOE data. The combined analysis of the HMQC spectra, NOE data, X-ray structure, and mutagenesis led to confident resonance assignment for 60% of the ILV methyl resonances in 0P-ERK2 (Table S1), including 89% of Ile, 49% of Leu, and 68% of Val methyls.
Figure 4.
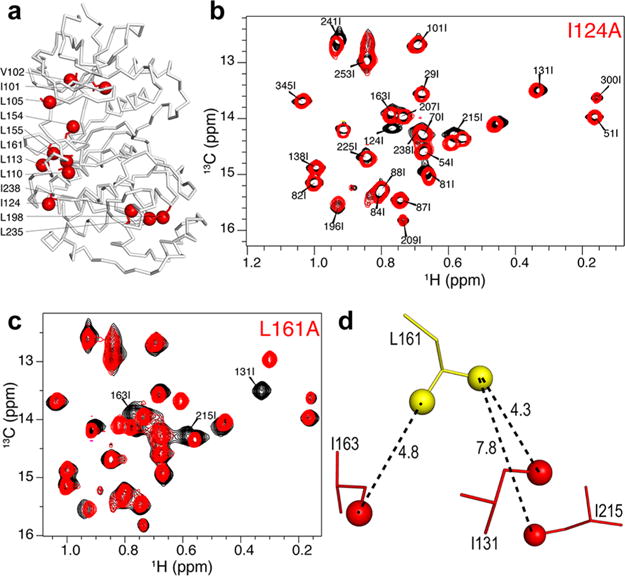
Ile, Val, or Leu to Ala mutations used to confirm methyl assignments. (a) Structure of ERK2 showing the sites of Ala mutations. The backbone is represented as a gray ribbon and side chains of mutation sites are shown in red with their methyls as spheres. (b) Overlay of the Ile region of the 2D (13C, 1H) HMQC spectra of mutant I124A (red) and wild-type 0P-ERK2 (black). The missing peak was unambiguously assigned to I124. (c) Overlay of the Ile region of the HMQC spectra of mutant L161A (red) and wild-type 0P-ERK2 (black). (d) The L161 region of the X-ray structure of 0P-ERK2 where the distances from the L161 methyl groups to nearby Ile methyls are shown.
Resonance Assignments from 0P-ERK2 Were Transferred to 2P-ERK2
ILV methyl resonance assignments for 2P-ERK2 were obtained by transferring the assignments from 0P-ERK2 and were confirmed with NOE data from 3D NOESY spectra on 2P-ERK2. In 2P-ERK2, 137 out of 144 methyl resonances were observed, and 80 of these were assigned (Table S1). Some resolved and assigned peaks in 0P-ERK2 were not observed in the HMQC spectrum of 2P-ERK2 possibly due to intermediate exchange between multiple conformations in the activated ERK2.24 For example, a well-resolved Ile peak that was assigned as I196 was not observed in 2P-ERK2.
Peptide Binding to 0P- and 2P-ERK2
ERK2 function requires binding of various ligands, including ATP, substrates, and other protein regulators (kinases, phosphatases, and scaffolds). The extensive set of methyl assignments obtained here was used to probe the effects of ligand binding throughout the structure of ERK2. For example, 2D (13C, 1H) HMQC spectra were used to study chemical shift changes and to determine the Kd for binding of a peptide, Elk1D, to 0P-ERK2 or 2P-ERK2 as illustrated in Figure 5a. The Elk1D peptide is derived from the transcription factor substrate, Elk1, and binds to a “Docking site for ERK and JNK, LXL” (DEJL) motif binding site in ERK2.39 The chemical shift changes for many methyl resonances upon titration with peptide showed that peptide binding to ERK2 is in fast exchange on the NMR chemical shift time scale, meaning that the observed chemical shift is a population weighted average of the chemical shifts of the free and bound states. Chemical shift perturbations of the 13C and 1H resonances (CSPC,H) for ILV methyls were then globally fit to a binding isotherm, yielding a single Kd for binding as well as the magnitude of the chemical shift differences between the free and bound states of ERK2 (Figure 5b, Tables 1 and S2). The Kd values obtained for Elk1D binding to 0P- and 2P-ERK2 were 10 ± 1 and 30 ± 3 μM, respectively. Thus, active ERK2 shows slightly weaker binding for this peptide than inactive ERK2. Significant chemical shift perturbations (CSPC,H > 0.03 ppm) were observed for nine methyl resonances (both methyls of L110, both methyls of L113, a single methyl of L119, both methyls of L155, a single methyl of L306, and a single methyl of L311) in both 0P- and 2P-ERK2. These residues are close to the DEJL binding interface, which includes the sheet β7, the helices αD and αE and extends to the CD site (see Figure 5c). Smaller chemical shift perturbations (0.01 to 0.03 ppm) were observed for residues more distant from the binding interface, such as I82 and I124. These residues showed similar magnitudes and directions of chemical shift perturbation in both 0P- and 2P-ERK2, indicating similar conformational changes between inactive and active ERK2 upon Elk1D binding. The locations of these residues are consistent with X-ray structures of 0P-ERK2 in complex with another DEJL peptide and with a previous NMR study showing changes in chemical shifts of backbone amides upon Elk1D binding.23,40
Figure 5.
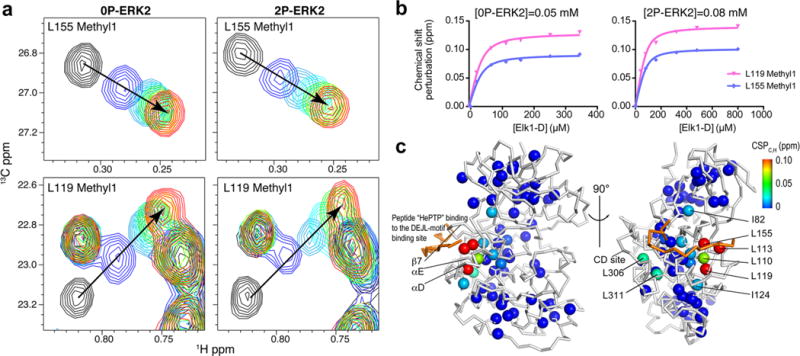
Binding of the peptide Elk1D to inactive and active ERK2. (a) Titration of Elk1D into 0P- or 2P-ERK2 as monitored by chemical shift changes of methyl resonances for L155 and L119 in the 2D HMQC spectra. The arrows show the change in the position of the methyl resonance upon titration with Elk1D, where the free ERK2 is in black, and the saturated peak ([0P-ERK2]:[Elk1D] = 1:7, [2P-ERK2]:[Elk1D] = 1:10) is in red. The CSPC,H values for these methyl resonances are similar in 0P and 2P-ERK2 (Table S2). (b) The CSPC,H values for L155 and L119 are plotted against the concentration of Elk1D, where the solid lines are the global fits to a single-site binding curve. (c) The CSPC,H values for 2P-ERK2 derived from the binding curves are mapped onto the X-ray structure of 0P-ERK2 in complex with a DEJL-motif peptide (colored in gold) derived from hematopoietic tyrosine phosphatase (HePTP, PDB 2GPH). The color scale for the CSPC,H values is on the right, with blue indicating no measurable perturbation and red indicating the largest perturbation.
Table 1.
Binding and Kinetic Data for Ligand Interactions with 0P- and 2P-ERK2
| Elk1D
|
AMP-PNP
|
|||||
|---|---|---|---|---|---|---|
| Kd (μM) | kon (μM−1 s−1) | koff (s−1) | Kd (μM) | kon (μM−1 s−1) | koff (s−1) | |
| 0P-ERK2 | 10 ± 1 | >3a (30b) | >30a (300b) | 200−500 | <0.08c | <80c |
| 2P-ERK2 | 30 ± 3 | >1a | >30a | 200–500 | <0.08c | <80c |
Values were obtained using the relationship kex = kon[Elk1D]free + koff > 60 Hz, and Kd = koff/kon, with [Elk1D]free of 5 μM and 14 μM for 0P- and 2P-ERK2, respectively.
The kon and koff values were obtained from fits of the line shapes of the L113 methyl peak for titration of Elk1D into 0P-ERK2, where the spectra were simulated using LineShapeKin73 with |Δω| of 200 Hz (see Figure S6).
Values were obtained using the relationship kex = kon[AMP-PNP]free + koff < 80 Hz, using [AMP-PNP]free of 1 mM for both 0P- and 2P-ERK2.
Nucleotide Binding to 0P- and 2P-ERK2
Binding of ATP, or ATP-site inhibitors, can induce long-range perturbations in protein kinases, for example, as seen with the reorientation of the N-terminal and C-terminal lobes in protein kinase A or the transition from a compact to a more extended form in c-Abl.41–43 The effects of nucleotide binding to inactive and active ERK2 were studied here by monitoring the ILV methyl region of the HMQC spectra of ERK2 as a function of the concentration of the ATP analogue AMP-PNP. In contrast to the fast exchange observed with Elk1D peptide binding, multiple methyl resonances in 0P- and 2P-ERK2 showed slow or intermediate exchange between free and bound states upon addition of nucleotide, depending on their chemical shift differences between these states. As seen in Figure 6a, the volume for one of the methyl resonances for L26 decreased with no change in chemical shift upon addition of AMP-PNP to either 0P- or 2P-ERK2, and a new resonance appeared at higher AMP-PNP concentrations. In 2P-ERK2, the magnitude of the chemical shift difference (|Δω| in Hz) of L26 methyl between free and bound forms is ∼80 Hz and is primarily in the 1H dimension. The slow exchange means that kex is less than 80 Hz, where kex = kon[AMP-PNP]free + koff. Methyl resonances that showed smaller |Δω| broadened and shifted upon addition of AMP-PNP, consistent with intermediate to fast exchange between the free and bound forms of 0P/2P-ERK2 (data not shown). It was not possible to accurately determine the Kd values for AMP-PNP binding to ERK2, because slow or intermediate exchange lowers the signal-to-noise of the methyl peaks, preventing accurate measurement of the peak volumes and therefore populations. Furthermore, the standard equations for extracting kinetic data from 1D line shapes do not apply in 2D spectra unless there is no 1H or 13C chemical shift difference for the two states. Given these limitations, it was still possible to estimate Kd values ranging between 200 and 500 μM for AMP-PNP binding to 0P- or 2P-ERK2 (Table 1).
Figure 6.

Binding of AMP-PNP to inactive and active ERK2. (a) A portion of the Leu/Val region of the 2D HMQC spectra of 0P- and 2P-ERK2 upon titration with AMP-PNP. These spectra show that one of the methyl resonances of L26 is in slow exchange on the NMR chemical shift time scale between free and bound forms for both 0P-and 2P-ERK2. The arrows point to the peak in the free form of ERK2, and the dashed lines outline the position of the free peak. (b) The CSPC,H for methyls between the free and AMP-PNP-bound form is mapped onto the X-ray structure of 0P-ERK2 bound to ATP (PDB 4GT3). The color scale for the CSPC,H values is on the right, with blue indicating no measurable perturbation, red indicating the largest perturbations, and black indicating that these peaks were not observed in the spectra with saturated AMP-PNP, possibly due to chemical exchange broadening in the bound state. The ligand ATP is highlighted with orange sticks. The side chains of the eight catalytic spine residues were shown in magenta sticks. Six out of the eight these residues were I/L/V, with their methyls highlighted with magenta circles.
The chemical shift perturbations for assigned methyls upon binding of AMP-PNP to 0P- and 2P-ERK2 were mapped onto the X-ray structure of the 0P-ERK2:AMP-PNP complex as illustrated in Figure 6b. The binding of AMP-PNP induced perturbations throughout the N-terminal lobe and upper C-terminal lobe for both 0P- and 2P-ERK2. The methyls in proximity to the ATP binding site either showed the largest chemical shift perturbations (e.g., I29, L105, and L155), or were not observed (e.g., V37 and L154) even upon saturation with AMP-PNP. The latter methyls were likely not observed due to exchange broadening between multiple conformations in the bound state. Overall, the methyls that were perturbed upon AMP-PNP binding to 0P- and 2P-ERK2 are quite similar, with small differences in the magnitudes of perturbations for individual methyls.
DISCUSSION
Understanding the detailed mechanism of action of proteins usually requires a combination of both structural and biochemical information. In many cases, analysis of the biochemical data from only static X-ray structures yields incomplete insight into the mechanism, because static structures may not report on conformational dynamics required for protein activity, especially for enzymes. Thus, there are a growing number of examples where X-ray structures are complemented with experimental or theoretical techniques that probe protein motions, such as NMR relaxation experiments or molecular dynamic simulations.44–46 For studies of dynamics by NMR, the bottleneck is often resonance assignment, especially as the size of the protein increases. Here we report a structure-based strategy that yielded assignment of ∼60% of the ILV methyl resonances in 0P-and 2P-ERK2. Two perdeuterated and selectively ILV 13C1H3-methyl labeled samples were used for 0P-ERK2, one for determining methyl residue type using through-bond correlation experiments and the other for collecting methyl–methyl NOE data. The approach here employs a hierarchical analysis of the predicted and observed methyl “NOE-clusters”, where NOEs involving Ile methyls are analyzed first followed by Ile-Val, Ile-Leu, etc. (see Figure 1).
Methyl Assignments of ERK2 through a “Hierarchical Search of Uniqueness”
The first step in the structure-based ILV-methyl assignment procedure is identification of methyl type. A 2D (13C, 1H) TROSY-HMQC spectrum was used to determine the number of resolved methyl resonances and also to distinguish Ile Cδ1 methyls from Leu/Val methyls based on the distinctive 13C chemical shifts of the Ile Cδ1 methyl resonances. Larger proteins often show fewer methyl peaks than expected, due to resonance overlap. Overlapping peaks can often be identified by collecting spectra at different temperatures or by analysis of the NOE patterns, both of which were used here for ERK2. The Leu and Val methyl resonances were next distinguished using through-bond information such as HMCMCBCA or HMCM[CG]CBCA experiments,6 which correlate the Leu or Val methyl resonances with their other side chain carbon resonances (Figure 2). The identification of residue type is a key component of the NOE-cluster-based assignment process. In 0P-ERK2, all of the Ile Cδ1 methyl resonances and 89% and 70% of the Val and Leu methyl resonances, respectively, were identified by residue type, with low signal-to-noise usually being the limiting factor for identification. If a higher percentage of residue-type identification for the ILV methyls is required, methyl correlation experiments can be employed that direct magnetization to a single Cγ, Cβ, or Cα resonance, leading to higher single-to-noise.47 Alternatively, Ile-, Val-, or Leu-only methyl-labeled samples can be prepared, which each yield unambiguous residue-type identification.16,35,48–50 However, these labeling methods do not allow direct linking of the two Val (or Leu) methyl groups to the same residue. For 0P-ERK2, ∼53% of methyl groups (86% of V, 43% of L) were unambiguously linked from analysis of the HMCMCBCA experiment and identifying the two methyls that belong to the same residue facilitates the structure-based assignment process. If higher-resolution structural information is desired, stereospecific assignments for the methyl groups of Leu or Val can be obtained using procedures that employ chirally labeled precursors,16,51 amino acids,49,52 or partial 13C enrichment.53 Methods for efficient 13C1H3 labeling of Ala, Met, and/or Thr methyls have also been developed, which yield additional NOE data and more NMR probes.35,36,54–56
Structure-based assignment procedures have a long history in protein NMR. One of the earliest examples was the main-chain-directed assignment procedure developed by Englander & Wand in 1987 where patterns of 1H–1H NOEs in 2D NOESY spectra were compared with distances predicted for secondary structure motifs derived from a set of X-ray structures.10 The two protons in the NOEs were also identified by atom type: HN, Hα, or Hβ. The structure-based methods were largely replaced by triple-resonance heteronuclear through-bond correlation experiments with the advent of efficient procedures for production of 13C/15N-labeled proteins. These through-bond experiments eliminate the ambiguities inherent in through-space NOE connectivities. Thus, triple-resonance backbone assignment experiments on 13C/15N-labeled proteins are generally the method of choice for resonance assignment of small-to-medium sized proteins. However, fast relaxation in larger proteins leading to poor magnetization transfer and therefore low signal-to-noise limits the application of the triple resonance backbone assignment experiments. Thus, structure-based assignment methods are being more commonly used for studies of larger proteins with known structures or for studies on homologous or mutant proteins.
The current structure-based methods for assignment of methyl groups are conceptually similar to the original main-chain-directed procedure; however, there have been tremendous experimental, algorithmic, and computational improvements, which allow larger and more complex systems to be studied. NOE distance constraints still represent the primary type of experimental data for structure-based assignments, because a complete set of NOE-derived methyl–methyl distances can be obtained using a single perdeuterated, 13C1H3-labeled sample. The high level of deuteration in this sample helps reduce 1H–1H spin-diffusion, which further simplifies the analysis of the NOE data in larger proteins.57 The NOE data are most valuable when there is a high density of methyl groups, such as on the interior of protein but are less useful for surface residues where fewer methyl–methyl NOEs are observed. For example, 70% of ILV methyls on the hydrophobic interior of ERK2 were assigned (accessible surface area (ASA) < 1 Å2), whereas only 50% of the partially exposed methyls (ASA > 9 Å2) and 20% of the highly exposed methyls (ASA > 30 Å2) were assigned. One of the disadvantages of using NOE data is that there is generally no reference point from which to begin making unambiguous assignments. The hierarchical approach employed here helps to overcome this issue by mapping uniquely sized methyl–methyl NOE clusters onto the X-ray structure.
In addition to NOEs, other structural information such as PREs,18 pseudocontact shifts,58 stereospecific assignments for chiral centers,17,18 residual dipolar couplings,59 and chemical shifts13 have been used in structure-based methyl assignment methods. The PRE distance data are a natural complement to the methyl–methyl NOEs, where the paramagnetic label is usually placed on a surface residue where the bulky nitroxide or metal is less likely to perturb the structure. In addition, the spin-label then represents a known reference point in the structure, allowing assignment of isolated methyls (especially surface exposed methyls) where no methyl–methyl NOE is observed. The PRE data can therefore provide a unique starting point for resonance assignment; this is extremely helpful in reducing the combinatorial problem inherent in structure-based methyl assignments, as discussed below.
One of the major challenges for structure-based assignment of methyls is that for proteins with large numbers of methyls (>100) the problem becomes computationally intractable, and therefore it is not possible to exhaustively search all possible combinations of methyl resonance assignments. Thus, various mathematical methods have been applied to help overcome this problem, including graph theory, fuzzy math/logic, nuclear vector representation, clustering algorithms, and probabilistic techniques.12,13,15,17,18,59–62 A number of programs have been developed for automated structure-based assignment of methyl resonances, including MAP-XS (II),13,17 FLAMEnGO(2.0),15,18 and a PRE-based program.63 All these programs first employ residue-type identification to reduce the complexity of the search and then employ NOE and/or PRE constraints as their primary experimental data. To identify residue types, MAP-XS and FLAMEnGO employ through-bond techniques similar to the approaches used here. The PRE-based program63 did not employ through-bond assignment methods for distinguishing methyl-type; instead three samples were prepared where only the methyls on Ile, Ala, or Met residues were 13C1H3-labeled.
Once methyls have been identified by residue type, the next step is comparison of predicted distances with the experimental short-range (NOE) or long-range (PRE) distance information. The highest agreement between distance constraints and the structure is assumed to be the best assignment, or in some programs this is a set of possible assignments. However, even assuming complete residue-type identification, a complete search is computationally impossible (e.g., ERK2 has at least Nres(I)! × Nres(L)! × Nres(V)! = 28! × 44! × 14! = 1095 possible assignments even if methyls were only assigned to individual residues). Therefore, various approaches are used to reduce the size of the search. The most common way is to introduce known assignments, which not only reduces the size of the search but also provides reference points for performing fragment searches where only a subset of the structure is searched. The NOEnet program60 utilizes a complementary strategy that reduces the complexity of the search by ruling out impossible assignments (instead of the more common approach of introducing unambiguous assignments). This approach yields an ensemble of assignments that are consistent with the experimental data and structure. The search process in NOEnet is further simplified by a fragmentation approach involving analysis of the largest networks first, similar to the hierarchical clustering approach employed in this study. As discussed above, the hierarchical analysis here eliminates the brute force search of all possible assignments by instead mapping the largest (e.g., I–I) cluster onto the structure, which can then be used as a unique starting point to extend assignments.
We attempted to make assignments of ERK2 using both MAP-XSII and FLAMEnGO, but not the PRE-based program (because we did not collect any PRE data) or NOEnet (because it is not yet set up for methyl groups and therefore has issues with stereospecific assignments of the Val/Leu methyl–methyl NOEs). Our input to the former programs included a chemical shift list of methyl resonances of ERK2 from HMQC spectra with the identified residue types, a chemical shift list predicted from the program CH3shift,14 a protonated structure of ERK2 (PDB 1ERK) and a list of (13C, 13C, 1H) NOEs. Twenty trials were performed on each of these programs using a distance cutoff of 8.0 Å. The five trials with best scores had a low percentage (<20%) of confident assignments as well as a low-level of convergence for the methyls assignment (Table S3). The low-level of convergence in these programs could arise from multiple reasons including an inadequate number or distribution of observed NOEs; inability to adequately sample the huge combinatorial space of all possible methyl assignments for a protein with the size of ERK2 (on the order of 1095 combinations); or incomplete residue-type identification leading to a very large sample space in the search for methyl assignments. Thus, we did not pursue further structure-based assignment with these automated programs.
Using Methyl Groups to Probe Ligand Binding to ERK2
Once methyl groups have been assigned in a protein they provide multiple valuable probes of structure, function, and mechanism of action. The DEJL-motif binding site is one of the major docking sites that ERK2 uses to bind its activating kinase, substrates and scaffold proteins.27,45 The large set of methyl assignments obtained in this study were used to measure the binding affinity of the DEJL-motif peptide Elk1D to 0P- and 2P-ERK2 and also to set a lower limit on rate constants for binding. There was a 3-fold difference in the KD for Elk1D binding to inactive versus active ERK2 (Table 1). The KD for Elk1D binding to 0P-ERK2 (10 μM) is similar to the previously measured KD of 5 μM for the full-length Elk1 protein and a 0P-ERK2 mutant that was binding competent only at the DEJL-site.64 The DEJL-docking interaction has been previously studied,23,31 but there are currently no kinetic data for binding to this site. The NMR titration of Elk1D into 0P or 2P-ERK2 showed some peaks in fast exchange (Figure 5), which provides limits on the association and dissociation rate constants of the binding. For a chemical shift difference between free and bound forms, |Δω|, of 60 Hz and a [Elk1D]total of 23 μM in the titration of 0P-ERK2 (Figure 5a), the exchange rate constant for the binding, kex (where kex = kon[Elk1D]free+ koff) is larger than 60 Hz, yielding kon > 3 μM−1 s−1 or koff > 30 s−1 (Table 1). However, most methyls showed chemical shift changes in both dimensions, increasing the complexity of kinetic analysis. One methyl resonance of L113 (Figure S6a) showed exchange broadening at [Elk1D]total = 23 μM in the titration of 0P-ERK2, indicating fast-intermediate exchange. This resonance in 0P-ERK2 has a |Δω(13C)| of 200 Hz and very small |Δω(1H)| (Figure S6a), making it possible to simulate the observed exchange broadening with kon of 30 μM−1 s−1 and koff of 300 s−1 (Figure S6). All the methyls that showed significant chemical shift changes upon binding of the peptide Elk1D to both active and inactive ERK2 were in proximity to the known DEJL-motif binding site,39 indicating no perturbation on the rest of the molecule (Figure 5c and Table S2). This is consistent with the observed local perturbations in the solution study of the peptide/protein HePTP binding to the DEJL-motif in p38α.65
The Elk1 protein can bind to both the DEJL- and DEF-docking sites in 2P-ERK2,66 whereas it only binds to the DEJL-site in 0P-ERK2, because the other site is sterically blocked by the activation loop.31 One question is whether Elk1 shows a preference for binding to one of these sites. Previous studies of an Elk1F peptide that binds to the DEF-site in 2P-ERK2 yielded Kd = 8 μM, kon = 56 μM−1 s−1, and koff = 450 s−1.67 These results are comparable to those obtained here for the DEJL-site binding peptide Elk1D (Table 1). This suggests that these two regions on Elk1 bind to different docking sites in 2P-ERK2 with no kinetic or thermodynamic preference.
Our measurements of AMP-PNP binding also provided insight into the enzymology of ERK2. Multiple methyl resonances in 0P- or 2P-ERK2 were in slow exchange on the chemical shift time scale in the NMR titration with AMP-PNP (Figure 6). As noted above, this made it difficult to obtain precise KD values for AMP-PNP binding, but they were in the range of 200–500 μM for both 0P- and 2P-ERK2 (Table 1), which is consistent with values previously determined by isothermal titration calorimetry.68,69 The similarity in KD between 0P- and 2P-ERK2 is quite different from the situation for MAP kinase p38α, which showed >30 fold increase in the binding affinity of ATP upon phosphorylation (>15 mM for 0P-p38α and 430 μM for 2P-p38α).70 The observed slow exchange for the methyl resonance of L26 during the titration of AMP-PNP into 2P-ERK2, which has a |Δω(1H)| ≈ 80 Hz, yielded upper limits of kon < 0.08 μM−1 s−1 and koff < 80 s−1 (see Figure 6a, Table 1). These limits are consistent with a previous study that measured kon,ATP = 0.015 μM−1 s−1 and koff, ATP = 0.5 s−1 for formation of the ternary MBP-bound complex of Tyr-185 phosphorylated (pY) ERK2.71
The methyls of L26 show the expected behavior for resonances in slow exchange during NMR titration of AMP-PNP (Figure 6a). However, some other methyls that showed chemical shift perturbations in the titration with AMP-PNP for either 0P- or 2P-ERK2 were not observed in the HMQC spectrum upon saturation of the ligand. For example, titration with AMP-PNP reduces the intensities of the methyl resonances of V37 for the free form of ERK2 in the HMQC spectra, but the resonances of the bound form are not observed (Figure S7). This indicates that these methyl resonances are undergoing intermediate exchange between conformers in the AMP-PNP-bound form.
Finally, our results provide information about the structural perturbations on ERK2 induced by binding different ligands. In contrast to the primarily local perturbations induced by Elk1D, the binding of AMP-PNP to both 0P- and 2P-ERK2 showed chemical shift perturbations for methyls throughout the N-terminal and the upper C-terminal lobes (Figure 6b). Similarly, 2P-p38α also showed methyl chemical shift perturbations distant from the ATP binding site upon the binding of an ATP analogue.70 These results suggest that nucleotide binding to kinases causes long-range conformational perturbations in both the N- and C-terminal lobes. This may arise from the assembly of the so-called “catalytic spine”, which is a spatially conserved hydrophobic motif identified from crystal structures of active kinases that is formed by residues in both the N- and C-terminal lobes, and is completed by the adenine ring of ATP.72 All of the ILV residues of the proposed catalytic spine showed clear methyl chemical shift perturbations upon AMP-PNP binding (Figure 6b), which may result from the transition to the assembled form of the catalytic spine. Such long-range conformational perturbations upon binding ATP may arise from a common mechanism that kinases use to achieve a catalytically productive conformation.
CONCLUSION
This study describes a hierarchical NOE-clustering approach that simplifies the structure-based methyl assignments of proteins. The approach starts with residue-type identification of the ILV methyl groups. It then compares observed methyl–methyl NOEs with those predicted from the X-ray structure in a novel, hierarchical manner, where the largest NOE-methyl cluster(s) of specific residue type are identified first. There are generally few large NOE-methyl clusters in a protein, so these can often be uniquely mapped onto the structure, as illustrated here for the unique six-residue and three-residue Ile-NOE clusters in ERK2. The structure-based approach yielded 60% of Ile, Leu, and Val methyl assignments in ERK2. This extensive set of methyl probes was then used to quantify binding affinity and kinetics of an Elk1D peptide and an ATP analogue to both inactive and active ERK2, where the peptide showed primarily local effects in the protein, whereas nucleotide binding induced long-range effects. Although the approach here was applied to assignments of Ile, Leu, and Val methyls, it is applicable to proteins with selective methyl labeling of other residues. The method relies on observation of methyl–methyl NOEs; thus it is most useful for assignment of methyls on the interior of the protein, since there are generally fewer methyl–methyl NOEs on the protein surface. PRE63 and/or mutagenesis9 of surface methyls could be used to complement the NOE data to obtain higher percentage of assignments. The hierarchical cluster-type analysis employed here is amenable to automation and could be incorporated into existing structure-based assignment programs.
Supplementary Material
Acknowledgments
We thank Akiko Tanimoto and Dr. Thomas Lee for help with preparation of the NMR samples, Dr. Geoff Armstrong for help with the NMR experiments, Drs. Rebecca Page and Wolfgang Peti, Brown University, for their generous gift of the ERK2 expression plasmid, and Dr. Lewis Kay, University of Toronto, for insightful discussions and providing NMR pulse sequences.
Funding
This work was supported by NIH R01 GM074134 (NGA) and NRSA T32 institutional training grants GM008759 (L.R.W.) and GM065103 (M.P.L.). NMR instrumentation was purchased with partial support from NIH grants GM068928, RR11969, and RR16649, National Science Foundation Grants 9602941 and 0230966 and the W. M. Keck Foundation.
ABBREVIATIONS
- AMP-PNP
adenosine 5′-(β,γ-imido)triphosphate
- BMRB
Biological Magnetic Resonance Bank
- CSP
chemical shift perturbation
- DEJL
docking site for ERK and JNK, LXL
- ERK2
extracellular signal-regulated kinase 2
- HMQC
heteronuclear multiple quantum coherence
- MAP
mitogen-activated protein
- NMR
nuclear magnetic resonance
- NOE
nuclear Overhauser effect
- NOESY
nuclear Overhauser effect spectroscopy
- PRE
paramagnetic relaxation enhancement
- TROSY
transverse relaxation-optimization spectroscopy
Footnotes
Supporting Information
Examples of Ile-NOE cluster mapping (SI text, Figures S2, S3, S9, S11), examples of methyl assignments within a cluster (SI text, Figures S4, S8, S10), Ile, Leu, and Val methyl assignments of 0P/2P-ERK2 (Figure S1, Table S1), examples of mutants spectra (Figure S5), data of representative methyls in ligand binding (Figures S6, S7), summary of NOE connectivities (Figure S12), chemical shift perturbations of ligand binding (Tables S2, S4), and summary of the results of the automated assignment programs (Table S3). The Supporting Information is available free of charge on the ACS Publications website at DOI: 10.1021/acs.biochem.5b00506.
Notes
The authors declare no competing financial interest.
References
- 1.Ruschak AM, Kay LE. Methyl groups as probes of supra-molecular structure, dynamics and function. J Biomol NMR. 2010;46:75–87. doi: 10.1007/s10858-009-9376-1. [DOI] [PubMed] [Google Scholar]
- 2.Ollerenshaw JE, Tugarinov V, Kay LE. Methyl TROSY: explanation and experimental verification. Magn Reson Chem. 2003;41:843–852. [Google Scholar]
- 3.Plevin MJ, Boisbouvier J. Isotope-Labelling of Methyl Groups for NMR Studies of Large Proteins. In: Clore M, Potts J, editors. Recent Developments in Biomolecular NMR. Royal Society of Chemistry; London: 2012. pp. 1–24. [Google Scholar]
- 4.Tzeng SR, Kalodimos CG. Protein dynamics and allostery: an NMR view. Curr Opin Struct Biol. 2011;21:62–67. doi: 10.1016/j.sbi.2010.10.007. [DOI] [PubMed] [Google Scholar]
- 5.Rosenzweig R, Kay LE. Bringing dynamic molecular machines into focus by methyl-TROSY NMR. Annu Rev Biochem. 2014;83:291–315. doi: 10.1146/annurev-biochem-060713-035829. [DOI] [PubMed] [Google Scholar]
- 6.Tugarinov V, Kay LE. Ile, Leu, and Val methyl assignments of the 723-residue malate synthase G using a new labeling strategy and novel NMR methods. J Am Chem Soc. 2003;125:13868–13878. doi: 10.1021/ja030345s. [DOI] [PubMed] [Google Scholar]
- 7.Sprangers R, Kay LE. Quantitative dynamics and binding studies of the 20S proteasome by NMR. Nature. 2007;445:618–622. doi: 10.1038/nature05512. [DOI] [PubMed] [Google Scholar]
- 8.Ruschak AM, Kay LE. Proteasome allostery as a population shift between interchanging conformers. Proc Natl Acad Sci U S A. 2012;109:E3454–3462. doi: 10.1073/pnas.1213640109. [DOI] [PMC free article] [PubMed] [Google Scholar]
- 9.Amero C, Asuncion Dura M, Noirclerc-Savoye M, Perollier A, Gallet B, Plevin MJ, Vernet T, Franzetti B, Boisbouvier J. A systematic mutagenesis-driven strategy for site-resolved NMR studies of supramolecular assemblies. J Biomol NMR. 2011;50:229–236. doi: 10.1007/s10858-011-9513-5. [DOI] [PubMed] [Google Scholar]
- 10.Englander SW, Wand AJ. Main-chain-directed strategy for the assignment of 1H NMR spectra of proteins. Biochemistry. 1987;26:5953–5958. doi: 10.1021/bi00393a001. [DOI] [PubMed] [Google Scholar]
- 11.Bartels C, Billeter M, Güntert P, Wüthrich K. Automated sequence-specific NMR assignment of homologous proteins using the program GARANT. J Biomol NMR. 1996;7:207–213. doi: 10.1007/BF00202037. [DOI] [PubMed] [Google Scholar]
- 12.Apaydin MS, Conitzer V, Donald BR. Structure-based protein NMR assignments using native structural ensembles. J Biomol NMR. 2008;40:263–276. doi: 10.1007/s10858-008-9230-x. [DOI] [PubMed] [Google Scholar]
- 13.Xu Y, Liu M, Simpson PJ, Isaacson R, Cota E, Marchant J, Yang D, Zhang X, Freemont P, Matthews S. Automated assignment in selectively methyl-labeled proteins. J Am Chem Soc. 2009;131:9480–9481. doi: 10.1021/ja9020233. [DOI] [PMC free article] [PubMed] [Google Scholar]
- 14.Sahakyan AB, Vranken WF, Cavalli A, Vendruscolo M. Structure-based prediction of methyl chemical shifts in proteins. J Biomol NMR. 2011;50:331–346. doi: 10.1007/s10858-011-9524-2. [DOI] [PubMed] [Google Scholar]
- 15.Chao FA, Shi L, Masterson LR, Veglia G. FLAMEnGO: a fuzzy logic approach for methyl group assignment using NOESY and paramagnetic relaxation enhancement data. J Magn Reson. 2012;214:103–110. doi: 10.1016/j.jmr.2011.10.008. [DOI] [PMC free article] [PubMed] [Google Scholar]
- 16.Mas G, Crublet E, Hamelin O, Gans P, Boisbouvier J. Specific labeling and assignment strategies of valine methyl groups for NMR studies of high molecular weight proteins. J Biomol NMR. 2013;57:251–262. doi: 10.1007/s10858-013-9785-z. [DOI] [PubMed] [Google Scholar]
- 17.Xu Y, Matthews S. MAP-XSII: an improved program for the automatic assignment of methyl resonances in large proteins. J Biomol NMR. 2013;55:179–187. doi: 10.1007/s10858-012-9700-z. [DOI] [PubMed] [Google Scholar]
- 18.Chao FA, Kim J, Xia Y, Milligan M, Rowe N, Veglia G. FLAMEnGO 2.0: an enhanced fuzzy logic algorithm for structure-based assignment of methyl group resonances. J Magn Reson. 2014;245:17–23. doi: 10.1016/j.jmr.2014.04.012. [DOI] [PMC free article] [PubMed] [Google Scholar]
- 19.Tugarinov V, Venditti V, Marius Clore G. A NMR experiment for simultaneous correlations of valine and leucine/isoleucine methyls with carbonyl chemical shifts in proteins. J Biomol NMR. 2014;58:1–8. doi: 10.1007/s10858-013-9803-1. [DOI] [PMC free article] [PubMed] [Google Scholar]
- 20.Hu W, Namanja AT, Wong S, Chen Y. Selective editing of Val and Leu methyl groups in high molecular weight protein NMR. J Biomol NMR. 2012;53:113–124. doi: 10.1007/s10858-012-9629-2. [DOI] [PMC free article] [PubMed] [Google Scholar]
- 21.Zhang W, Liu HT. MAPK signal pathways in the regulation of cell proliferation in mammalian cells. Cell Res. 2002;12:9–18. doi: 10.1038/sj.cr.7290105. [DOI] [PubMed] [Google Scholar]
- 22.Rose BA, Force T, Wang Y. Mitogen-activated protein kinase signaling in the heart: angels versus demons in a heartbreaking tale. Physiol Rev. 2010;90:1507–1546. doi: 10.1152/physrev.00054.2009. [DOI] [PMC free article] [PubMed] [Google Scholar]
- 23.Piserchio A, Warthaka M, Devkota AK, Kaoud TS, Lee S, Abramczyk O, Ren P, Dalby KN, Ghose R. Solution NMR insights into docking interactions involving inactive ERK2. Biochemistry. 2011;50:3660–3672. doi: 10.1021/bi2000559. [DOI] [PMC free article] [PubMed] [Google Scholar]
- 24.Xiao Y, Lee T, Latham MP, Warner LR, Tanimoto A, Pardi A, Ahn NG. Phosphorylation releases constraints to domain motion in ERK2. Proc Natl Acad Sci U S A. 2014;111:2506–2511. doi: 10.1073/pnas.1318899111. [DOI] [PMC free article] [PubMed] [Google Scholar]
- 25.Zwahlen C, Gardner KH, Sarma SP, Horita DA, Byrd RA, Kay LE. An NMR experiment for measuring methyl-methyl NOEs in C-13-labeled proteins with high resolution. J Am Chem Soc. 1998;120:7617–7625. [Google Scholar]
- 26.Fesik SW, Zuiderweg ERP. Heteronuclear 3-Dimensional Nmr-Spectroscopy - a Strategy for the Simplification of Homonuclear Two-Dimensional Nmr-Spectra. J Magn Reson. 1988;78:588–593. [Google Scholar]
- 27.Delaglio F, Grzesiek S, Vuister GW, Zhu G, Pfeifer J, Bax A. NMRPipe: a multidimensional spectral processing system based on UNIX pipes. J Biomol NMR. 1995;6:277–293. doi: 10.1007/BF00197809. [DOI] [PubMed] [Google Scholar]
- 28.Zhu GA, Bax A. 2-Dimensional Linear Prediction for Signals Truncated in Both Dimensions. J Magn Reson. 1992;98:192–199. [Google Scholar]
- 29.Vranken WF, Boucher W, Stevens TJ, Fogh RH, Pajon A, Llinas M, Ulrich EL, Markley JL, Ionides J, Laue ED. The CCPN data model for NMR spectroscopy: development of a software pipeline. Proteins: Struct, Funct, Genet. 2005;59:687–696. doi: 10.1002/prot.20449. [DOI] [PubMed] [Google Scholar]
- 30.Fraczkiewicz R, Braun W. Exact and efficient analytical calculation of the accessible surface areas and their gradients for macromolecules. J Comput Chem. 1998;19:319–333. [Google Scholar]
- 31.Lee T, Hoofnagle AN, Kabuyama Y, Stroud J, Min X, Goldsmith EJ, Chen L, Resing KA, Ahn NG. Docking motif interactions in MAP kinases revealed by hydrogen exchange mass spectrometry. Mol Cell. 2004;14:43–55. doi: 10.1016/s1097-2765(04)00161-3. [DOI] [PubMed] [Google Scholar]
- 32.Cavanagh J, Fairbrother WJ, Palmer AG, Rance M, Skelton NJ. In: Protein NMR Spectroscopy: Principles and Practice. 2nd. Cavanagh J, Fairbrother WJ, Palmer AG III, Rance M, Skelton NJ, editors. Elsevier Academic Press; Burlington, MA: 2007. pp. 1–888. [Google Scholar]
- 33.King JL, Jukes TH. Non-Darwinian evolution. Science. 1969;164:788–798. doi: 10.1126/science.164.3881.788. [DOI] [PubMed] [Google Scholar]
- 34.Ulrich EL, Akutsu H, Doreleijers JF, Harano Y, Ioannidis YE, Lin J, Livny M, Mading S, Maziuk D, Miller Z, Nakatani E, Schulte CF, Tolmie DE, Kent Wenger R, Yao H, Markley JL. BioMagResBank. Nucleic Acids Res. 2008;36:D402–408. doi: 10.1093/nar/gkm957. [DOI] [PMC free article] [PubMed] [Google Scholar]
- 35.Gardner KH, Kay LE. Production and incorporation of N-15, C-13, H-2 (H-1-delta 1 methyl) isoleucine into proteins for multidimensional NMR studies. J Am Chem Soc. 1997;119:7599–7600. [Google Scholar]
- 36.Goto NK, Gardner KH, Mueller GA, Willis RC, Kay LE. A robust and cost-effective method for the production of Val, Leu, Ile (delta 1) methyl-protonated N-15-, C-13-, H-2-labeled proteins. J Biomol NMR. 1999;13:369–374. doi: 10.1023/a:1008393201236. [DOI] [PubMed] [Google Scholar]
- 37.Tugarinov V, Kay LE. An isotope labeling strategy for methyl TROSY spectroscopy. J Biomol NMR. 2004;28:165–172. doi: 10.1023/B:JNMR.0000013824.93994.1f. [DOI] [PubMed] [Google Scholar]
- 38.Tugarinov V, Kay LE. Methyl groups as probes of structure and dynamics in NMR studies of high-molecular-weight proteins. ChemBioChem. 2005;6:1567–1577. doi: 10.1002/cbic.200500110. [DOI] [PubMed] [Google Scholar]
- 39.Garai A, Zeke A, Gogl G, Toro I, Fordos F, Blankenburg H, Barkai T, Varga J, Alexa A, Emig D, Albrecht M, Remenyi A. Specificity of linear motifs that bind to a common mitogen-activated protein kinase docking groove. Sci Signaling. 2012;5:ra74. doi: 10.1126/scisignal.2003004. [DOI] [PMC free article] [PubMed] [Google Scholar]
- 40.Zhou T, Sun L, Humphreys J, Goldsmith EJ. Docking interactions induce exposure of activation loop in the MAP kinase ERK2. Structure. 2006;14:1011–1019. doi: 10.1016/j.str.2006.04.006. [DOI] [PubMed] [Google Scholar]
- 41.Skora L, Mestan J, Fabbro D, Jahnke W, Grzesiek S. NMR reveals the allosteric opening and closing of Abelson tyrosine kinase by ATP-site and myristoyl pocket inhibitors. Proc Natl Acad Sci U S A. 2013;110:E4437–4445. doi: 10.1073/pnas.1314712110. [DOI] [PMC free article] [PubMed] [Google Scholar]
- 42.Xiao Y, Liddle JC, Pardi A, Ahn NG. Dynamics of protein kinases: insights from nuclear magnetic resonance. Acc Chem Res. 2015;48:1106–1114. doi: 10.1021/acs.accounts.5b00001. [DOI] [PMC free article] [PubMed] [Google Scholar]
- 43.Zheng J, Trafny EA, Knighton DR, Xuong NH, Taylor SS, Ten Eyck LF, Sowadski JM. 2.2 A refined crystal structure of the catalytic subunit of cAMP-dependent protein kinase complexed with MnATP and a peptide inhibitor. Acta Crystallogr, Sect D: Biol Crystallogr. 1993;49:362–365. doi: 10.1107/S0907444993000423. [DOI] [PubMed] [Google Scholar]
- 44.Motlagh HN, Wrabl JO, Li J, Hilser VJ. The ensemble nature of allostery. Nature. 2014;508:331–339. doi: 10.1038/nature13001. [DOI] [PMC free article] [PubMed] [Google Scholar]
- 45.Baldwin AJ, Kay LE. NMR spectroscopy brings invisible protein states into focus. Nat Chem Biol. 2009;5:808–814. doi: 10.1038/nchembio.238. [DOI] [PubMed] [Google Scholar]
- 46.Tong M, Seeliger MA. Targeting conformational plasticity of protein kinases. ACS Chem Biol. 2015;10:190–200. doi: 10.1021/cb500870a. [DOI] [PubMed] [Google Scholar]
- 47.Sinha K, Jen-Jacobson L, Rule GS. Divide and conquer is always best: sensitivity of methyl correlation experiments. J Biomol NMR. 2013;56:331–335. doi: 10.1007/s10858-013-9751-9. [DOI] [PMC free article] [PubMed] [Google Scholar]
- 48.Tzeng SR, Pai MT, Kalodimos CG. NMR studies of large protein systems. Methods Mol Biol. 2012;831:133–140. doi: 10.1007/978-1-61779-480-3_8. [DOI] [PMC free article] [PubMed] [Google Scholar]
- 49.Miyanoiri Y, Takeda M, Okuma K, Ono AM, Terauchi T, Kainosho M. Differential isotope-labeling for Leu and Val residues in a protein by E. coli cellular expression using stereospecifically methyl labeled amino acids. J Biomol NMR. 2013;57:237–249. doi: 10.1007/s10858-013-9784-0. [DOI] [PubMed] [Google Scholar]
- 50.Lichtenecker RJ, Coudevylle N, Konrat R, Schmid W. Selective isotope labelling of leucine residues by using alpha-ketoacid precursor compounds. ChemBioChem. 2013;14:818–821. doi: 10.1002/cbic.201200737. [DOI] [PubMed] [Google Scholar]
- 51.Gans P, Hamelin O, Sounier R, Ayala I, Dura MA, Amero CD, Noirclerc-Savoye M, Franzetti B, Plevin MJ, Boisbouvier J. Stereospecific isotopic labeling of methyl groups for NMR spectroscopic studies of high-molecular-weight proteins. Angew Chem, Int Ed. 2010;49:1958–1962. doi: 10.1002/anie.200905660. [DOI] [PubMed] [Google Scholar]
- 52.Kainosho M, Torizawa T, Iwashita Y, Terauchi T, Mei Ono A, Güntert P. Optimal isotope labelling for NMR protein structure determinations. Nature. 2006;440:52–57. doi: 10.1038/nature04525. [DOI] [PubMed] [Google Scholar]
- 53.Neri D, Szyperski T, Otting G, Senn H, Wüthrich K. Stereospecific nuclear magnetic resonance assignments of the methyl groups of valine and leucine in the DNA-binding domain of the 434 repressor by biosynthetically directed fractional 13C labeling. Biochemistry. 1989;28:7510–7516. doi: 10.1021/bi00445a003. [DOI] [PubMed] [Google Scholar]
- 54.Fischer M, Kloiber K, Hausler J, Ledolter K, Konrat R, Schmid W. Synthesis of a 13C-methyl-group-labeled methionine precursor as a useful tool for simplifying protein structural analysis by NMR spectroscopy. ChemBioChem. 2007;8:610–612. doi: 10.1002/cbic.200600551. [DOI] [PubMed] [Google Scholar]
- 55.Gelis I, Bonvin AM, Keramisanou D, Koukaki M, Gouridis G, Karamanou S, Economou A, Kalodimos CG. Structural basis for signal-sequence recognition by the translocase motor SecA as determined by NMR. Cell. 2007;131:756–769. doi: 10.1016/j.cell.2007.09.039. [DOI] [PMC free article] [PubMed] [Google Scholar]
- 56.Sinha K, Jen-Jacobson L, Rule GS. Specific labeling of threonine methyl groups for NMR studies of protein-nucleic acid complexes. Biochemistry. 2011;50:10189–10191. doi: 10.1021/bi201496d. [DOI] [PMC free article] [PubMed] [Google Scholar]
- 57.Lichtenecker R, Ludwiczek ML, Schmid W, Konrat R. Simplification of protein NOESY spectra using bioorganic precursor synthesis and NMR spectral editing. J Am Chem Soc. 2004;126:5348–5349. doi: 10.1021/ja049679n. [DOI] [PubMed] [Google Scholar]
- 58.Velyvis A, Schachman HK, Kay LE. Assignment of Ile, Leu, and Val methyl correlations in supra-molecular systems: an application to aspartate transcarbamoylase. J Am Chem Soc. 2009;131:16534–16543. doi: 10.1021/ja906978r. [DOI] [PubMed] [Google Scholar]
- 59.Stratmann D, Guittet E, van Heijenoort C. Robust structure-based resonance assignment for functional protein studies by NMR. J Biomol NMR. 2010;46:157–173. doi: 10.1007/s10858-009-9390-3. [DOI] [PMC free article] [PubMed] [Google Scholar]
- 60.Stratmann D, van Heijenoort C, Guittet E. NOEnet-Use of NOE networks for NMR resonance assignment of proteins with known 3D structure. Bioinformatics. 2009;25:474–481. doi: 10.1093/bioinformatics/btn638. [DOI] [PMC free article] [PubMed] [Google Scholar]
- 61.Crippen GM, Rousaki A, Revington M, Zhang Y, Zuiderweg ER. SAGA: rapid automatic mainchain NMR assignment for large proteins. J Biomol NMR. 2010;46:281–298. doi: 10.1007/s10858-010-9403-2. [DOI] [PubMed] [Google Scholar]
- 62.MacRaild CA, Norton RS. RASP: rapid and robust backbone chemical shift assignments from protein structure. J Biomol NMR. 2014;58:155–163. doi: 10.1007/s10858-014-9813-7. [DOI] [PubMed] [Google Scholar]
- 63.Venditti V, Fawzi NL, Clore GM. Automated sequence- and stereo-specific assignment of methyl-labeled proteins by paramagnetic relaxation and methyl-methyl nuclear Overhauser enhancement spectroscopy. J Biomol NMR. 2011;51:319–328. doi: 10.1007/s10858-011-9559-4. [DOI] [PMC free article] [PubMed] [Google Scholar]
- 64.Burkhard KA, Chen F, Shapiro P. Quantitative analysis of ERK2 interactions with substrate proteins: roles for kinase docking domains and activity in determining binding affinity. J Biol Chem. 2011;286:2477–2485. doi: 10.1074/jbc.M110.177899. [DOI] [PMC free article] [PubMed] [Google Scholar]
- 65.Francis DM, Rozycki B, Koveal D, Hummer G, Page R, Peti W. Structural basis of p38alpha regulation by hematopoietic tyrosine phosphatase. Nat Chem Biol. 2011;7:916–924. doi: 10.1038/nchembio.707. [DOI] [PMC free article] [PubMed] [Google Scholar]
- 66.Akella R, Moon TM, Goldsmith EJ. Unique MAP Kinase binding sites. Biochim Biophys Acta, Proteins Proteomics. 2008;1784:48–55. doi: 10.1016/j.bbapap.2007.09.016. [DOI] [PMC free article] [PubMed] [Google Scholar]
- 67.Piserchio A, Ramakrishan V, Wang H, Kaoud TS, Arshava B, Dutta K, Dalby KN, Ghose R. Structural and Dynamic Features of F-recruitment Site Driven Substrate Phosphorylation by ERK2. Sci Rep. 2015;5:11127. doi: 10.1038/srep11127. [DOI] [PMC free article] [PubMed] [Google Scholar]
- 68.Lee T, Hoofnagle AN, Resing KA, Ahn NG. Hydrogen exchange solvent protection by an ATP analogue reveals conformational changes in ERK2 upon activation. J Mol Biol. 2005;353:600–612. doi: 10.1016/j.jmb.2005.08.029. [DOI] [PubMed] [Google Scholar]
- 69.Sours KM, Xiao Y, Ahn NG. Extracellular-regulated kinase 2 is activated by the enhancement of hinge flexibility. J Mol Biol. 2014;426:1925–1935. doi: 10.1016/j.jmb.2014.02.011. [DOI] [PMC free article] [PubMed] [Google Scholar]
- 70.Tokunaga Y, Takeuchi K, Takahashi H, Shimada I. Allosteric enhancement of MAP kinase p38alpha’s activity and substrate selectivity by docking interactions. Nat Struct Mol Biol. 2014;21:704–711. doi: 10.1038/nsmb.2861. [DOI] [PubMed] [Google Scholar]
- 71.Prowse CN, Deal MS, Lew J. The complete pathway for catalytic activation of the mitogen-activated protein kinase, ERK2. J Biol Chem. 2001;276:40817–40823. doi: 10.1074/jbc.M105860200. [DOI] [PubMed] [Google Scholar]
- 72.Kornev AP, Haste NM, Taylor SS, Eyck LF. Surface comparison of active and inactive protein kinases identifies a conserved activation mechanism. Proc Natl Acad Sci U S A. 2006;103:17783–17788. doi: 10.1073/pnas.0607656103. [DOI] [PMC free article] [PubMed] [Google Scholar]
- 73.Kovrigin EL. NMR line shapes and multi-state binding equilibria. J Biomol NMR. 2012;53:257–270. doi: 10.1007/s10858-012-9636-3. [DOI] [PubMed] [Google Scholar]
Associated Data
This section collects any data citations, data availability statements, or supplementary materials included in this article.