Abstract
Purpose
To develop and test the suitability and performance of a comprehensive quality assurance (QA) phantom for the Small Animal Radiation Research Platform (SARRP).
Methods and materials
A QA phantom was developed for carrying out daily, monthly and annual QA tasks including: imaging, dosimetry and treatment planning system (TPS) performance evaluation of the SARRP. The QA phantom consists of 15 (60 × 60 × 5 mm3) kV-energy tissue equivalent solid water slabs. The phantom can incorporate optically stimulated luminescence dosimeters (OSLD), Mosfet or film. One slab, with inserts and another slab with hole patterns are particularly designed for image QA.
Results
Output constancy measurement results showed daily variations within 3%. Using the Mosfet in phantom as target, results showed that the difference between TPS calculations and measurements was within 5%. Annual QA results for the Percentage depth dose (PDD) curves, lateral beam profiles, beam flatness and beam profile symmetry were found consistent with results obtained at commissioning. PDD curves obtained using film and OSLDs showed good agreement. Image QA was performed monthly, with image-quality parameters assessed in terms of CBCT image geometric accuracy, CT number accuracy, image spatial resolution, noise and image uniformity.
Conclusions
The results show that the developed QA phantom can be employed as a tool for comprehensive performance evaluation of the SARRP. The study provides a useful reference for development of a comprehensive quality assurance program for the SARRP and other similar small animal irradiators, with proposed tolerances and frequency of required tests.
Keywords: SARRP, QA phantom, Micro-irradiator
Introduction
The small animal radiation research platform (SARRP) is an isocentric irradiation system that combines a micro irradiator, cone beam CT imaging, and a treatment planning system [1]. The SARRP allows for image-guided radiotherapy research to be conducted at preclinical level [2,3]. By mimicking the clinical system, the SARRP has the capabilities to deliver conformal dose distribution with precision and accuracy to the target volume while minimizing dose to healthy tissue [4].
Use of the SARRP for conducting preclinical research on small animals has become more common over the past years in different institutions across the world. There is, therefore, also increasing need for developing quality assurance tools and protocols with recommended tolerance levels for such small animal radiotherapy systems. In previous work, Ngwa et al. [5] developed a Mosfet phantom, using Mosfet dosimeters for facilitating SARRP QA tasks which may warrant daily evaluation. Other work on the commissioning and calibration of the SARRP using gafchromic (EBT2) film has been reported, covering dosimetry tasks such as: measurements of beam profiles, percent depth dose and isocenter congruency test [6,7]. The purpose of this work is to develop and test the suitability and performance of a comprehensive QA phantom for the SARRP. This phantom was developed as a tool for carrying out daily, monthly and annual QA tasks including: imaging, dosimetry and treatment planning system (TPS) performance evaluation. The results should provide a useful reference for development of a comprehensive quality assurance program with proposed tolerances for the SARRP and potentially other small animal irradiators.
Materials and methods
SARRP
A SARRP (Gulmay Medical Inc, 480 Brodgon Rd, Suwanee, GA USA) consists of an x-ray tube mounted on a gantry, with a robotic stage serving as a couch on which the animal is placed. This robotic stage has four degree of freedom x, y z, and φ (couch angle). In imaging mode an SARRP typically operates at 60–80 kVp and 0.5 mA using 1 mm of Al filtration. In therapy mode, it typically operates at 175–220 kVp with 0.15 mm of Cu filtration. The SARRP uses isocentric design in both modes and employs a laser alignment system. The gantry currently rotates up to 120°. Cone Beam CT (CBCT) images can be obtained at gantry angle of 90°, using a 20 × 20 cm2 (1024 × 1024 pixel) flat panel amorphous silicon detector placed at 50 cm from x-ray source, as the couch rotates. The radiation is delivered through different collimator fields. The most commonly used sizes in our institution include: 3 × 3 mm2, 5 × 5 mm2, 10 × 10 cm2, and 0.5 mm or 12 mm diameter fields. Through this range of field sizes, the SAARP can deliver a conformal beam that enables researchers to mimic sophisticated modern clinical radiotherapy at downscaled geometry with high accuracy (0.2 mm) and precision in small animals [1].
Dosimetry
Film
The Film used in QA procedure was gafchromic EBT3 (Ashland Inc., Covington, KY, USA). It's high 2D resolution enables to evaluate dose distribution and the film has a useable range of up to 40 Gy. The main composition of EBT3 film is a yellow marker dye that changes when exposed to ionizing radiation. Unlike the EBT2, the EBT3 is orientation independent since the active film layer is located at the center [8]. Before use, a calibration curve representing the optical density of the EBT3 film versus the dose was obtained by placing the film between the phantom slabs at the isocenter and irradiating the film at different exposure time between 10 s and 200 s. For the same exposure time and geometry, the dose was obtained with calibrated ion chamber A18 (Extradin Ion chambers, Standard Imaging, Inc. Middleton, WI USA) also inserted in a kV-energy tissue equivalent solid water phantom (PTW, Freiburg, Germany), with measurements performed following the recommendation of AAPM Task Group 61 [9]. In general, films were read pre-irradiation and post-irradiation by using an EPSON flatbed scanner (model Perfection V700) in transmission mode. For each set of the film, 3 trials were performed to reduce uncertainties. The scanned film was saved in TIFF format at a resolution 400 dpi. Film position in scanner, and post irradiation time were taken into account. The image analysis was performed using Imagej (National Institute of Health, Bethseda, MA, USA). For the commissioning task, the gafchromic EBT 2 was used. The calibration curve and dose measurement procedures were performed as reported in previous work [10,11].
Mosfets
The Metal Oxide Semiconductor Field Effect Transistors (Mosfets) used have a small active volume of 0.2 mm × 0.2 mm. Such a small active volume can serve as a suitable target volume in the CT image of the SARRP. Mosfets also have advantage due to prompt readout of results, and multiple, repeatable dose measurement capability. The difference of voltage applied to the Mosfet before and after x-ray exposure is used to measure a dose. The Mosfet was read by using the TN-RD-70-W mobile MOSFET System (Best Medical Ottawa Canada). All Mosfets were cross calibrated to the ion chamber and the calibration curve was obtained by preforming the measurement at different depth of the QA phantom.
OSLD
Another dosimeter used in this work is the nanoDot optically stimulated luminescent dosimeter (OSLD). Like the Mosfet, the OSLD is a one dimensional dosimeter with a small active volume. It has dimension of 1 cm × 1 cm × 0.2 mm, a dose range from 10 µGy to 10 Gy, and readout time within 10 min [12]. Advantages of OSLDs include their relative ease of use, accuracy and cost-effectiveness [13]. To calibrate OSLDs, the ion chamber A18 was used to collect 3 trials of doses at 0 cGy, 3 different doses less than 10 cGy, and 3 different doses above 10 cGy. The calibration curve was obtained as described in user's guide of manufacturer (Landauer Inc, Glenwood, Illinois, USA).
Phantom measurements
Phantom design
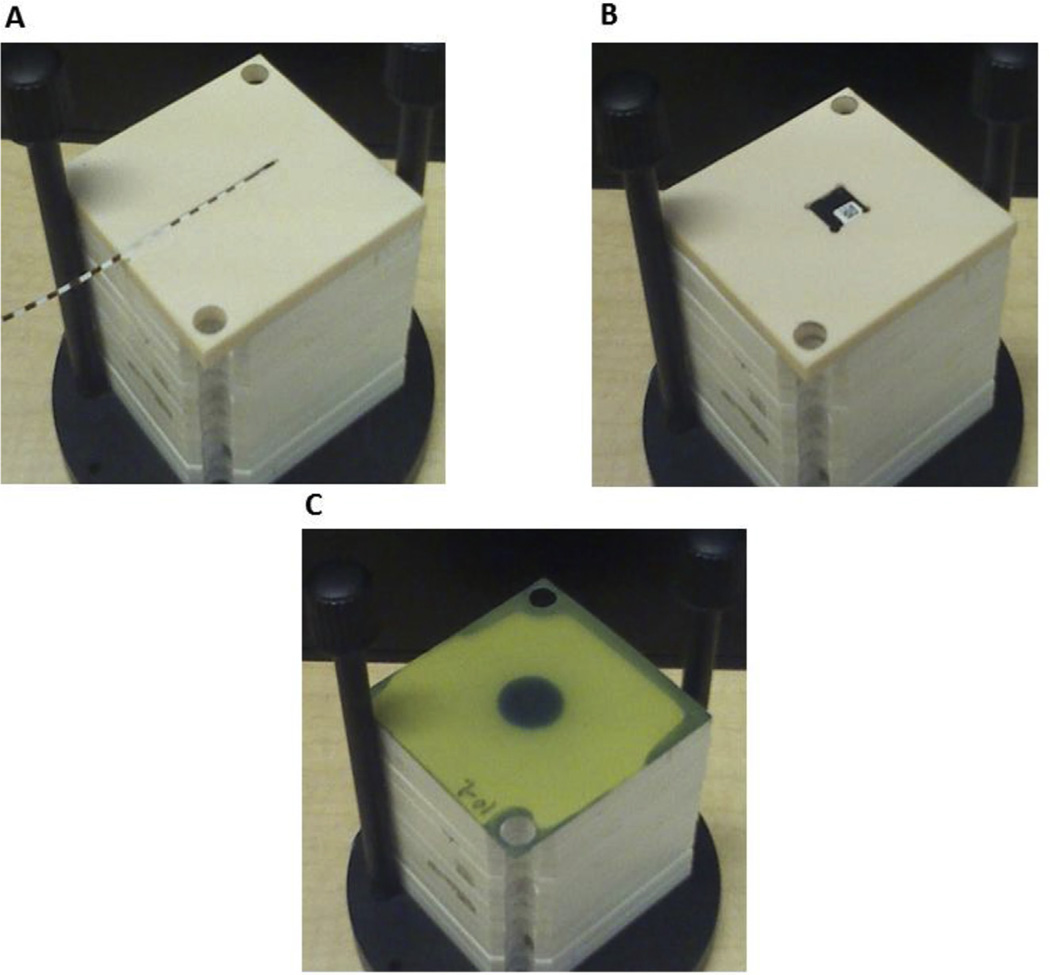
The developed QA phantom consists of fifteen (60 × 60 × 5 mm3) KV-energy tissue equivalent solid water slabs that can incorporate film, Mosfets or OSLDs (Fig. 1). The slabs are designed to facilitate QA tasks such as output constancy, treatment planning system (TPS) QA, and annual QA tasks typical for clinical systems. One slab with inserts was designated for general image QA and another slab with hole patterns for CBCT image resolution QA.
Figure 1.
QA phantom can incorporate different dosimeters (film, OSLD and Mosfet) in tissue equivalent solid water slab. The QA phantom in jig holder showing (A) slab with Mosfet in groove, (B) slab with OSLD in groove and (C) EBT3 film in annual QA position.
Dosimetric QA
SARRP output was verified daily and potential tolerances were determined. Eight solid water slabs with a Mosfet in the top slab was used. Output constancy was assessed for field sizes of 3 × 3 mm2, 5 × 5 mm2, and 12 mm.
PDDs were measured as part of annual QA [14]; the films were sandwiched between fifteen solid water slabs mounted on a commissioning jig (Gulmay GA USA). All films were irradiated at 220 kVp and 13 mA. Furthermore, the flatness, symmetry, and penumbra of beam profiles were investigated. The symmetry and flatness were analyzed over 80% of the dose profile normalized to the maximum dose. All data for the penumbra were extracted between 20% and 80% of the maximum dose profile curve and compared to the commissioning data.
For comparison, PDD measurements were also performed by using the QA phantom with incorporated OSLDs. The PDD measurements for OSLDs and films were compared for the 5 × 5 mm2 and 12 mm collimators.
Treatment planning system (TPS) QA
The TPS QA was carried out on monthly basis by comparing the TPS planned and measured dose. The QA phantom with incorporated Mosfet was used for TPS QA. Evaluations were carried out separately for Mosfet at surface and for Mosfet at 2 cm depth. The DICOM images of imaged Mosfet in phantom were exported to the TPS, and then the delineation of the Mosfet's active volume as target was performed. The TPS allows selecting the isocenter target, gantry angle, field type, couch angle, and field size in order to perform dose calculation, which includes heterogeneity corrections and beam delivery from different angles. After calculating the dose, the TPS sends the calculated dose with accompanying parameters to the micro irradiator for treatment delivery. Comparison of the doses planned and measured was repeated over a month to assess reproducibility. The measurements were assessed for collimators of size: 5 × 5 mm2, and 12 mm with treatment delivered with static gantry and couch. TPS evaluation was repeated for treatment plans delivered from different gantry angles: 0, 45, and 90°.
Image QA
The purpose of the image QA is to check that the quality of the image acquired remains close to baseline values. The baseline CBCT image was acquired with 65 kVp and 0.5 mA. The 3D image reconstruction was typically obtained in 360 projections with filter back projection algorithm. Before image QA, the calibration of CBCT detector was performed by measuring the flood and dark field gain correction. The image accuracy, uniformity and noise QA tasks were performed using images of one of the solid water phantom slabs. In the image accuracy test, the distance per pixel of the image object was measured. The image uniformity characterizes any change in the pixel intensity values or number of Hounsfield units (HU) in the image of slab. To perform uniformity test, five regions of interest (ROI) were selected: one ROI at center and four at the periphery of the image as done in previous studies [5]. The uniformity was obtained by measuring the difference between the pixel intensity values of ROIs at center and periphery. The noise was measured by using standard deviation of the intensity of pixels in the ROI at the center of the phantom.
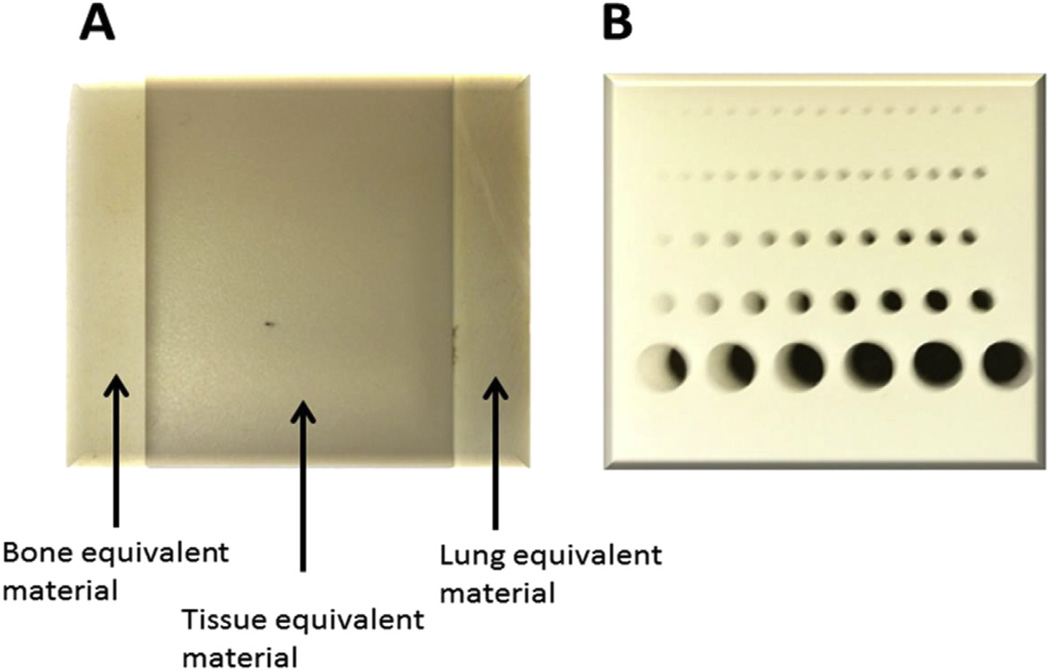
The slab of tissue-equivalent material with two inserts (Fig. 2A) of lung and bone equivalent materials was employed for CT number QA. The CT number is represented here by the following equation: , where I is the pixel intensity value of ROI from the material and Iw is pixel intensity value of ROI from water. The pixel image intensity analysis was processed using ImageJ.
Figure 2.
Image QA phantom. (A) Tissue equivalent material slab (60 × 60 × 5 mm) with 3 inserts, (B) slab phantom (25 × 25 × 10 mm) with holes for CBCT image resolution.
Following recommendations from the manufacturer, CBCT Image resolution QA was performed on an image reconstructed from 1440 image projections taken at 50 kVp and 0.8 mA. The QA slab (Fig. 2B) for this test contains a series or pattern of equi-distant holes with different sizes. Following American College of Radiology guidelines, the smallest hole size distinctly resolved in the CBCT image is considered a measure of spatial resolution. In general, qualitative QA can also be done by visual comparison of images of this slab with a reference image obtained e.g. during commissioning or acceptance testing.
Results
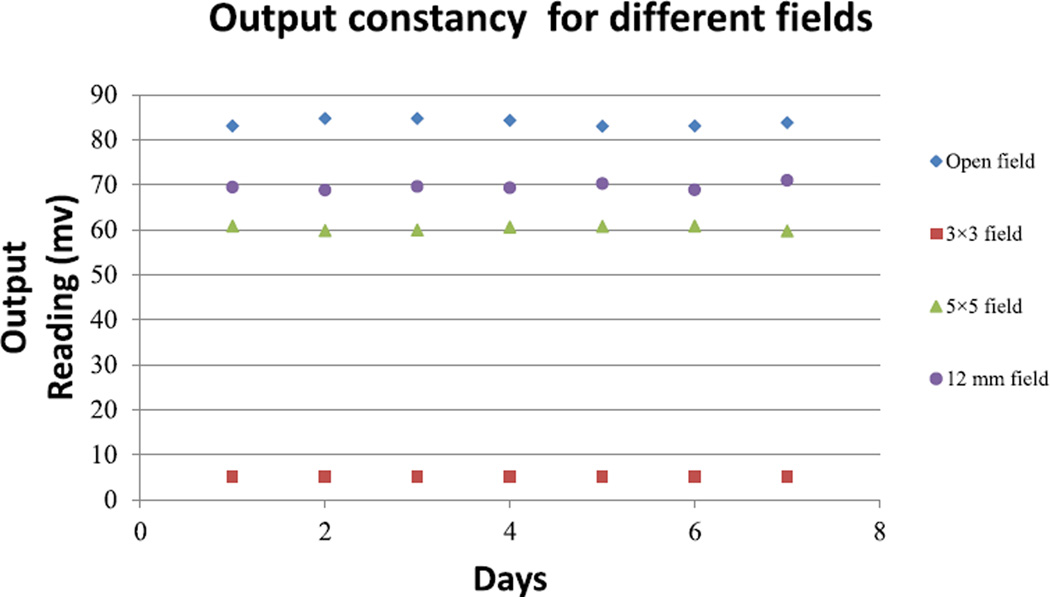
The output constancy QA results for different field sizes (Fig. 3) showed maximum differences of 2.5%, 2.3%, 2.01%, and 1.89%, respectively, for open field (20 × 20 cm2), 3 × 3 mm, 5 × 5 mm2, and 12 mm fields. The results are within the tolerances (3% for daily QA) recommended by AAPM Task report 40 and 142 [14,15].
Figure 3.
The SARRP output check measurements collected daily over a week.
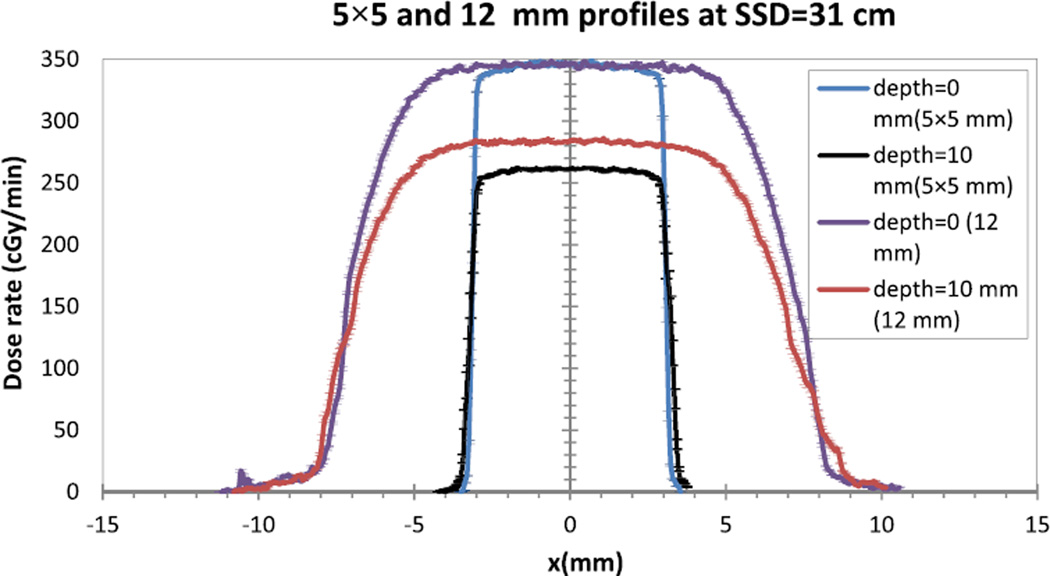
Figure 4 shows the lateral profile for field size of 5 × 5 mm2 and 12 mm at two depths (0 mm and 10 mm). Analyzed results (Table 1) show the beam flatness results between 1.78% and 3.1%, and the beam profile symmetry between 1.07% and 2.12% for the investigated field sizes and depths. The results of the flatness and symmetry are similar to those from previous work for clinical systems [16]. The penumbra of the 5 × 5 mm2 and 12 mm collimators showed a maximum difference of 0.8 mm between QA and commissioning measurements. This finding is lower than the 2 mm suggested by clinical protocol [17].
Figure 4.
The beam profile for 5 × 5 mm2 and 12 mm collimators at depth 0 mm and 10 mm.
Table 1.
Flatness, symmetry, and penumbra for collimator 5 × 5 mm2 and 12 mm at depth d1 = 0 mm and d2 = 10 mm, all measurements were performed at SSD = 31 cm.
| d1 = 0 mm | 5 × 5 mm2 | 12 mm |
| Flatness (%) | 2.5 | 3.1 |
| Symmetry (%) | 1.07 | 1.59 |
| Penumbra (QA) mm | 0.14 ± 0.01 | 2.1 ± 0.023 |
| Penumbra (Commissioning) mm | 0.12 ± 0 | 2.83 ± 0.02 |
| d2 = 10 mm | 5 × 5 mm2 | 12 mm |
| Flatness (%) | 1.86 | 2.04 |
| Symmetry (%) | 1.78 | 2.12 |
| Penumbra (QA) mm | 0.2 ± 0.01 | 2.2 ± 0.01 |
| Penumbra (Commissioning) mm | 0.19 ± 0 | 3.07 ± 0 |
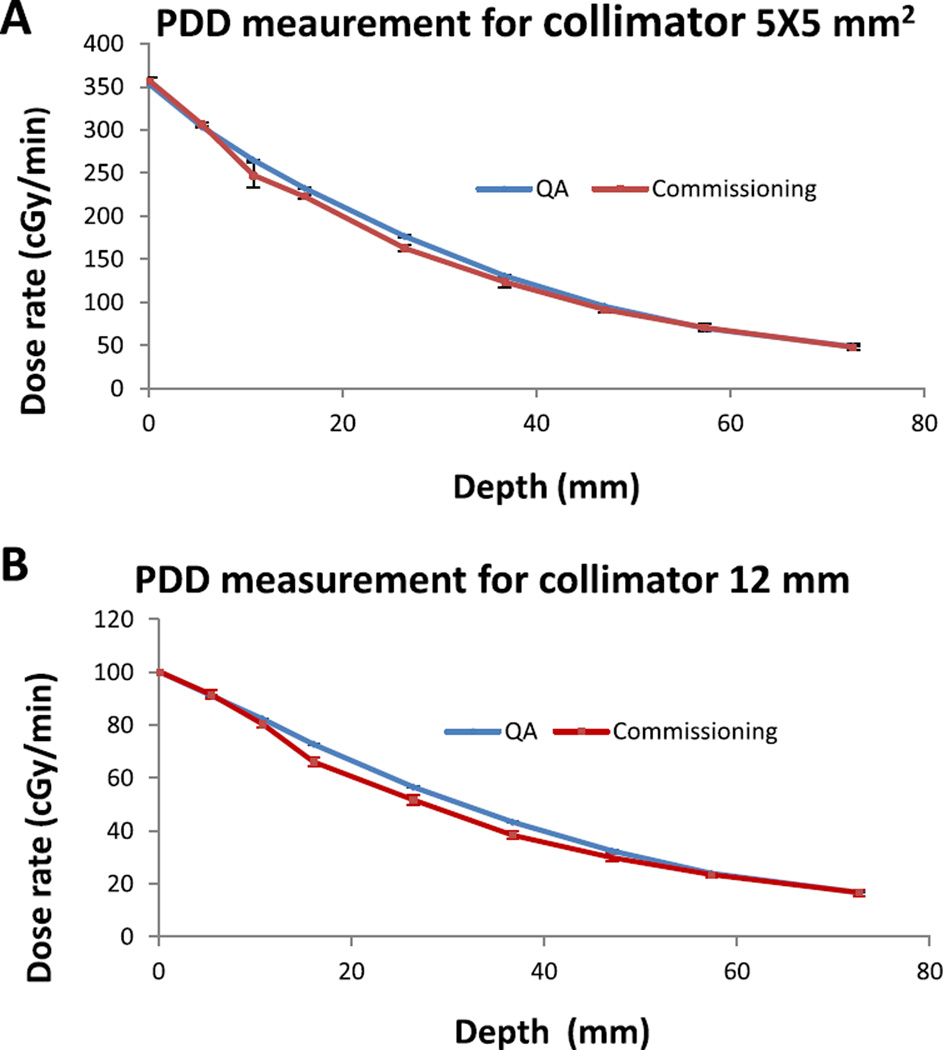
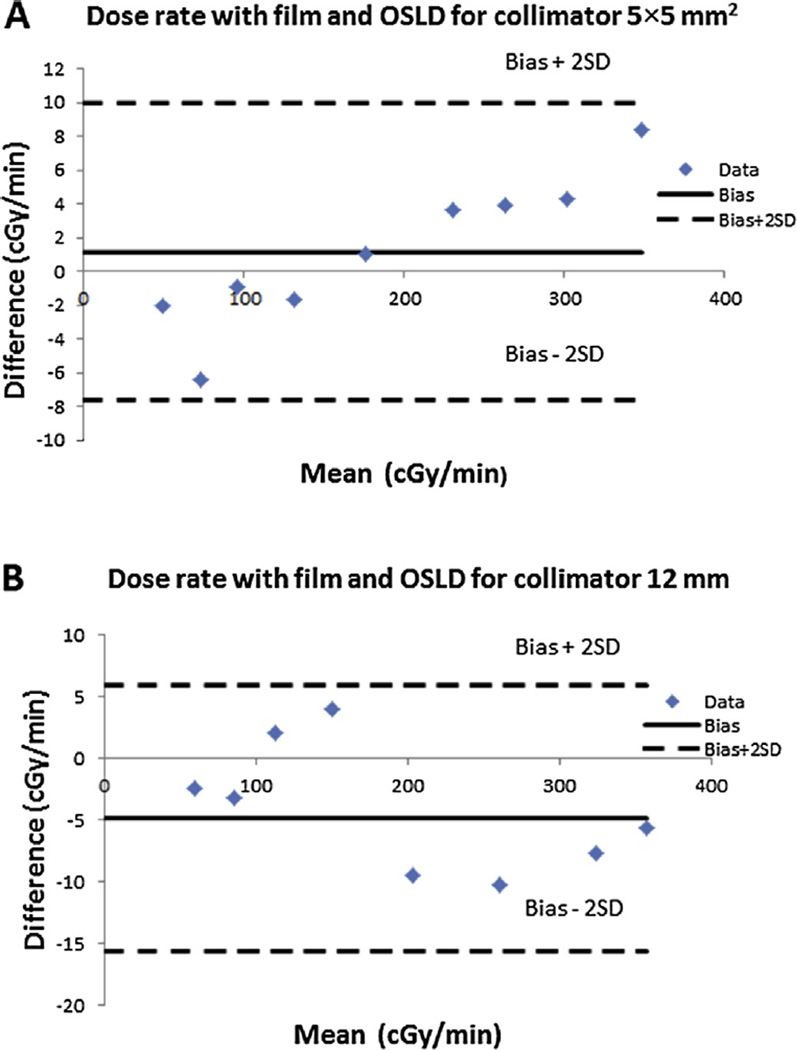
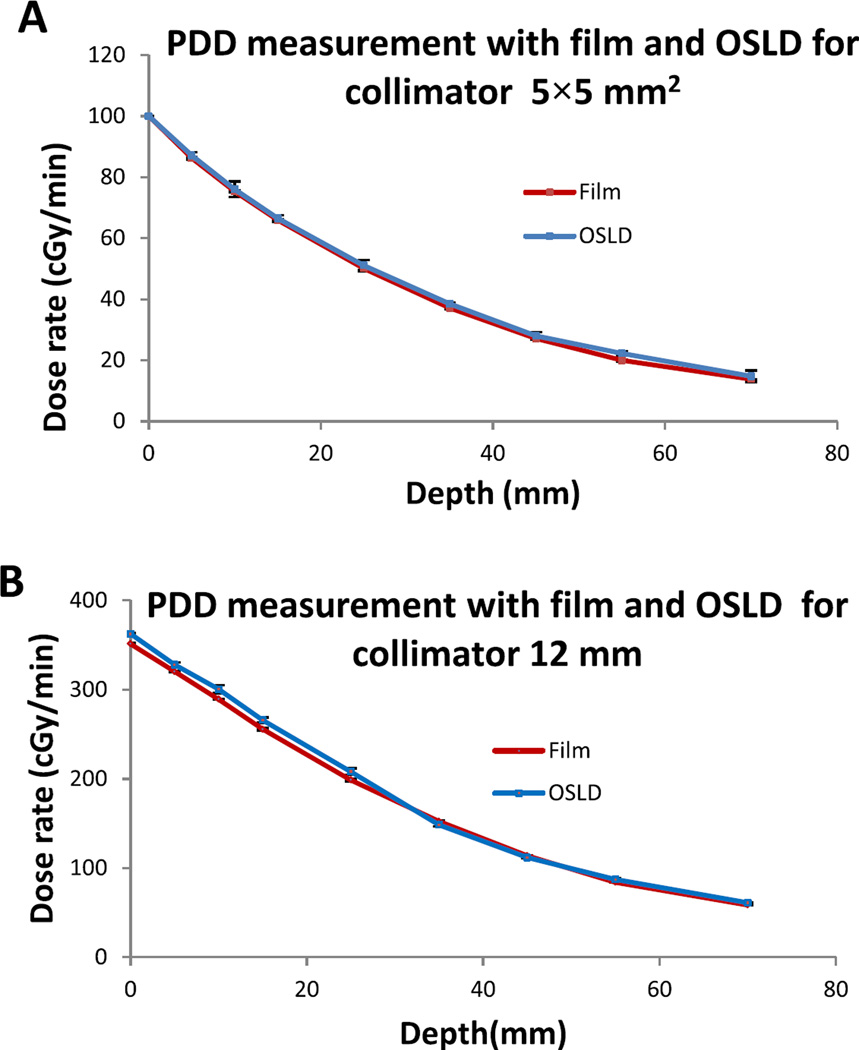
Meanwhile, from Fig. 5A–B, the PDD plot for commissioning and annual QA data shows maximum discrepancies of less than 2% for 5 × 5 mm2 and 12 mm collimators at depth 0 mm, 5 mm, 10 mm, 55 mm and 75 mm. These results are within the recommendation of AAPM Task Report 40 [14]. However for depth 15, 25, 35, and 45 mm, the maximum differences were 5% for 5 × 5 mm2 and 7% for 12 mm. These larger discrepancies could be due to uncertainties arising from film handling, air gap between slabs, orientation dependence for EBT2 film used for commissioning, etc. To further verify and validate the QA data, the PDD was also investigated using calibrated OSLDs incorporated in the QA phantom and compared to the EBT3 film method. Figure 7A–B shows good agreement of results using both methods. The Bland Altman plot was used to further analyze both dosimetry methods. For the 5 × 5 mm2 collimator, the results range between −7.65 cGy and 9.93 cGy (Fig. 7A). For the 12 mm collimator, the results are within the limit of −15.6 cGy and 5.9 cGy (Fig. 7B). Overall, all measurements for both collimators are within agreement limit that represents 95% of confidence interval. Therefore, either method (EBT3 film or OSLDs) could be employed in PDD QA measurements with comparable outcomes (see Fig. 6).
Figure 5.
A PDD measurements collected at commissioning and QA process (A) with collimator 5 × 5 mm2; (B) with collimator 12 mm. All measurements were carried out at SSD = 31 cm.
Figure 7.
(A) (B) Bland–Altman plot comparing the Film and OSLD for PDD measurements for 5 × 5 mm2 and 12 mm collimators respectively. All data are within Bias +2SD (Standard Deviation) and Bias −2SD.
Figure 6.
(A) (B) PDD for 5 × 5 mm2 and 12 mm collimators, respectively; the measurements were performed with film and OSLD at SSD = 31 cm.
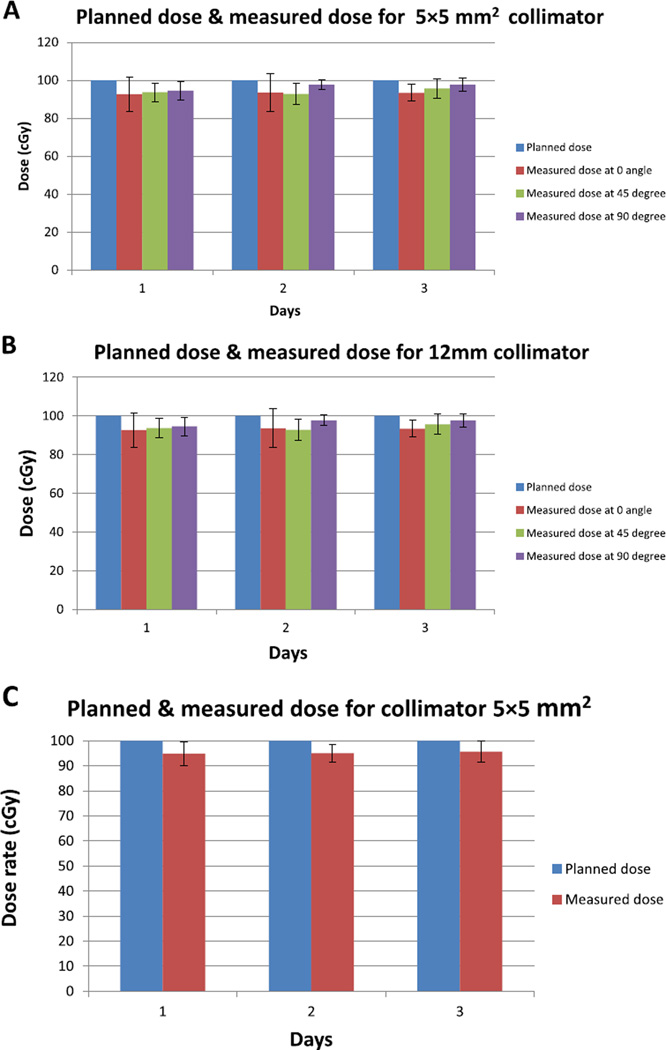
Figure 8A–B illustrates the comparison between the planned and measured dose at different gantry angles of the SARRP for two field sizes: 5 × 5 mm2 and 12 mm. The planned dose with TPS system and measured dose at surface of the QA phantom show maximal variation of 10%. These results a similar to previous data published [18] for other small animal irradiators. At 2 cm depth, the maximum difference observed was 5% (Fig. 8C). The discrepancy between the dose performed at surface and depth could be due to higher uncertainties in scatter at the surface compared to measurements at 2 cm depth. These results show constancy for measurements collected on 3 different days over a period of one month.
Figure 8.
The planned and measured dose performed at surface for (A) 5 × 5 mm2 collimator. (B) 12 mm collimator, at different angles of the gantry. (C) The planned and measured dose for the 5 × 5 mm2 collimator performed at 2 cm depth in QA phantom with gantry at 0°. All data were collected in three days over a month, the duration between two consecutives measurements was one week.
The baselines for image QA parameters (Table 2) were established by averaging the data collected in 10 days over a period of one month. The CT number of solid water or tissue-equivalent material was found to be 43.855 ± 6 HU within agreement of findings by other authors [4,5]. The bone and lung equivalent material results showed 280.675 ± 12 HU, and −644.068 ± 9 HU, respectively, within Hounsfield unit scale of the bone (300 HU) [19–21] and the lung (−700 HU) [22,23]. The image uniformity result was 19.57 ± 8 HU. This could potentially be reduced by using a scatter correction algorithm in CBCT system [24]. The image noise was found to be 44.25 ± 14 HU. The latter value is higher than for typical CBCT systems in previous work [25]. It had been shown that the implementation of bowtie filter could reduce the noise of the image CBCT [24]. By carrying out the CBCT image acquisition with 20 × 20 cm2 (1024 × 1024 pixel) flat panel amorphous silicon detector, the CBCT image accuracy using the QA imaging phantom was 0.27 pixel per mm. Over a period of 4 months, the results for CT number for bone, lung, tissue-equivalent material, noise, uniformity, and CBCT image accuracy showed minimal variation and for the CBCT spatial resolution, all rows of the holes in phantom were consistently resolved clearly, with smallest resolved hole size of 0.5 mm (Table 2).
Table 2.
CBCT image QA and baseline values acquired at 65 kVp and 0.5 mA. CT numbers of solid water, bone, and lung equivalent materials, unifomity, noise, and CBCT image accuracy. For image resolution, the image was acquired at 50 kVp and 0.8 mA.
| Tasks | Baselines | QA | QA | QA | QA |
|---|---|---|---|---|---|
| Month1 | Month2 | Month3 | Month4 | ||
| CT number of solid water equivalent material (HU) | 43.86 ± 6 | 40.12 ± 11 | 45.62 ± 5 | 44.56 ± 6 | 39.56 ± 5 |
| CT number of bone equivalent material (HU) | 280.68 ± 12 | 282.65 ± 8 | 278.69 ± 13 | 289.65 ± 12 | 290.16 ± 9 |
| CT number of lung equivalent material (HU) | −644.07 ± 9 | −660.23 ± 1 | −638.56 ± 18 | −670.15 ± 11 | −638.54 ± 6 |
| Uniformity (HU) | 19.54 ± 8.7 | 19.2 ± 1 | 22.3 ± 7.1 | 20.1 ± 9 | 18.75 ± 4.2 |
| Noise (HU) | 44.25 ± 14 | 50.89 ± 9 | 53.65 ± 6 | 38.62 ± 8 | 40.69 ± 11 |
| CBCT image accuracy (mm pixel−1) | 0.27 ± 0.01 | 0.27 ± 0.01 | 0.26 ± 0.01 | 0.27 ± 0.01 | 0.26 ± 0.01 |
| Resolution (mm) | 0.5 | 0.5 | 0.5 | 0.5 | 0.5 |
Discussion
The investigated QA phantom provides an effective comprehensive QA tool for performing daily, monthly, and annual SARRP QA. The results for output check and beam profile (flatness, symmetry, and penumbra) are consistent with the expected reference values. Based on our results over many months using different dosimeters, a recommended tolerance for output measurements could be 3% similar to clinical systems. Results using film (EBT3) showed good 2D dosimetry; however, use of film is laborious and time-consuming. Since, the film and the OSLD showed relatively good agreement at all depths investigated, the OSLD could be an alternative tool or surrogate for conducting quick dosimetry QA, as may be needed.
An important SARRP dosimetry QA task, which can also be easily performed with the comprehensive QA phantom, is the isocenter congruency test using a Mosfet in phantom as shown by Ngwa et al. [5]. Alternatively, Matinfar et al. [7] showed previously that film could also be used. Furthermore, the phantom was designed to allow interchange of the OSLD with Mosfet. In this context, due to the reusability of the OSLD and its lower cost, the output constancy could be performed with OSLD instead of the Mosfet.
The TPS results showed discrepancy of up to 10% between planned and measured dose at the surface. This percentage could potentially be reduced by taking the effects of scatter at the surface into greater consideration and/or improving the algorithm employed in the treatment planning system [24]. Also, film could be another option to verify the planned dose of the TPS system [18] In other hand, TPS QA results at depth consistently showed discrepancies within 5%. However, this study did not examine QA for more complex treatment plans, e.g. step-and-shoot or arc delivery plans. TPS QA appears reasonable on a monthly basis or before important experiments requiring accurate treatment planning.
The imaging QA Tasks included the CT number verification, CBCT image accuracy, uniformity, image noise and image resolution. However, the image QA phantom could be further adapted to include other procedures such as the high contrast resolution test. From our experience, image QA covering these different measurements appears reasonable on a monthly basis.
Conclusion
As the use of the SARRP and other small animal irradiators continues to increase across the globe, the need for tools to facilitate different QA tasks or comprehensive QA are also increasing. The QA phantom developed in this work provides one such tool. The results serve as a useful reference for development of a comprehensive quality assurance program, with proposed tolerances and frequency of required tests.
References
- 1.Matinfar M, Ford E, Iordachita I, Wong J, Kazanzides P. Image-guided small animal radiation research platform: calibration of treatment beam alignment. Phys Med Biol. 2009;54:891–905. doi: 10.1088/0031-9155/54/4/005. http://dx.doi.org/10.1088/0031-9155/54/4/005. [DOI] [PMC free article] [PubMed] [Google Scholar]
- 2.Zeng J, See AP, Phallen J, Jackson CM, Belcaid Z, Ruzevick J, et al. Anti-PD-1 blockade and stereotactic radiation produce long-term survival in mice with intracranial gliomas. Int J Radiat Oncol Biol Phys. 2013;86:343–349. doi: 10.1016/j.ijrobp.2012.12.025. http://dx.doi.org/10.1016/j.ijrobp.2012.12.025. [DOI] [PMC free article] [PubMed] [Google Scholar]
- 3.Ding K, Deng J, Du K, Cao K, Christensen G, Reinhardt J, et al. SU-D-BRB-05: small animal lung compliance imaging: assessment system for tissue sensitivity to radiation induced lung injury. Med Phys. 2012;39:3615. doi: 10.1118/1.4734677. http://dx.doi.org/10.1118/1.4734677. [DOI] [PubMed] [Google Scholar]
- 4.Verhaegen F, Granton P, Tryggestad E. Small animal radiotherapy research platforms. Phys Med Biol. 2011;56:R55–R83. doi: 10.1088/0031-9155/56/12/R01. http://dx.doi.org/10.1088/0031-9155/56/12/R01. [DOI] [PubMed] [Google Scholar]
- 5.Ngwa W, Tsiamas P, Zygmanski P, Makrigiorgos GM, Berbeco RI. A multipurpose quality assurance phantom for the small animal radiation research platform (SARRP) Phys Med Biol. 2012;57:2575–2586. doi: 10.1088/0031-9155/57/9/2575. http://dx.doi.org/10.1088/0031-9155/57/9/2575. [DOI] [PubMed] [Google Scholar]
- 6.Tryggestad E, Armour M, Iordachita I, Verhaegen F, Wong JW. A comprehensive system for dosimetric commissioning and Monte Carlo validation for the small animal radiation research platform. Phys Med Biol. 2009;54:5341–5357. doi: 10.1088/0031-9155/54/17/017. http://dx.doi.org/10.1088/0031-9155/54/17/017. [DOI] [PMC free article] [PubMed] [Google Scholar]
- 7.Matinfar M, Gray O, Iordachita I, Kennedy CW, Ford E, Wong J, et al. Small animal radiation research platform: imaging, mechanics, control and calibration. Med. Image Comput. Comput. Interv. - MICCAI 2007; 10th Int. Conf; Oct. 29–Novemb. 2, 2007; Brisbane, Aust. 2007. pp. 926–934. Proceedings, Part II. [DOI] [PubMed] [Google Scholar]
- 8.Reinhardt S, Hillbrand M, Wilkens JJ, Assmann W. Comparison of Gafchromic EBT2 and EBT3 films for clinical photon and proton beams. Med Phys. 2012;39:5257–5262. doi: 10.1118/1.4737890. http://dx.doi.org/10.1118/1.4737890. [DOI] [PubMed] [Google Scholar]
- 9.Ma CM, Coffey CW, DeWerd LA, Liu C, Nath R, Seltzer SM, et al. AAPM protocol for 40–300 kV x-ray beam dosimetry in radiotherapy and radiobiology. Med Phys. 2001;28:868–893. doi: 10.1118/1.1374247. [DOI] [PubMed] [Google Scholar]
- 10.Marco-Rius I, Wack L, Tsiamas P, Tryggestad E, Berbeco R, Hesser J, et al. A fast analytic dose calculation method for arc treatments for kilovoltage small animal irradiators. Phys Med. 2013;29:426–435. doi: 10.1016/j.ejmp.2013.02.003. http://dx.doi.org/10.1016/j.ejmp.2013.02.003. [DOI] [PubMed] [Google Scholar]
- 11.Wack L, Ngwa W, Tryggestad E, Tsiamas P, Berbeco R, Ng SK, et al. High throughput film dosimetry in homogeneous and heterogeneous media for a small animal irradiator. Phys Med. 2014;30:36–46. doi: 10.1016/j.ejmp.2013.02.002. http://dx.doi.org/10.1016/j.ejmp.2013.02.002. [DOI] [PMC free article] [PubMed] [Google Scholar]
- 12.uz Zaman M, Fatima N, Naqvi M, Parveen R, Sajjad Z. Radiation dosimetry: from thermoluminescence dosimeter (TLD) to optically stimulated luminescence dosimeter (OSLD) PJR. 2012:21. [Google Scholar]
- 13.Jursinic PA. Characterization of optically stimulated luminescent dosimeters, OSLDs, for clinical dosimetric measurements. Med Phys. 2007;34:4594–4604. doi: 10.1118/1.2804555. [DOI] [PubMed] [Google Scholar]
- 14.Kutcher GJ, Coia L, Gillin M, Hanson WF, Leibel S, Morton RJ, et al. Comprehensive QA for radiation oncology: report of AAPM radiation therapy committee task group 40. Med Phys. 1994;21:581–618. doi: 10.1118/1.597316. [DOI] [PubMed] [Google Scholar]
- 15.Klein EE, Hanley J, Bayouth J, Yin F-F, Simon W, Dresser S, et al. Task group 142 report: quality assurance of medical accelerators. Med Phys. 2009;36:4197–4212. doi: 10.1118/1.3190392. [DOI] [PubMed] [Google Scholar]
- 16.Khan FM. The physics of radiation therapy. 4th. Philadelphia: 2010. [Google Scholar]
- 17.de Oliveira LN, Guzmán Calcina CS, Parada MA, de Almeida CE, de Almeida A. Ferrous Xylenol gel measurements for 6 and 10 MV photons in small field sizes. Braz J Phys. 2007;37:1141–1146. http://dx.doi.org/10.1590/S0103-97332007000700012. [Google Scholar]
- 18.Van Hoof SJ, Granton PV, Verhaegen F. Development and validation of a treatment planning system for small animal radiotherapy: SmART-Plan. Radiother Oncol. 2013;109:361–366. doi: 10.1016/j.radonc.2013.10.003. http://dx.doi.org/10.1016/j.radonc.2013.10.003. [DOI] [PubMed] [Google Scholar]
- 19.Cassell KJ, Hobday PA, Parker RP. The implementation of a generalised Batho inhomogeneity correction for radiotherapy planning with direct use of CT numbers. Phys Med Biol. 1981;26:825–833. doi: 10.1088/0031-9155/26/5/002. http://dx.doi.org/10.1088/0031-9155/26/5/002. [DOI] [PubMed] [Google Scholar]
- 20.Aamodt A, Kvistad KA, Andersen E, Lund-Larsen J, Eine J, Benum P, et al. Determination of the Hounsfield value for CT-based design of custom femoral stems. J Bone Jt Surg Br. 1999;81:143–147. [PubMed] [Google Scholar]
- 21.Reeves TE, Mah P, McDavid WD. Deriving Hounsfield units using grey levels in cone beam CT: a clinical application. Dentomaxillofac Radiol. 2012;41:500–508. doi: 10.1259/dmfr/31640433. http://dx.doi.org/10.1259/dmfr/31640433. [DOI] [PMC free article] [PubMed] [Google Scholar]
- 22.Winslow JF, Hyer DE, Fisher RF, Tien CJ, Hintenlang DE. Construction of anthropomorphic phantoms for use in dosimetry studies. J Appl Clin Med Phys. 2009;10 doi: 10.1120/jacmp.v10i3.2986. [DOI] [PMC free article] [PubMed] [Google Scholar]
- 23.Robinson D. Inhomogeneity correction and the analytic anisotropic algorithm. J Appl Clin Med Phys. 2008;9:2786. doi: 10.1120/jacmp.v9i2.2786. [DOI] [PMC free article] [PubMed] [Google Scholar]
- 24.Hotta K, Kohno R, Takada Y, Hara Y, Tansho R, Himukai T, et al. Improved dose-calculation accuracy in proton treatment planning using a simplified Monte Carlo method verified with three-dimensional measurements in an anthropomorphic phantom. Phys Med Biol. 2010;55:3545–3556. doi: 10.1088/0031-9155/55/12/018. http://dx.doi.org/10.1088/0031-9155/55/12/018. [DOI] [PubMed] [Google Scholar]
- 25.Du LY, Umoh J, Nikolov HN, Pollmann SI, Lee T-Y, Holdsworth DW. A quality assurance phantom for the performance evaluation of volumetric micro-CT systems. Phys Med Biol. 2007;52:7087–7108. doi: 10.1088/0031-9155/52/23/021. http://dx.doi.org/10.1088/0031-9155/52/23/021. [DOI] [PubMed] [Google Scholar]


