

Abstract
Antiangiogenic agents caused paradoxical increase in pro-growth and pro-angiogenic factors and caused tumor growth in glioblastoma (GBM). It is hypothesized that paradoxical increase in pro-angiogenic factors would mobilize Bone Marrow Derived Cells (BMDCs) to the treated tumor and cause refractory tumor growth. The purposes of the studies were to determine whether whole body irradiation (WBIR) or a CXCR4 antagonist (AMD3100) will potentiate the effect of vatalanib (a VEGFR2 tyrosine kinase inhibitor) and prevent the refractory growth of GBM. Human GBM were grown orthotopically in three groups of rats (control, pretreated with WBIR and AMD3100) and randomly selected for vehicle or vatalanib treatments for 2 weeks. Then all animals underwent Magnetic Resonance Imaging (MRI) followed by euthanasia and histochemical analysis. Tumor volume and different vascular parameters (plasma volume (vp), forward transfer constant (Ktrans), back flow constant (kep), extravascular extracellular space volume (ve) were determined from MRI. In control group, vatalanib treatment increased the tumor growth significantly compared to that of vehicle treatment but by preventing the mobilization of BMDCs and interaction of CXCR4-SDF-1 using WBIR and ADM3100, respectively, paradoxical growth of tumor was controlled. Pretreatment with WBIR or AMD3100 also decreased tumor cell migration, despite the fact that ADM3100 increased the accumulation of M1 and M2 macrophages in the tumors. Vatalanib also increased Ktrans and ve in control animals but both of the vascular parameters were decreased when the animals were pretreated with WBIR and AMD3100. In conclusion, depleting bone marrow cells or CXCR4 interaction can potentiate the effect of vatalanib.
Keywords: Glioblastoma, receptor tyrosine kinase inhibitor (RTKI), bone marrow derived cells (BMDC), whole body irradiation, CXCR4 antagonist (AMD3100)
INTRODUCTION
Glioblastoma (GBM) is hypervascular tumor. Clinicians are using anti-angiogenic agent in addition to surgery, radiotherapy and chemotherapy (Venur et al., 2015; Rovere, 2014). Both in clinical and preclinical cases of GBM, agents targeting Vascular Endothelial Growth Factor (VEGF)-VEGF Receptor (R) signaling pathways are routinely being used (Ali et al., 2010, 2013; Batchelor et al., 2007; Ferrara et al., 2005; Gerstner et al., 2007; Reardon et al., 2008). Our group have previously used various VEGFR Tyrosine Kinase Inhibitors (TKIs) in preclinical models of human GBM and the results are not encouraging (Ali et al., 2010, 2013). Our results using vatalanib (a VEGFR2 TKI) indicated the activation of alternative pathways for neovascularization and release of factors/chemokines, such as stromal cell derived factor 1-alpha (SDF-1α), from the tumor cells that mobilize bone marrow cells and enhanced accumulation to the site of GBM (Ali et al., 2010). It has been observed that treatment with vatalanib caused increased growth (resistant to treatment) of GBM (Ali et al., 2010). It is important to determine whether decreasing the Bone Marrow Derived Cells (BMDCs) or preventing the interaction of Bone Marrow Progenitor Cells (BMPCs) with secreted SDF-1α will attenuate the GBM resistant to vatalanib treatment.
Suppression of bone marrow (myeloablation) can be achieved by different methods such as using high dose of toxic chemotherapeutic drugs that suppress bone marrow or by high dose of whole body irradiation (Andrade et al., 2011; Barrett et al., 1975; Kishi et al., 1994; Smith and Boots, 1980). In both the cases, antibiotics are given to combat infection and the bone marrow is replenished by transplanting bone marrow or hematopoietic stem cells (Madonna et al., 1991). However, to decrease the circulating mononuclear cells or decrease the availability of BMDCs, a sub lethal whole body irradiation or lower dose of chemotherapeutics can be used (Andrade et al., 2011; Garg et al., 2010; Goldschmidt et al., 1998; Kallmeyer et al., 1998; Ma et al., 2003). There has not been any report showing that the relation of lower number of available BMDCs and the effect of vatalanib in GBM.
Most of the BMPCs have CXC chemokine receptor 4 (CXCR4) and the receptor is specific for SDF-1α. The SDF-1α is upregulated in hypoxic tumors. The SDF-1α is a chemokine that is expressed in tumor cells and released in the circulation following hypoxia in the tumor (with the up-regulation of HIF-1α) (Arbab et al., 2008; Ceradini et al., 2004; Moore et al., 2001). In an experiment, Heissig et al. (2002) determined the mechanisms of releasing Hematopoietic Stem Cells (HSCs) and EPCs from bone marrow. Because of upregulation and secretion of SDF-1α in GBM due to presence of hypoxia, there will be more mobilization of BMPCs and accumulation of different progenitor cells in GBM causing increased immunosuppression, neovascularization and tumor growth. Our previous reports indicated that vatalanib treatment increased hypoxia in GBM and upregulation of SDF-1α causing resistant to vatalanib treatment and increased growth of GBM (Ali et al., 2010). Therefore, it is hypothesized that by using CXCR4 antagonist (ADM3100) the interaction of CXCR4 with accumulated BMPCs in the GBM can be prevented and would decrease tumor growth following vatalanib treatment.
Dynamic Contrast Enhanced Magnetic Resonance Imaging (DCE-MRI) has been used in the assessment of GBM growth and different vascular parameters following treatments (Bagher-Ebadian et al., 2012; Chwang et al., 2014). Our group have previously used MRI technique to determine different vascular parameters in GBM with or without anti-angiogenic treatments (AAT) (Ali et al., 2010, 2013). The purpose of the study was to determine the effects of bone marrow manipulation either through whole body irradiation or CXCR4 antagonist treatment on the tumor growth and vascular parameters determined by MRI with or without the treatment of vatalanib.
MATERIALS AND METHODS
All animal experiments were approved by intuitional animal care and use committee and institutional review board of Georgia Regents University. All efforts were made to decrease sufferings of animals. The CO2 with secondary method was used to euthanize animals for tissue collection.
Drugs, chemical and antibodies
Vatalanib was purchased from LC laboratories, Woburn, MA, USA. AMD3100 was purchased from TORCIS bioscience, Minneapolis, MN, USA. All buffers are from Fisher Scientific, USA. All antibodies are from Abcam, Cambridge, MA, USA.
Animal groups
There were three groups of animals undergoing different treatments. (1) Control group: non-irradiated and non-treated with AMD3100. (2) Myeloablation group; all animals in this group underwent whole body irradiation of 6Gy dose. Whole body irradiation was given using a Cs137 source 14 days before the implantation of tumor. All animals were treated with antibiotic for 4 weeks from the day of whole body irradiation. Following irradiation population of different BMDCs (CD45+, CD90+ and OX82+ cells) in peripheral blood was determined in randomly selected animals up to day 28. The CD90 is hematopoietic stem cell marker and OX82 is myeloid lineage marker for rat. (3) AMD3100 treated groups: All animals of this group were treated with AMD3100 (10 mg kg−1 day−1 continuously by an osmotic pump) from the day of tumor implantation. Randomly selected animals from each group were treated either with vehicle or with vatalanib from day 8 of tumor implantation and continued for two weeks.
Animal model
Forty three nude rats (RNU nu/nu) 6–8 weeks of age and 150–170 g of weight (Charles River Laboratory, Inc. Frederick, MD) were included in the study. Orthotopic GBM was created by injecting 4×10⁵ human glioma U251 cells suspended in 5 μL of saline at 3 mm to the right and 1 mm anterior to the bregma as described in our previous publications (Ali et al., 2010; Janic and Arbab, 2012; Kumar et al., 2012). In brief, animals were anesthetized with 100 mg kg−1 ketamine and 15 mg kg−1 xylazine i.p. The surgical zone was swabbed with betadine solution, the eyes coated with Lacri-lube and the animals were immobilized in a small animal stereotactic device (Kopf, Cayunga, CA). After draping, 1 cm incision was made 2 mm to the right of the midline 1 mm retro-orbitally, the skull exposed with cotton-tip applicators and a 23G needle tip was used to drill a hole 2 mm to the right of the bregma, taking care not to penetrate the dura. A #2701 10 μL Hamilton syringe with a #4 point, 26s gauge-needle containing tumor cells (4×10⁵) in 5 μL was lowered to a depth of 5 mm, then raised to a depth of 4 mm. The tumor cells were injected stepwise at a rate of 0.5 μL/30 sec until the entire volume was injected. During and after the injection, careful note was made of any reflux from the injection site. After completing the injection, we waited 2–3 min before withdrawing in a stepwise manner. The surgical hole was sealed with bone wax. Finally, the skull was swabbed with betadine before suturing the skin over the injection site.
Treatment schedules
Animals from control group were randomly assigned to either the drug treatment (vatalanib, n = 8) or the vehicle (n = 6). Animals from myeloablation group were randomly assigned to either the drug treatment (vatalanib, n = 9) or the vehicle (n = 8). Animals from AMD3100 treated group were randomly assigned to either the drug treatment (vatalanib, n = 6) or the vehicle (n = 6). Vatalanib (LC laboratories, Woburn, MA, USA) was prepared for oral administration using the vehicle (cremophor-EL: DMSO: PBS at 1:1:8) and was administered orally by gavage, once a day at a dose of 50 mg kg−1 per feeding for two weeks starting on day 8 following implantation of orthotopic GBM. Vehicle treated animals received vehicle (cremophor-EL: DMSO: PBS at 1:1:8) by oral gavage for two weeks starting on day 8 following implantation of tumor. Drug or vehicle administration started eight days after tumor implantation and continued for two weeks (5 days/week). On day 22 following tumor implantation, animals underwent in-vivo MRI followed by euthanasia and collection of brain tissue.
In vivo MR imaging
Animals were anesthetized with 2% isoflurane, steadily supplied with oxygen while secured to a customized cradle. All studies were performed in a horizontal 7 Tesla BioSpec MRI spectrometer (Brucker Instruments, Bellerica, MA) equipped with a 12 cm self-shielded gradient set (45 gauss/cm max). The radio frequency (rf) pulses were applied using a standard transmit/receive (Tx/Rx) volume coil (72 mm I.d.), actively decoupled from the two-channel Bruker quadrature receive coil positioned over the center line of the animal skull. Stereotaxic ear bars were used to minimize movement during the imaging procedure. Rat temperature was maintained at 37.4°C using a recirculating water bath. All MRI image sets were acquired with a 32×32 mm2 Field Of View (FOV). Animals were first located with the tumor center corresponding to the magnet center by a tri-planar Fast Low Angle Shot (FLASH) sequence. Subsequent scans acquired using T1-weighted (pre- and post-contrast), T2-weighted, spoiled gradient recalled (SPGR) echo with a variable flip angle and SPGR DCE-MRI scans to estimate Ktrans, kep, vp and ve. Pre- and -post contrast T1-weighted images were acquired in a spin-echo T1-weighted multi-slice sequence (TR/TE = 800/9 ms, 256×256 matrix, 10 slices (1.5 mm thick), number of summed acquisitions (NEX) = 4). Spin-echo T2 weighted images were obtained using standard two Dimensional Fourier transformation (2DFT) multi-slice (10 slices, 1.5 mm thickness) multi-echo sequence: TE/TR = 12, 24, 36, 48, 60, 72/3000, 256×256 matrix and NEX = 1. Prior to the DCE-MRI sequence, multi Flip Angle (FA) SPGR sequence was employed allowing a voxel-by-voxel estimation of T1 in the tissue pre Contrast Agent (CA) administration. Multi FA SPGR sequence parameters are as follows: Flip angles = 3, 5, 7, 12, 15, 25, 45 and 70°, matrix 128×128, ten 1.5 mm slices, TE/TR=3/100 ms. The DCE-MRI sequence was SPGRE sequence with the same geometry and timing but with a fixed flip angle of 35°, an acquisition of 90 image sets at 6 sec time intervals for a total run time of about 9 min. At image 6–7 of the SPGR sequence a bolus injection of the CA (Magnevist, Bayer Healthcare Pharmaceuticals, Wayne, New Jersey), 0.25 mmol kg−1 at undiluted concentration, no flush, was performed by hand push, followed by a slight draw back.
Pharmacokinetic analysis
Dynamic contrast-enhanced MR imaging was performed using a transverse T1W SPGR acquisition that consisted of obtaining pre-contrast (6–7 sequences) and dynamic post contrast images up to 9 min after the contrast injection. Dynamic contrast-enhanced MR images followed by extended Tofts model were used to estimate the transfer constants Ktrans and kep, plasma volume of tumor blood volume (vp) and interstitial space volume (ve) according to previous methods (Bagher-Ebadian et al., 2012; Ewing et al., 2006).
The Ktrans is the unidirectional transfer rate constant of the contrast from plasma across the vascular endothelium and Blood Brain Barrier (BBB) into the interstitial fluid. The kep is the reverse transfer rate constant from the extravascular compartment to the vascular compartment. The vp is the fractional volume of the contrast agent vascular distribution space, usually thought to be the plasma distribution space. If the trans-vascular transfer of the contrast agent is passive, the two rate constants are related via the interstitial space volume fraction: ve = Ktrans/kep. Our recent publication shows the validity of this method (Bagher-Ebadian et al., 2012). The Ktrans, kep, vp and ve of the tumors (both treated and control) were determined by drawing irregular Regions Of Interests (ROIs) encompassing the whole tumor. An investigator blinded to both treated and untreated animals drew the ROIs and determined the values.
Measurement of tumor volume
Post contrast T1-weighted images were used to determine the volume of the tumor in each animal. Two investigators blinded to the treatment groups determined the volume by drawing irregular ROIs around the tumor and multiplying the area with the slice thickness.
Histopathology
Animals used for the histology analysis were euthanized, perfused by intra-cardiac injection of 100 mL PBS, followed by 3% paraformaldehyde. Brains were collected and fixed in 3% paraformaldehyde containing 3% sucrose. Tissue sections were prepared from either frozen or paraffin preparations. Standard histochemical staining procedures were performed as recommended by the suppliers of primary antibodies. Our histochemical analysis concentrated on the markers of neovascularization, human specific cells and, marker of CD86 and CD163. Sections were stained to determine neovascularization by using von-Willebrand factor (vWF, Dako, USA), invasion of tumor cells by targeting human specific major histocompatibility complex-1 (MHC-1). To determine whether whole body irradiation can decrease or AMD3100 increase the migration of mononuclear cells (especially the macrophage population) in the tumors, Presence of M1 or M2 macrophage populations was determined by staining with either CD86 (for M1) or CD163 (for M2) antibodies, respectively.
Evaluation of micro-vessel density (MVD)
Micro-vessels were detected by immunohistochemical staining with vWF, which is well established for determining neovascularization in different lesions (Arbab et al., 2012; Christensen et al., 2010; Zhang et al., 2011). All images were visually compared to see the distribution patterns and vWF positive areas at the central and peripheral parts of the tumors. Each cell positive for vWF was considered to be a neo-vessel. Five “Hot spots” [area with highest vessel concentration] from each slide were identified, photomicrographed and vWF positive areas were measured by color thresholding method using ImageJ program. The total area of histology section viewed on microphotography was noted and MVD was calculated as previously described (Weidner et al., 1991). The vWF area was expressed as % total area of photomicrographs.
Tumor cell migration and invasion
The distance between the MHC-1 positive cells and the margin of the main tumor mass was evaluated using low, 4–10× image magnification. The tumor periphery was confirmed on high magnification before all measurements. An irregular line was drawn at the most peripheral part of the tumor that showed continuation to the primary tumor mass. Any MHC-1 positive cells away from the drawn line were considered invasive cells away from the primary tumor mass. A perpendicular line was drawn from the invasive tumor cells or tumor foci (center of the foci) to the drawn line at the tumor periphery and the distance was noted. Distance from migrated individual cell or distal tumor foci to the periphery of the primary tumor mass were determined and the average values were calculated. The analysis was done using the software supplied by the vendor (Troup View Software, Irvine, CA). The average distance between the MHC-1 positive cells and the tumor margin was determined for vatalanib and vehicle treated animals in each groups. The analysis was done according to our published method (Ali et al., 2013).
M1 and M2 cells
To determine the BMDCs as well as tumor associated macrophages, CD45 and CD68 staining were performed. Sections were also stained for the presence of M1 (CD86) and M2 (CD163) macrophages. Five “Hot spots” [area with highest positive cells] from each slide were identified; photomicrographed.
Statistical analysis
Comparison between drug and vehicle treated groups was done by using one way ANOVA with PLSD Post hoc test. All data are expressed as Mean±Standard Error of Mean (SEM) unless otherwise stated. Any p-value of <0.05 was considered statistically significant.
RESULTS
Myeloablation
Figure 1 shows decrease of CD45+, hematopoietic stem cells (CD90 for rat) and myeloid lineage (OX-82 for rat) in the peripheral blood of rats by day 14 that received whole body irradiation. It was expected that by reducing BMDCs to be released in the peripheral blood, there will be less bone marrow cells migrated to the tumor following AAT (vatalanib treatment) and the tumor growth will be inhibited following vatalanib administration. All nine animals were followed for five different days (days 0, 2, 7, 14 and 21) and longitudinal data from each animal are show separately. Animals underwent whole body irradiation of 6Gy and followed until day 21. During follow up peripheral blood (PBMC) was collected just before irradiation and on days 2 (D2), 7 (D7), 14 (D14) and 21 (D21). Most of the cell types went down significant on day 14. Each graph represents one time point from one sample. To show the similarity in each animal the data were not combined (Fig. 1).
Fig. 1.

(a–c): Depletion of bone marrow derived cells by whole body irradiation. Distribution of different cells types, (a) Common leukocytes (CD45), (b) Rat hematopoietic stem cells (CD90) and (c) Myeloid lineage (OX82) in PBMC was assessed using flow cytometer
Tumor volume
Tumor volume measurement from post contrast T1WI MR Images showed significantly (p<0.01) increased tumor growth in control group of animals following the treatment of vatalanib (Fig. 2a). The previous publications explained the increased growth following vatalanib treatment due to activation of alterative pathways of neovascularization and, mobilization and accumulation of BMDCs in the glioma (Ali et al., 2010, 2013). Based on the findings it was hypothesized that decreasing the availability of BMDCs and preventing the interaction of BMDCs to SDF-1α would prevent the detrimental effect of vatalanib. Results from the tumor volume measurements proved our hypothesis that decreasing the availability of BMDCs in the peripheral blood (Fig. 1) using whole body sub-lethal irradiation prevented the tumor growth following the use of vatalanib in the irradiated animals compared to the corresponding vehicle treated animals (Fig. 2a and b). In control group of animal vatalanib treatment increased the tumor growth significantly compared to that of vehicle treatment (vehicle 123.41±22.26 mm3 vs vatalanib 331.24±64.93 mm3) but by preventing the mobilization of BMDCs using WBIR (170.72±56.19 vs 152.80±34.57 mm3) paradoxical growth of tumor was controlled. However, there was no change in the tumor volume in vehicle treated animals (whole body irradiation plus vehicle) between control and irradiated groups (123.41±22.26 vs 170.72±56.19 mm3) (Fig. 2a and b). Similarly, when the interaction of BMDCs with tumor cell secreted SDF-1α using AMD3100 (CXCR4 antagonist) was blocked; it prevented the tumor growth following the use of vatalanib compared to the corresponding vehicle treated animals (165.91±32.73 vs 169.49±15.33 mm3). However, AMD3100 itself (AMD3100 plus vehicle) could not decrease the tumor growth when compared with vehicle treated animals in control groups (123.41±22.26 vs 165.91±32.73 mm3) (Fig. 2a and b).
Fig. 2.
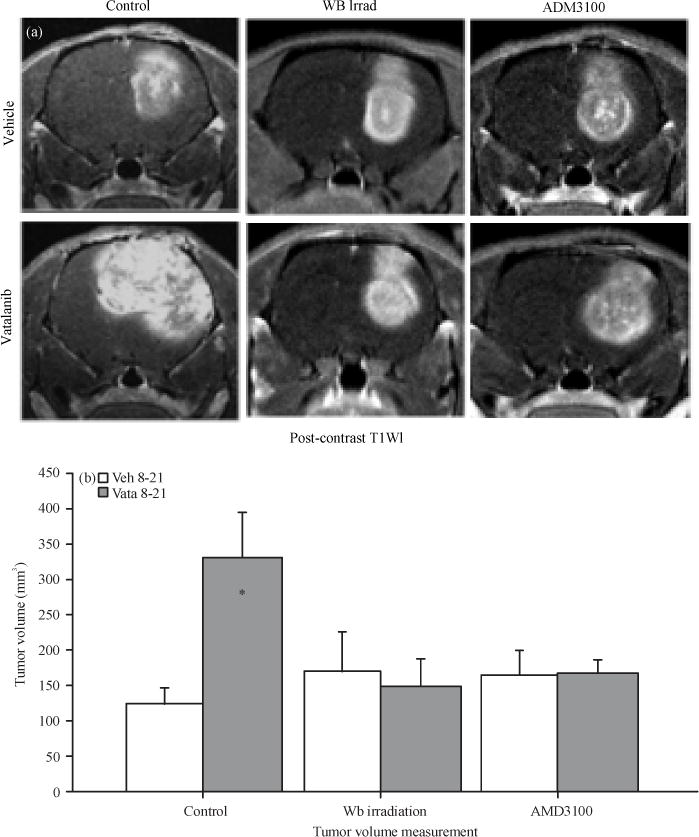
(a–b): Representative MR Images and tumor volume. All animals underwent MR imaging at the end of the studies. Representative MR Images, (a) From control, Whole Body irradiated (WB irrad) and CXCR4 antagonist (AMD3100) pretreated animals show changes following administration of vatalanib and (b) Vatalanib treatment in control animals significantly increased tumor volume* = p<0.05
Vascular parameters
Measurement of different vascular parameters derived from DCE MRI showed the status of tumor vascularity, vascular permeability and extravascular extra cellular space volume following vatalanib treatment in different pre-conditioned groups of animals (control, irradiated and AMD3100). In control group of animals, vatalanib treated caused borderline significant increase in vascular permeability (forward transfer constant, Ktrans) compared to the corresponding vehicle treated animals (0.013±.003 vs 0.019±.003 sec−1). Vatalanib treatment also significantly increased the extravascular extracellular space (ve) in control group of animals (0.027±.006 vs 0.053±.011 mg min−1). These effects were changed when the animals were pre-conditioned with whole body irradiation or administration of AMD3100 before the use of vatalanib (Fig. 3). Figure 3 shows that WB irradiation and AMD3100 pretreatment normalized permeability and Ve to that of vehicle treated animals. Data are expressed in Mean±SEM.
Fig. 3.
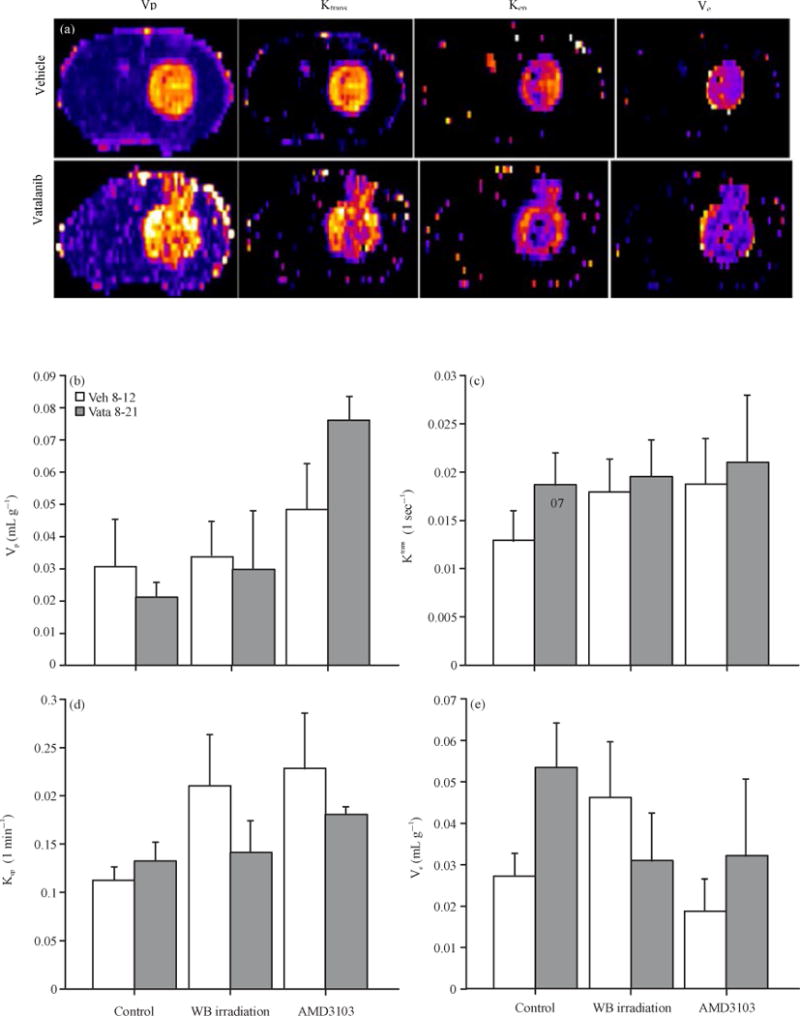
(a–e): Representative vascular parametric images from vehicle and vatalanib treated animals in control group and quantitative analysis. All animals underwent MR imaging at the end of the studies, (a) Representative vascular parametric images from vehicle and vatalanib treated animals in control group show relative changes in the permeabilities (Ktrans and kep) and extravascular extracellular space volume (ve). Note the increase permeabilities at the periphery of the tumor following vatalanib treatments. Quantitative analysis shows no significant differences in (b) Vp, (c) kep, (d) Borderline significant (p = 0.07) increased and (e) Ktrans and significantly (*p<0.05) increased ve in vatalanib treated animals in control group
Tumor neovascularization
Status of neovascularization following treatments in different groups of animals was assessed by histochemical staining of vWF (neovessels). There was no difference in the distribution of neovascularization and vWF positive areas in control group between vehicle and vatalanib treated animals (4.82±0.9 vs 3.11±0.29%). In both WBIR and AMD3100 groups, vatalanib treated animals showed increased vWF positive areas compared to corresponding vehicle treated animals (WBIR: 6.60±2.36 vs 12.46±5.45%, AMD3100: 10.43±1.03 vs 16.65±0.61%). However, significant difference was observed only in AMD3100 group (p<0.01). When compared the vehicle treated animals, only AMD3100 group showed significantly higher percent of vWF positive areas (p<0.01) compared to that of control. Following vatalanib treatment both WBIR and AMD3100 groups showed significantly higher vWF positive areas (p<0.05) compared to that of control group. Both whole body irradiation and AMD3100 treated animals showed well defined vascularization in the tumors, especially at the peripheral part (Fig. 4).
Fig. 4.
Neovascularization depicted by vWF staining
Invasion of tumor cells
Human U-251 cells were implanted in nude rats. To determine human cells in rats, MHC-1 or HLA-A marker was used, which is specific for human cells. MHC-1 positive cells will indicate the human cells in rat brain. Measurement of the distance traveled by the MHC-1 positive cells from the periphery of the primary tumor mass will indicate the invasion or migration of U-251 cells following different treatments. As shown in our previously study vatalanib treatment in control group of animals decreased the cell migration significantly (vehicle 284.15±18.58 μm vs vatalanib 223.48±13.80 μm) (Ali et al., 2013). On the other hand AMD3100 treated group of animals showed significantly increased migration of cells following administration of vatalanib (vehicle 165.25±9.38 μm vs vatalanib 235.75±20.44 μm) (Fig. 5, arrows). Neither vehicle nor vatalanib treated animals in whole body irradiated group of animals showed increased migration of cells (vehicle 205.26±19.02 μm vs vatalanib 223.28±17.84 μm). Data are expressed in Mean±SEM.
Fig. 5.
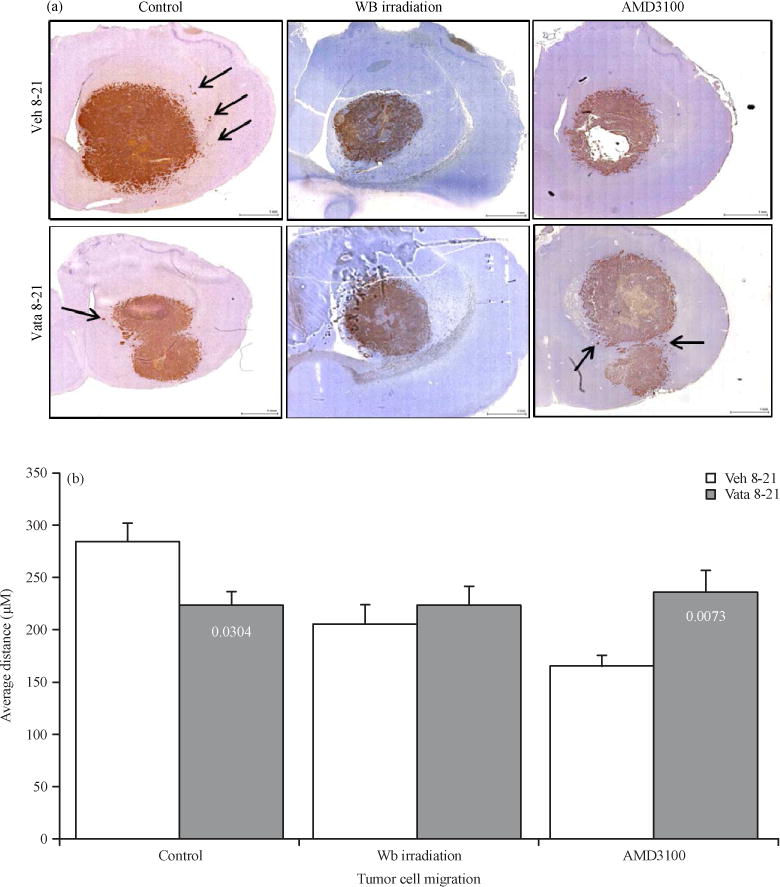
(a–b): Representative IHC images and quantitative analysis showing tumor cell migration, (a) MHC-1 marker was stained to determine the human cells in rat brain, measurement of the distance traveled by the MHC-1 positive cells from the periphery of the primary tumor mass indicates the invasion or migration of U-251 cells following different treatments and (b) Quantitative analysis of the migration of tumor cells
Tumor associated macrophages
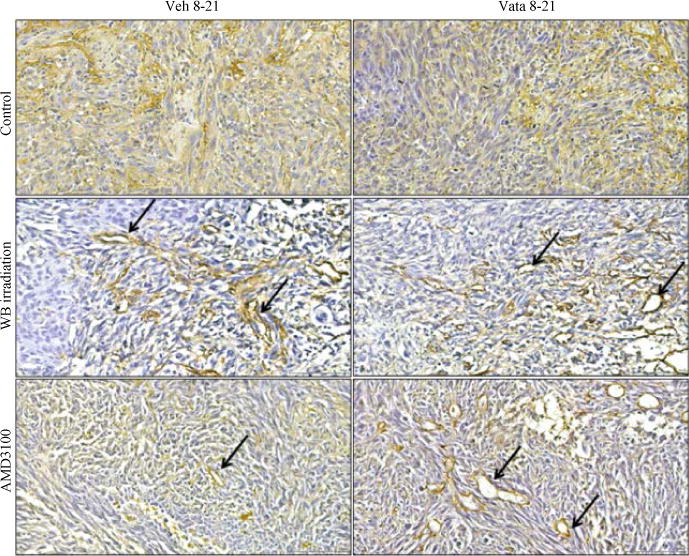
Due to manipulation of bone marrow cells (myeloablation to decrease and AMD3100 to mobilize) it was expected differential accumulation of BMDCs cells in the tumor. It was also expected difference in the number of tumor associated macrophages and the population of MI (CD86) vs M2 (CD163). These markers have been used to differentiate two populations (David et al., 2015; Mellins et al., 2011). As expected pre-treatment with AMD3100 increased the accumulation of both M1 and M2 populations in the tumors both in vehicle and vatalanib treated groups (Fig. 6). Vatalanib treatment showed robust accumulation of M1 cells in the tumor compared to that of corresponding vehicle treated group (brown cells). Both the control and whole body irradiated groups did not show increased accumulation of either M1 or M2 cells following vatalanib treatment.
Fig. 6.
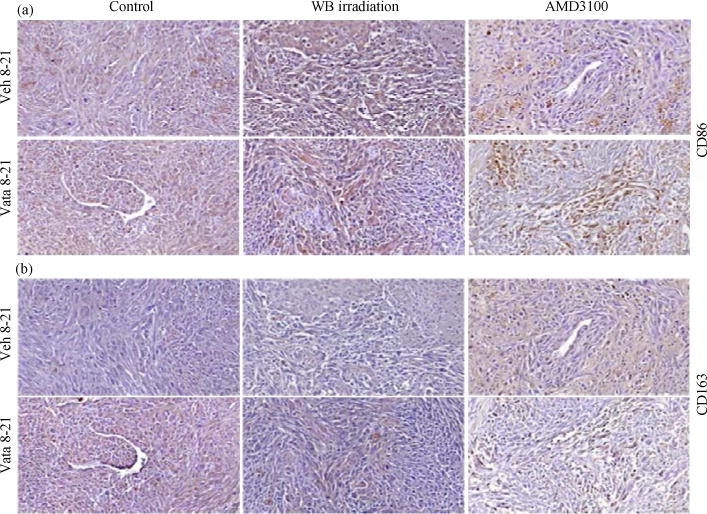
(a–b): Representative IHC images showing accumulation of M1 and M2 macrophage populations in tumor. At the end of the studies brains with tumors were collected, fixed and paraffin sections were made for immunohistochemical analysis, (a) CD 86 and (b) CD163 markers were stained to determine the M1 and M2 macrophage populations, respectively
DISCUSSION
Due to hypervascular nature of GBM, antiangiogenic agents targeting VEGF-VEGFR pathways have been used as first line of treatment or as adjuvants along with chemotherapy and radiotherapy (Gerstner et al., 2011; Los et al., 2007; Reardon et al., 2009; Venur et al., 2015). However, both clinical and pre-clinical studies indicated varying degree of successes with progression of tumor on extended use (Ali et al., 2010, 2013; Bergers and Hanahan, 2008; Norden et al., 2008; Paez-Ribes et al., 2009). Explanation for the failure of these antiangiogenic agents is that AAT caused marked hypoxia due destruction of blood vessels followed by activation of alterative pathways of neovascularization and enhance mobilization of BMPCs. Similar phenomenon was also noticed in previous pre-clinical model, where vatalanib was used and causing activation of alternative pathways of neovascularization and enhanced both angiogenesis and vasculogenesis in a rat model of human GBM (Ali et al., 2010, 2013). Moreover, our chimeric mice model showed increased accumulation of bone marrow derived cells in the GBM treated with vatalanib (Achyut et al., 2015). Similar to previous findings and reports, current study also indicated GBM resistant to vatalanib treatment (in control group) causing increased tumor volume compared to that of vehicle treated GBM (Ali et al., 2010, 2013). Based on the previous findings and the above discussion, it can be interpreted that GBM resistant to vatalanib treatment might be due to activation of alternative pathways of neovascularization and mobilization of BMDCs to the sites of tumor. Further experiments in this study using whole body radiation to decrease the available BMDCs and using CXCR4 antagonist to prevent the interaction between BMDCs and SDF-1α also proved that BMDCs might be responsible for the GBM resistance to vatalanib treatment in control groups. When whole body irradiation or AMD3100 was used prior to vatalanib treatment, there was no increase in the tumor growth compared to that of corresponding vehicle treated animals. Whole body irradiation to control tumor growth is not a new idea but investigator was not aware of the activation of alternative pathways of neovascularization and mobilization of BMDCs to tumor following antiangiogenic treatments. Our data showed decreased level of BMDCs in the peripheral blood on day 14 following whole body irradiation, which might cause unavailable BMDCs to accumulate in the tumor following vatalanib and prevented resistance to the treatment (tumor growth). On the other hands, Kioi et al. (2010) has proposed low dose of CXCR4 antagonist would prevent the interaction of BMDCs (CXCR4+cells) and SDF-1α at the tumor sites and prevent formation of neovascularization and tumor growth. Similar to our previous report, current study also did not show increased tumor growth following AMD3100 treatment (vehicle treated animal in AMD3100 group) even after adding vatalanib (Ali et al., 2013). Therefore, preventing the interaction of CXCR4 and SDF-1α may be an effective way of interfering neovascularization (especially vasculogenesis), although our published data indicated increased accumulation of BMDCs in the tumor following AMD3100 treatment (Achyut et al., 2015) and there were increased vWF positive areas in tumors treated with vatalanib both in WBIR and ADM3100 groups in the current studies.
Vascular parametric analysis based on in vivo imaging such as MRI or CT is being used in preclinical and clinical practices, especially for GBM. With the three compartmental model, as done in our study, tumor blood volume (or plasma volume, Vp), forward transfer constant (or forward permeability, Ktrans), backward transfer constant (or backflow, Kb) and extravascular extracellular space volume (Ve) can be determined with confidence (Aryal et al., 2014; Bagher-Ebadian et al., 2012; Chwang et al., 2014; Ewing and Bagher-Ebadian, 2013). Tumor may show increased blood volume if there is slow flow or increased blood pool. The Ktrans indicates permeability, which is also indicative of neovascularization and is seen in hypervascular tumors such as GBM or breast cancer (Ewing and Bagher-Ebadian, 2013; Li et al., 2015a, b). High Ktrans is seen mostly at invasive margin of the tumors where most of the neovascularization is observed. Similar to Ktrans, increased kep is also seen at the invasive front of the tumors. The kep is dependent on the extravascular extracellular space as well as oncotic pressure. However, in case there is more protein in extravascular extracellular space, kep will be reduced and ve will be increased (McDonald and Levick, 1993). Similar to our previously published reports, vatalanib treated animals in control group showed borderline significantly increased Ktrans (p = 0.07, NS) and significantly increased ve compared to that of corresponding vehicle treated animals (Ali et al., 2013). As shown in our previous as well as in current studies, vatalanib caused increased vascularization at the invasive margin of the GBM in control animals. Interesting findings in the current studies are that whole body irradiation or treatment with AMD3100 created well-defined vascularization even after vatalanib treatment, which could be the reason for not increasing the transfer constants such as Ktrans, kep and ve.
Tumor microenvironment could be one of the major determinants for tumor invasion and change of phenotypes (Tredan et al., 2015; Vitale et al., 2014; Weiss et al., 2014; Xu et al., 2014). Our recent publication showed the phenotypical changes of the accumulated BMDCs in the tumors and there were changes in the phenotypes of the tumor cells (Achyut et al., 2015). In this study, one of the purposes is to determine whether BMDCs has any effect on the tumor cell migration or whether M1 or M2 population could be related to the increase tumor cells migration. As expected based on our previous publications, vatalanib did not increase cell migration in control and whole body irradiated groups. On the other hand, AMD3100 treated animals showed increased accumulation of M1 and M2 population in the tumor and there was increased cell migration following vatalanib treatment compared to that of corresponding vehicle treated animals. Exact mechanisms of increased cell migration and relation with M1 or M2 population is beyond the scope of this study, however, our unpublished data from chimeric animals showed influence of myeloid cells on the phenotypes of tumors (EMT), which could make tumor cells more motile and invasive, which is also supported by other investigators (Bae et al., 2015; Mego et al., 2015; Wu et al., 2015).
CONCLUSION
In conclusion, our study investigated that BMDCs are responsible for causing drug resistance to vatalanib treatment in rat model of glioma. Blocking the interaction of CXCR4 positive BMDCs with SDF-1 in tumor or depleting bone marrow cells can attenuate the detrimental effect of vatalanib. The MRI and vascular parametric analysis predicted the effects of vatalanib and showed improvement of permeability following AMD3100 or whole body irradiation therapies.
Acknowledgments
The study are supported by the grants from the National Institutes of Health, National Cancer Institute (R01CA160126 and R01CA172048) and GRU cancer center startup funds.
Footnotes
Competing Interest: The authors have declared that no competing interest exists.
Data Availability: All relevant data are within the paper and its supporting information files.
References
- Achyut BR, Shankar A, Iskander AS, Ara R, Angara K, et al. Bone marrow derived myeloid cells orchestrate antiangiogenic resistance in glioblastoma through coordinated molecular networks. Cancer Lett. 2015;369:416–426. doi: 10.1016/j.canlet.2015.09.004. [DOI] [PMC free article] [PubMed] [Google Scholar]
- Ali MM, Janic B, Babajani-Feremi A, Varma NRS, Iskander ASM, Anagli J, Arbab AS. Changes in vascular permeability and expression of different angiogenic factors following anti-angiogenic treatment in rat glioma. PLoS One. 2010;5 doi: 10.1371/journal.pone.0008727. [DOI] [PMC free article] [PubMed] [Google Scholar]
- Ali MM, Kumar S, Shankar A, Varma NRS, Iskander ASM, et al. Effects of tyrosine kinase inhibitors and CXCR4 antagonist on tumor growth and angiogenesis in rat glioma model: MRI and protein analysis study. Trans Oncol. 2013;6:660–669. doi: 10.1593/tlo.13559. [DOI] [PMC free article] [PubMed] [Google Scholar]
- Andrade J, Ge S, Symbatyan G, Rosol MS, Olch AJ, Crooks GM. Effects of sublethal irradiation on patterns of engraftment after murine bone marrow transplantation. Biol Blood Marrow Transplant. 2011;17:608–619. doi: 10.1016/j.bbmt.2010.12.697. [DOI] [PMC free article] [PubMed] [Google Scholar]
- Arbab AS, Janic B, Knight RA, Anderson SA, Pawelczyk E, et al. Detection of migration of locally implanted AC133+ stem cells by cellular magnetic resonance imaging with histological findings. FASEB J. 2008;22:3234–3246. doi: 10.1096/fj.07-105676. [DOI] [PMC free article] [PubMed] [Google Scholar]
- Arbab AS, Thiffault C, Navia B, Victor SJ, Hong K, et al. Tracking of In-111-labeled human umbilical tissue-derived cells (hUTC) in a rat model of cerebral ischemia using SPECT imaging. BMC Med Imag. 2012;12 doi: 10.1186/1471-2342-12-33. [DOI] [PMC free article] [PubMed] [Google Scholar]
- Aryal MP, Nagaraja TN, Keenan KA, Bagher-Ebadian H, Panda S, et al. Dynamic contrast enhanced MRI parameters and tumor cellularity in a rat model of cerebral glioma at 7 T. Magn Reson Med. 2014;71:2206–2214. doi: 10.1002/mrm.24873. [DOI] [PMC free article] [PubMed] [Google Scholar]
- Bae SY, Kim HJ, Lee KJ, Lee K. Translationally controlled tumor protein induces epithelial to mesenchymal transition and promotes cell migration, invasion and metastasis. Sci Rep. 2015;5 doi: 10.1038/srep08061. [DOI] [PMC free article] [PubMed] [Google Scholar]
- Bagher-Ebadian H, Jain R, Nejad-Davarani SP, Mikkelsen T, Lu M, et al. Model selection for DCE-T1 studies in glioblastoma. Magnet Reson Med. 2012;68:241–251. doi: 10.1002/mrm.23211. [DOI] [PMC free article] [PubMed] [Google Scholar]
- Barrett AJ, Humble JG, Hobbs JR. Bone marrow suppression by antilymphocytic globulin. Br Med J. 1975;2 doi: 10.1136/bmj.2.5970.541. [DOI] [PMC free article] [PubMed] [Google Scholar]
- Batchelor TT, Sorensen AG, di Tomaso E, Zhang WT, Duda DG, et al. AZD2171, a pan-VEGF receptor tyrosine kinase inhibitor, normalizes tumor vasculature and alleviates edema in glioblastoma patients. Cancer Cell. 2007;11:83–95. doi: 10.1016/j.ccr.2006.11.021. [DOI] [PMC free article] [PubMed] [Google Scholar]
- Bergers G, Hanahan D. Modes of resistance to anti-angiogenic therapy. Nature Rev Cancer. 2008;8:592–603. doi: 10.1038/nrc2442. [DOI] [PMC free article] [PubMed] [Google Scholar]
- Ceradini DJ, Kulkarni AR, Callaghan MJ, Tepper OM, Bastidas N, et al. Progenitor cell trafficking is regulated by hypoxic gradients through HIF-1 induction of SDF-1. Nat Med. 2004;10:858–864. doi: 10.1038/nm1075. [DOI] [PubMed] [Google Scholar]
- Christensen K, Aaberg-Jessen C, Andersen C, Goplen D, Bjerkvig R, Kristensen BW. Immunohistochemical expression of stem cell, endothelial cell and chemosensitivity markers in primary glioma spheroids cultured in serum-containing and serum-free medium. Neurosurgery. 2010;66:933–947. doi: 10.1227/01.NEU.0000368393.45935.46. [DOI] [PubMed] [Google Scholar]
- Chwang WB, Jain R, Bagher-Ebadian H, Nejad-Davarani SP, Iskander AS, et al. Measurement of rat brain tumor kinetics using an intravascular MR contrast agent and DCE-MRI nested model selection. J Magn Reson Imag. 2014;40:1223–1229. doi: 10.1002/jmri.24469. [DOI] [PMC free article] [PubMed] [Google Scholar]
- David S, Greenhalgh AD, Kroner A. Macrophage and microglial plasticity in the injured spinal cord. Neuroscience. 2015;307:311–318. doi: 10.1016/j.neuroscience.2015.08.064. [DOI] [PubMed] [Google Scholar]
- Ewing JR, Brown SL, Lu M, Panda S, Ding G, et al. Model selection in magnetic resonance imaging measurements of vascular permeability: Gadomer in a 9L model of rat cerebral tumor. J Cereb Blood Flow Metabol. 2006;26:310–320. doi: 10.1038/sj.jcbfm.9600189. [DOI] [PubMed] [Google Scholar]
- Ewing JR, Bagher-Ebadian H. Model selection in measures of vascular parameters using dynamic contrast-enhanced MRI: Experimental and clinical applications. NMR Biomed. 2013;26:1028–1041. doi: 10.1002/nbm.2996. [DOI] [PMC free article] [PubMed] [Google Scholar]
- Ferrara N, Hillan KJ, Novotny W. Bevacizumab (Avastin), a humanized anti-VEGF monoclonal antibody for cancer therapy. Biochem Biophys Res Commun. 2005;333:328–335. doi: 10.1016/j.bbrc.2005.05.132. [DOI] [PubMed] [Google Scholar]
- Garg S, Boerma M, Wang J, Fu Q, Loose DS, Kumar KS, Hauer-Jensen M. Influence of sublethal total-body irradiation on immune cell populations in the intestinal mucosa. Radiat Res. 2010;173:469–478. doi: 10.1667/RR1742.1. [DOI] [PMC free article] [PubMed] [Google Scholar]
- Gerstner ER, Duda DG, di Tomaso E, Sorensen G, Jain RK, Batchelor TT. Antiangiogenic agents for the treatment of glioblastoma. Expert Opin Invest Drugs. 2007;16:1895–1908. doi: 10.1517/13543784.16.12.1895. [DOI] [PubMed] [Google Scholar]
- Gerstner ER, Eichler AF, Plotkin SR, Drappatz J, Doyle CL, et al. Phase I trial with biomarker studies of vatalanib (PTK787) in patients with newly diagnosed glioblastoma treated with enzyme inducing anti-epileptic drugs and standard radiation and temozolomide. J Neurooncol. 2011;103:325–332. doi: 10.1007/s11060-010-0390-7. [DOI] [PMC free article] [PubMed] [Google Scholar]
- Goldschmidt H, Hegenbart U, Wallmeier M, Hohaus S, Engenhart R, Wannenmacher M, Haas R. Peripheral blood progenitor cell transplantation in multiple myeloma following high-dose melphalan-based therapy. Recent Results Cancer Res. 1998;144:27–35. doi: 10.1007/978-3-642-46836-0_4. [DOI] [PubMed] [Google Scholar]
- Heissig B, Hattori K, Dias S, Friedrich M, Ferris B, et al. Recruitment of stem and progenitor cells from the bone marrow niche requires MMP-9 mediated release of kit-ligand. Cell. 2002;109:625–637. doi: 10.1016/s0092-8674(02)00754-7. [DOI] [PMC free article] [PubMed] [Google Scholar]
- Janic B, Arbab AS. Cord blood endothelial progenitor cells as therapeutic and imaging probes. Imag Med. 2012;4:477–490. doi: 10.2217/iim.12.35. [DOI] [PMC free article] [PubMed] [Google Scholar]
- Kallmeyer C, Wallmeier M, Kiel K, Moos M, Hegenbart U, Haas R, Goldschmidt H. Decreased numbers of circulating B cells in myeloma patients with reduction after conventional chemotherapy. Am J Hematol. 1998;57:287–292. doi: 10.1002/(sici)1096-8652(199804)57:4<287::aid-ajh4>3.0.co;2-q. [DOI] [PubMed] [Google Scholar]
- Kioi M, Vogel H, Schultz G, Hoffman RM, Harsh GR, Brown JM. Inhibition of vasculogenesis but not angiogenesis, prevents the recurrence of glioblastoma after irradiation in mice. J Clin Invest. 2010;120:694–705. doi: 10.1172/JCI40283. [DOI] [PMC free article] [PubMed] [Google Scholar]
- Kishi T, Fujita N, Kawaguchi H, Ishimae M, Watanabe K, Tanaka T. Bone marrow suppression induced by high dose valproic acid. Arch Dis Child. 1994;71:153–155. doi: 10.1136/adc.71.2.153. [DOI] [PMC free article] [PubMed] [Google Scholar]
- Kumar S, Arbab AS, Jain R, Kim J, de Carvalho AC, et al. Development of a novel animal model to differentiate radiation necrosis from tumor recurrence. J Neurooncol. 2012;108:411–420. doi: 10.1007/s11060-012-0846-z. [DOI] [PMC free article] [PubMed] [Google Scholar]
- Li L, Wang K, Sun X, Wang K, Sun Y, Zhang G, Shen B. Parameters of dynamic contrast-enhanced MRI as imaging markers for angiogenesis and proliferation in human breast cancer. Med Sci Monit. 2015a;21:376–382. doi: 10.12659/MSM.892534. [DOI] [PMC free article] [PubMed] [Google Scholar]
- Li X, Zhu Y, Kang H, Zhang Y, Liang H, Wang S, Zhang W. Glioma grading by microvascular permeability parameters derived from dynamic contrast-enhanced MRI and intratumoral susceptibility signal on susceptibility weighted imaging. Cancer Imaging. 2015b;15 doi: 10.1186/s40644-015-0039-z. [DOI] [PMC free article] [PubMed] [Google Scholar]
- Los M, Roodhart JM, Voest EE. Target practice: Lessons from phase III trials with bevacizumab and vatalanib in the treatment of advanced colorectal cancer. Oncologist. 2007;12:443–450. doi: 10.1634/theoncologist.12-4-443. [DOI] [PubMed] [Google Scholar]
- Ma J, Urba WJ, Si L, Wang Y, Fox BA, Hu HM. Anti-tumor T cell response and protective immunity in mice that received sublethal irradiation and immune reconstitution. Eur J Immunol. 2003;33:2123–2132. doi: 10.1002/eji.200324034. [DOI] [PubMed] [Google Scholar]
- Madonna GS, Ledney GD, Moore MM, Elliott TB, Brook I. Treatment of mice with sepsis following irradiation and trauma with antibiotics and synthetic trehalose dicorynomycolate (S-TDCM) J Trauma. 1991;31:316–325. doi: 10.1097/00005373-199103000-00003. [DOI] [PubMed] [Google Scholar]
- McDonald JN, Levick JR. Effect of extravascular plasma protein on pressure-flow relations across synovium in anaesthetized rabbits. J Physiol. 1993;465:539–559. doi: 10.1113/jphysiol.1993.sp019692. [DOI] [PMC free article] [PubMed] [Google Scholar]
- Mego M, Cierna Z, Janega P, Karaba M, Minarik G, et al. Relationship between circulating tumor cells and epithelial to mesenchymal transition in early breast cancer. BMC Cancer. 2015;15 doi: 10.1186/s12885-015-1548-7. [DOI] [PMC free article] [PubMed] [Google Scholar]
- Mellins ED, Macaubas C, Grom AA. Pathogenesis of systemic juvenile idiopathic arthritis: Some answers, more questions. Nat Rev Rheumatol. 2011;7:416–426. doi: 10.1038/nrrheum.2011.68. [DOI] [PMC free article] [PubMed] [Google Scholar]
- Moore MAS, Hattori K, Heissig B, Shieh JH, Dias S, Crystal RG, Rafii S. Mobilization of endothelial and hematopoietic stem and progenitor cells by adenovector-mediated elevation of serum levels of SDF-1, VEGF and angiopoietin-1. Ann N Y Acad Sci. 2001;938:36–47. doi: 10.1111/j.1749-6632.2001.tb03572.x. [DOI] [PubMed] [Google Scholar]
- Norden AD, Drappatz J, Wen PY. Antiangiogenic therapy in malignant gliomas. Curr Opin Oncol. 2008;20:652–661. doi: 10.1097/CCO.0b013e32831186ba. [DOI] [PubMed] [Google Scholar]
- Paez-Ribes M, Allen E, Hudock J, Takeda T, Okuyama H, et al. Antiangiogenic therapy elicits malignant progression of tumors to increased local invasion and distant metastasis. Cancer Cell. 2009;15:220–231. doi: 10.1016/j.ccr.2009.01.027. [DOI] [PMC free article] [PubMed] [Google Scholar]
- Reardon DA, Wen PY, Desjardins A, Batchelor TT, Vredenburgh JJ. Glioblastoma multiforme: An emerging paradigm of anti-VEGF therapy. Expert Opin Biol Ther. 2008;8:541–553. doi: 10.1517/14712598.8.4.541. [DOI] [PMC free article] [PubMed] [Google Scholar]
- Reardon DA, Egorin MJ, Desjardins A, Vredenburgh JJ, Beumer JH, et al. Phase I pharmacokinetic study of the vascular endothelial growth factor receptor tyrosine kinase inhibitor vatalanib (PTK787) plus imatinib and hydroxyurea for malignant glioma. Cancer. 2009;115:2188–2198. doi: 10.1002/cncr.24213. [DOI] [PMC free article] [PubMed] [Google Scholar]
- Rovere RK. Bevacizumab as second-line treatment of glioblastoma-worth the effort? Klin Onkol. 2014;27:219–220. [PubMed] [Google Scholar]
- Smith FR, Boots M. Sodium valproate and bone marrow suppression. Ann Neurol. 1980;8:197–199. doi: 10.1002/ana.410080213. [DOI] [PubMed] [Google Scholar]
- Tredan O, Lacroix-Triki M, Guiu S, Mouret-Reynier MA, Barriere J, et al. Angiogenesis and tumor microenvironment: bevacizumab in the breast cancer model. Target Oncol. 2015;10:189–198. doi: 10.1007/s11523-014-0334-9. [DOI] [PubMed] [Google Scholar]
- Venur VA, Peereboom DM, Ahluwalia MS. Current medical treatment of glioblastoma. Cancer Treat Res. 2015;163:103–115. doi: 10.1007/978-3-319-12048-5_7. [DOI] [PubMed] [Google Scholar]
- Vitale M, Cantoni C, Pietra G, Mingari MC, Moretta L. Effect of tumor cells and tumor microenvironment on NK cell function. Eur J Immunol. 2014;44:1582–1592. doi: 10.1002/eji.201344272. [DOI] [PubMed] [Google Scholar]
- Weidner N, Semple JP, Welch WR, Folkman J. Tumor angiogenesis and metastasis-correlation in invasive breast carcinoma. N Engl J Med. 1991;324:1–8. doi: 10.1056/NEJM199101033240101. [DOI] [PubMed] [Google Scholar]
- Weiss JM, Subleski JJ, Back T, Chen X, Watkins SK, et al. Regulatory T cells and myeloid-derived suppressor cells in the tumor microenvironment undergo fasdependent cell death during IL-2/αCD40 therapy. J Immunol. 2014;192:5821–5829. doi: 10.4049/jimmunol.1400404. [DOI] [PMC free article] [PubMed] [Google Scholar]
- Wu S, Liu S, Liu Z, Huang J, Pu X, et al. Classification of circulating tumor cells by epithelial-mesenchymal transition markers. PLoS One. 2015;10 doi: 10.1371/journal.pone.0123976. [DOI] [PMC free article] [PubMed] [Google Scholar]
- Xu W, Jiang H, Gao J, Zhao Y. The upregulation of immune checkpoint ligand PD-L1 in tumour microenvironment. Scand J Immunol. 2014;80:71–72. doi: 10.1111/sji.12177. [DOI] [PubMed] [Google Scholar]
- Zhang L, Li Y, Zhang C, Chopp M, Gosiewska A, Hong K. Delayed administration of human umbilical tissue-derived cells improved neurological functional recovery in a rodent model of focal ischemia. Stroke. 2011;42:1437–1444. doi: 10.1161/STROKEAHA.110.593129. [DOI] [PubMed] [Google Scholar]