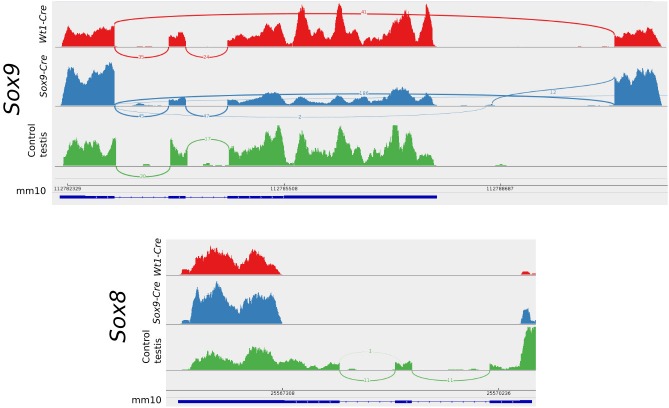
Figure 9. Sashimi plots of the Sox9 and Sox8 genes in mutant and control conditions.
Vertical lines indicate coverage and curved lines indicate splicing. The mm10 row shows the positions of the exons and introns and the translated region as annotated in the mm10 UCSC mouse genome. Aberrant splicing sites where found in mutant but not in control samples. Notice that normal splicing also occurred in mutant animals showing that CRE-recombination efficiency was not 100%.

