Abstract
Study Objectives:
We investigated the diagnostic accuracy for the identification of obstructive sleep apnea (OSA) and its severity of a noninvasive technology based on image processing (SleepWise).
Methods:
This is an observational, prospective study to evaluate the degree of agreement between polysomnography (PSG) and SleepWise. We recruited 56 consecutive subjects with suspected OSA who were referred as outpatients to the Sleep Unit of the Hospital Universitari Germans Trias i Pujol (HUGTiP) from January 2013 to January 2014. All patients underwent laboratory PSG and image processing with SleepWise simultaneously the same night. Both PSG and SleepWise analyses were carried independently and blindly.
Results:
We analyzed 50 of the 56 patients recruited. OSA was diagnosed through PSG in a total of 44 patients (88%) with a median apnea-hypopnea index (AHI) of 25.35 (24.9). According to SleepWise, 45 patients (90%) met the criteria for a diagnosis of OSA, with a median AHI of 22.8 (22.03). An analysis of the ability of PSG and SleepWise to classify patients by severity on the basis of their AHI shows that the two diagnostic systems distribute the different groups similarly. According to PSG, 23 patients (46%) had a diagnosis of severe OSA, 11 patients (22%) moderate OSA, and 10 patients (20%) mild OSA. According to SleepWise, 20, 13, and 12 patients (40%, 26%, and 24%, respectively) had a diagnosis of severe, moderate, and mild OSA respectively. For OSA diagnosis, SleepWise was found to have sensitivity of 100% and specificity of 83% in relation to PSG. The positive predictive value was 97% and the negative predictive value was 100%. The Bland-Altman plot comparing the mean AHI values obtained through PSG and SleepWise shows very good agreement between the two diagnostic techniques, with a bias of −3.85, a standard error of 12.18, and a confidence interval of −0.39 to −7.31.
Conclusions:
SleepWise was reasonably accurate for noninvasive and automatic diagnosis of OSA in outpatients. SleepWise determined the severity of OSA with high reliability. The current study including simultaneous laboratory PSG and SleepWise processing image is proposed as a reasonable validation standard.
Citation:
Abad J, Muñoz-Ferrer A, Cervantes MA, Esquinas C, Marin A, Martínez C, Morera J, Ruiz J. Automatic video analysis for obstructive sleep apnea diagnosis. SLEEP 2016;39(8):1507–1515.
Keywords: image processing, obstructive sleep apnea (OSA) diagnosis, respiratory movement monitoring
Significance.
In-laboratory polysomnography is the gold standard for the diagnosis of obstructive sleep apnea. This diagnostic procedure has some limits such as its cost, the need of special institutions and trained technicians for realization and the extensive instrumentation attached to the patient's body. We propose SleepWise as a noninvasive technology based on image processing, by recording the patient's respiratory movements to transform them into a breathing signal that can determine episodes of hypopnea and apnea. Its technology is based on the principle that the volume of air that circulates into the lungs is proportional to the movement that a patient presents while breathing. SleepWise can infer sleep/awake periods through the analysis of body movements.
INTRODUCTION
In-laboratory polysomnography (PSG) has been confirmed as the gold standard for the diagnosis of obstructive sleep apnea (OSA) since the advent of the field of the sleep medicine.1 However, this diagnostic procedure has some limits. First, PSG is relatively expensive because it requires special institutions and trained technicians.2 However, PSG records several variables including airflow, thoracic and abdominal movements, electroencephalography, electromyography, and oxygen saturation, which means extensive instrumentation attached to the patient's body. This situation may induce some changes in sleep, and can reduce the quality of sleep studies.3 These conditions, the high prevalence of OSA, and the great demand for examinations result in lack of timely access and long waiting lists.
In order to solve these problems, the sleep field is constantly considering innovative devices representing a simpler, less intrusive, and cost-effective way for the diagnosis of OSA. Home portable recording devices have been the first approach to develop the ambulatory detection of OSA in patients with a high pretest probability of moderate to severe OSA. This diagnostic method has proved capable of providing an equivalent diagnosis to in-laboratory PSG.4
With the rise of technology and innovation, many other sophisticated methods for the diagnosis of OSA are under development. In recent years, some devices using video recording and sophisticated software can characterize thoracic and abdominal movements during breathing to determine normal breathing or apneas and hyponeas.5–8 Load cells installed under the support of the bed, which combine detection of movement signals to create a breathing signal, have been an alternative to body-worn leads for the diagnosis of OSA.9 Actigraphy10 is a system that analyzes movements in order to identify sleep/ awake periods and has also been considered as an alternative method for the diagnosis of sleep disorders. Because snoring is a symptom that may indicate the presence of OSA, there are also several studies developing acoustic technology for the detection of post-apnea sounds and apnea periods from sleep sounds.11–13 NightShift uses both technologies, analysis of snoring intensity, and body movement not only for the diagnosis of OSA, but its vibration mode is used as a therapeutic method for positional OSA.14
We propose SleepWise as a noninvasive technology based on image processing, by recording the patient's respiratory movements to transform them into a breathing signal that can determine episodes of hypopnea and apnea. Its technology is based on the principle that the volume of air that circulates into the lungs is proportional to the movement that a patient presents while breathing. SleepWise can detect respiratory movements independently of the position and situation of the subject while sleeping. SleepWise can infer sleep/awake periods.
The aim of this work is to evaluate through a prospective study the effectiveness of SleepWise in the diagnosis of OSA and its severity compared with a simultaneous polysomno-graphic recording.
METHODS
Population of Study
This is a pilot, diagnostic accuracy study that included consecutively 56 patients with suspected OSA who had been referred as outpatients to the Sleep Unit of the Hospital Germans Trias i Pujol (HGTiP) from January 2013 to January 2014. Male and female patients older than 18 years were required to sign an informed consent form to participate in the study. OSA suspicion was based on clinical criteria such as usual snoring, witnessed apnea, and daytime sleepiness. Patients suffering from severe cardiovascular diseases, chronic renal failure, neoplasia, and psychiatric or neurological disorders were excluded. These patients were excluded in order to reduce as much as possible confounding factors that might hinder or interfere with the diagnosis of OSA.
The study was conducted according to the guidelines and principles of the Declaration of Helsinki and standard ethical conduct for research involving humans. The study was also guaranteed compliance at all times with Law 15/1999 on Protection of Personal Data (Spanish Government). The Ethics Committees for Clinical Research of the participating center approved this study.
Protocol
Sociodemographic (age, sex) and anthropometric data (weight, height, neck, hip and waist circumference), as well as sleep history and Epworth Sleepiness Scale score were collected.
We carried out our sleep studies overnight, using PSG and SleepWise simultaneously to ensure that both recordings covered exactly the same period. All patients who, according to PSG, slept for fewer than 4 h were excluded for the analysis. The polygraph's respiratory signal was read automatically, and a doctor specialized in sleep pathology corrected respiratory events manually. The updated AASM 2007 classification was used to identify stages of sleep.15 The SleepWise analysis was performed automatically.
Both the PSG and SleepWise analyses were carried out independently and blindly.
Relevant sleep variables were collected so the main outcome to compare both methods was AHI. Based on this, patients were classified as having mild OSA (5 ≥ AHI < 15), moderate OSA (15 ≥ AHI < 30) or severe OSA (AHI ≥ 30), with an AHI less than 5 being deemed normal.
Physiological Principles: Mechanics of Breathing
According to respiratory mechanics, the contraction of the diaphragm and chest muscles causes a negative intrapleural pressure that rushes air into the lungs. This air expands the lungs and increases the volume of the thoracic cavity. When intrapleural and atmospheric pressure equalized, the diaphragm and the intercostal muscles relax and return to their resting position. This reduces the size of the thoracic cavity, thereby increasing the intrapleural pressure and forcing air out of the lungs.16,17
The increase or decrease in the volume of the thoracic cavity implies chest movement. The amplitude of the movement is proportional to the air flowing into the lungs.
In normal tidal breathing the amplitude of the chest is regular, representing a wavy motion in time. When hypopnea/ apnea occurs there is a reduction/lack of chest movement in relation to the decrease/absence of airflow rushing into the lungs. When normal tidal breathing is restored, a large inflow of air will provoke a visually remarkable rise in the amplitude of the chest movement regarding the movement generated during the immediate previous seconds.
Through the computerized analysis of motion of the respiratory movement of a subject while sleeping, we can infer the existence of respiratory alterations. Measuring the amplitude of chest movement and its variability permits detection of airflow disturbances and breathing events.
These principles are similar to those used by respiratory inductance plethysmography that measures the changes in the thoracic cross-sectional area to provide and indirect measure of ventilation. An approximate measure of the cross-sectional area is obtained by measuring the self- inductance of elastic belts containing insulated wires that are wrapped around the abdomen.18 In this way, respiratory inductance plethysmography can provide a measure of tidal volume when it is calibrated to a known volume measure.
Material
SleepWise
SleepWise is a nonintrusive system for the diagnosis of OSA, which is able to detect respiratory events only from series of digital images provided by a digital video camera. Its technology is based on the principle that the volume of air that circulates into the lungs is proportional to the patient's movement while breathing.
SleepWise successively analyzes the images captured by the video camera and generates two types of signal or two types of information. First, the respiratory movement signal records subtle movements such as the thoracic oscillations that take place during respiration and can be used to infer respiratory flow and detect alterations therein. Second, the body movement signal records movements involving a greater degree of motion, such as changes of position. Based on a system similar to actimetry, this signal will differentiate states of sleep/awake and can infer the subject's sleep time and number of awakenings.
To detect both respiratory events such as the state of sleep/ awake, SleepWise uses numerical thresholds that were calculated empirically by an automatic learning system based on the results of polysomnography as the total number of events and sleep time.
Respiratory movement signal and event detection: The usual method for the detection of respiratory events (apneas or hypopneas) during sleep is based on the identification of changes in airflow or tidal volume by pneumotachograph and/or plethysmography. Registration of respiratory movements by thoracoabdominal bands is also important because it helps to differentiate whether a respiratory event is obstructive or central, and the calibrated sum of these bands can estimate the volume of air mobilized. These bands employ piezoelectric crystals or inductance plethysmography to record a curve of movement.
The principle on the basis of which SleepWise works is that the amount of air mobilized by each respiratory movement is proportional to respiratory flow, meaning that variations in the range of respiratory movement entail variations in flow.
SleepWise analyzes 30 frames/sec from a camera or a prere-corded video of a sleeping patient. It processes each frame by applying the algorithms specified in the appendix so as to identify the pixels in which movement has been detected. Figure 1 shows the graphic result of the process in question, with the pixels in which movement has been detected marked with various red dots. The number of red dots in a frame is indicative of the extent of movement at each point in time, whereas the position of each red dot shows where movement has been made. A respiratory movement signal similar to that obtainable from a cannula or a chest strap can be established on the basis of the number of red dots in each of a series of frames.
Figure 1.
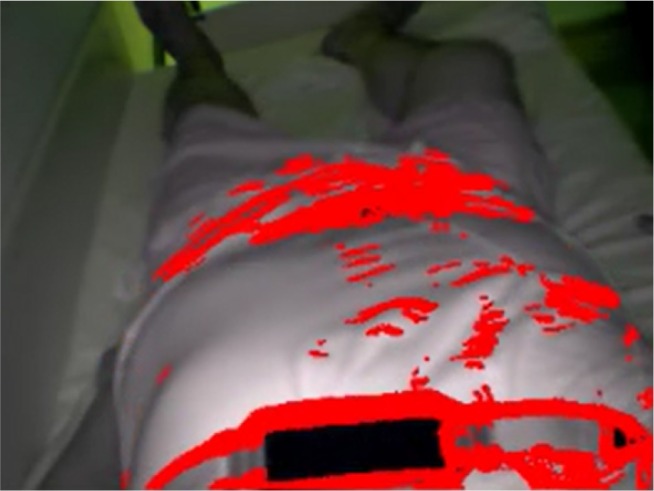
Capture of a video frame analyzed by SleepWise, showing a patient sleeping during the recording of one of our study's sessions. The red dots indicate where the video processing algorithms detected movement.
SleepWise uses the movement signal and, specifically, its upper and lower envelopes to calculate the flow of the air that the patient is breathing.
SleepWise detects respiratory events by looking for falls in the amplitude of respiratory flow and calculating their magnitude in relation to the respiratory signal's mean value. The mean is used as a reference point for the magnitude of fall because the extent of a subject's respiratory movement depends on factors such as body volume, position, whether or not the subject is covered, and the distance to the camera. To minimize the effect of those factors, signal variations, or falls, are always compared to the mean respiratory movement detected in the previous minutes (Av), which acts as a local benchmark against which any change can be measured.
The magnitude of the drop in airflow (R) is defined as:
 |
Max [S' (t)] and min [S' (t)] represent the relative maximum and minimum airflow signal, T represents the duration of fall, and Av is the local average of the respiratory air flow signal. If the magnitude of the fall of the flow exceeds a certain threshold (R > 0.4) we say that there exists a respiratory event.
Figure 2 shows two examples of flow inferred by SleepWise over a period of approximately 20 sec during which there was a fall in the respiratory flow signal. In case (A), the fall is slight and regarded as being within the normal parameters of respiration (R = 0.2). In case (B), the fall shown (R = 3.2) corresponds to pathological respiration (obstructive apnea). When a pathological respiratory event occurs, both the fall in flow and recovery in the exit stage are characterized by a very steep slope.
Figure 2.
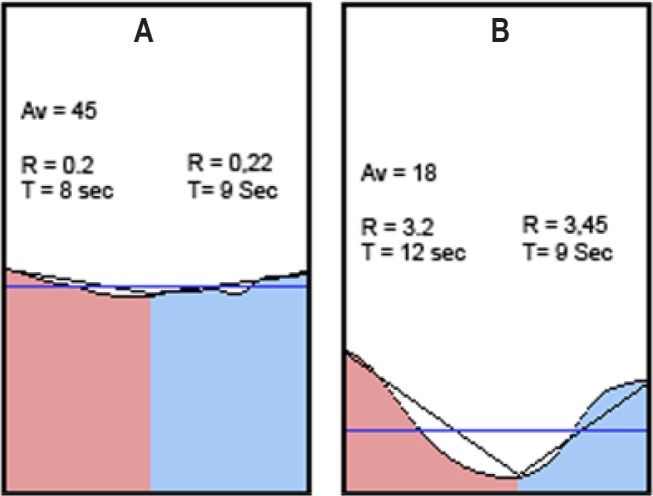
Graphic representation of two respiratory events. In the first, the respiratory signal's envelope falls very slightly compared to Av, the mean respiratory flow value (horizontal blue line). The second meets pathological event criteria. The fall in respiratory flow in its entry stage (red) and the rise in its exit stage (blue) are both much sharper in relation to the mean respiratory movement value. Av, average of the respiratory air flow signal.
Figure 3 shows how SleepWise graphically represents a long period of normal respiration (A) and a period in which pathological respiratory events occur (B). The sharp falls in respiratory flow, followed by recovery, coincide with snoring (C).
Figure 3.
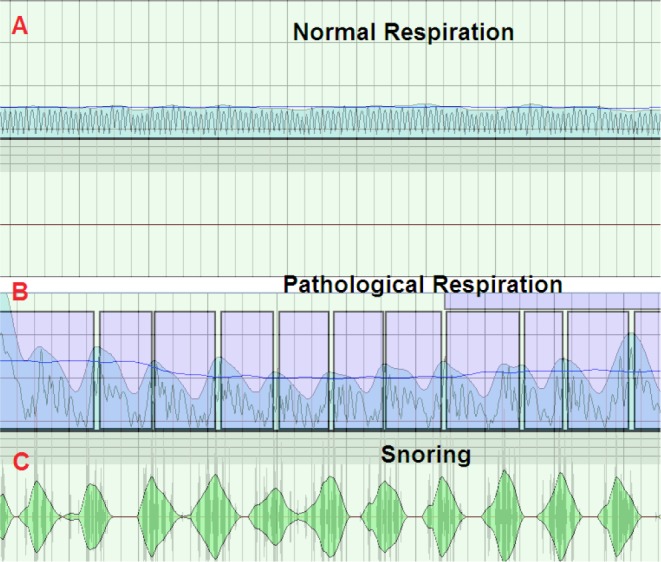
A SleepWise recording showing a period of normal respiration (A) and a period in which evident respiratory events (B) and snoring (C) take place.
Body movement signal: The body movement signal makes it possible to infer states of sleep and wakefulness on the basis of criteria similar to those used in actigraphy. Actigraphy, also known as accelerometry or actimetry, is an inexpensive, noninvasive, and easy-to-use modality to measure movements, typically using piezoelectric wearable sensors, that extract information regarding sleep/awake periods.6
Body movement is analyzed by comparing two images captured 2 sec apart. The images are scaled beforehand to reduce their resolution and filter out subtle movements, thus ensuring that only major differences between them are detected. The body signal movement is calculated by totalling the differences between the values of each of the pixels corresponding to a given position.
SleepWise considers a body movement event to be taking place when the signal crosses a specific threshold, which has been empirically set at 2.85 times of an entire recording's mean body movement signal value (see the supplemental material). The patient is deemed to have awakened if a movement event lasts for more than 5 sec. If a further movement event (regardless of its duration) occurs within 3 min of the first, SleepWise interprets it as meaning that the patient remains awake. In the absence of such a further event in the period in question, the system assumes that the patient has gone back to sleep.
By analyzing both the respiratory and body movement signals, it is possible to determine how many respiratory events a patient experiences, how long he/she is asleep, and how the sleep is distributed.
The AHI is calculated as the quotient of the total number of respiratory events detected by SleepWise divided by the total number of hours of sleep inferred by the system.
For image recording purposes, we focused a video camera on the patient's thorax from a distance of approximately 60 cm. The video analyzed had a resolution of 320 × 240 pixels and a frame rate of 30 frames/sec, and no compression algorithm was applied to it beforehand. The camera was equipped with an infrared LED lighting system with a wavelength of 940 nm to allow for operation in complete darkness.
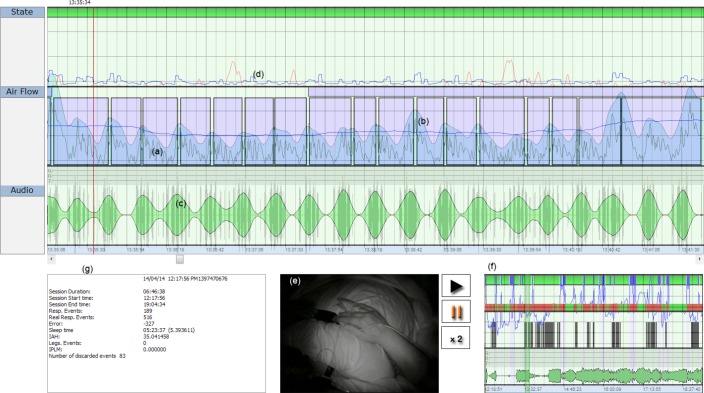
Figure 4 shows a recording obtained while a patient was sleeping. The body movement signal (d) appears in the upper panel (State) indicating the sleep and awake periods. The middle panel (Air Flow) displays the respiratory movement signal, where (a) corresponds to respiratory flow and (b) is the mean respiratory movement signal value.
Figure 4.
SleepWise user's interface. Image of a SleepWise recording, showing the respiratory movement signal (a), the respiratory flow signal (b), the audio recording (c),the body movement signal (d), the video recording (e), the session summary screen (f), and relevant session data (g).
The lower panel (Audio) contains a recording of the patient's snoring, a signal that SleepWise obtains using a microphone in the camera. Although the signal in question is crude due to environmental interference, it is useful for our study's analysis. At the bottom of the image, the box on the left (g) features a summary of all the session's details and the box on the right (f) provides a compressed graphic representation of the session. The video recording of the patient (e) appears between (g) and (f).
Polysomnography
For OSA diagnosis we used gold standard equipment in the form of a 32-channel E-Series polygraph (Compumedics Ltd; Abbotsford, Victoria, Australia), to record electroencephalography, electro-oculography, electromyography, and echocardiography results in accordance with American Academy of Sleep Medicine criteria.15 We monitored respiratory flow by means of a thermistor and a nasal cannula. We recorded thorax and abdomen respiratory movements with two plethysmography bands, and oxygen saturation with a pulse oximeter. We used a video camera equipped with infrared LEDs to record each subject while sleeping.
We defined apnea as the complete cessation of respiratory flow for over 10 sec, and hypopnea as a reduction in respiratory flow lasting for over 10 sec and accompanied by oxygen de-saturation of at least 3% and/or arousal according to American Academy of Sleep Medicine guidelines.15 We calculated the AHI as the quotient of the total number of apneas and hypopneas divided by the total number of hours of sleep determined by PSG.
Statistical Analysis
Quality control was applied to the data entered in the database. The descriptive analysis was expressed in terms of means and standard deviations in the case of quantitative variables. Qualitative variables were expressed in terms of valid percentages. We used the Kolmogorov-Smirnov test to check each variable's normality criteria.
Differences in anthropometric variables according to the presence of OSA were evaluated using the nonparametric Mann-Whitney U test.
Intraclass correlation coefficient (ICC), Kappa index (κ) and Bland-Altman test were used to evaluate the agreement of the two techniques for determining subjects' AHI. Diagnostic accuracy relates to the ability of SleepWise to discriminate OSA condition was quantified by sensitivity and specificity, predictive values, and likelihood ratios. Receiver operating characteristic curves for the different SleepWise AHI cutoff points (≥ 5, ≥ 15 and ≥ 30) according to the degree of severity of OSA were determined via PSG. On the basis of each SleepWise AHI cutoff point's predictive values for correctly classifying OSA, we identified the point with the greatest predictive power. Level of significance was set at 0.05. The SPSS version 22 software (SPSS Inc., Chicago, IL, USA) was used for all analyses.
RESULTS
Description of Population and Anthropometric Variables
We evaluated a total of 56 patients in the study, but 6 patients were excluded for this analysis (2 on the grounds of lacking an electroencephalography signal and it being impossible to identify stages of sleep; 3 of spending less than 4 h asleep; and 1 of a diagnosis of restless legs syndrome). The final sample of analysis was of 50 patients. Table 1 shows demographic, anthropometric characteristics and Epworth Sleepiness Scale score of the overall sample.
Table 1.
Demographic, anthropometric, and Epworth Sleepiness Scale test values of the overall sample and by degree of severity.

Analysis of the Findings of SleepWise in Comparison with PSG
No significant differences were observed between PSG and SleepWise in terms of the sleep time, total number of respiratory events, and AHI parameters (Table 2).
Table 2.
Comparison of sleep parameters obtained using PSG and SleepWise.
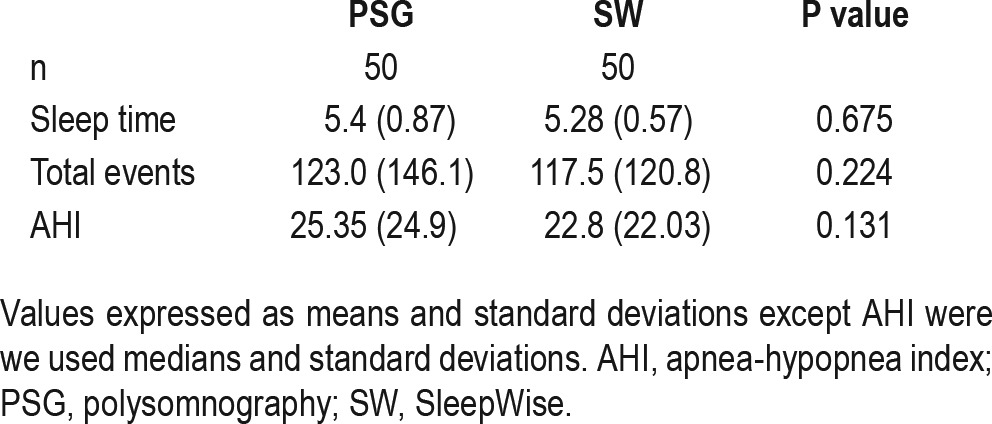
A total of 44 patients (88%) received a diagnosis of OSA with PSG, with a median AHI of 25.35 (24.9). According to SleepWise, 45 patients (90%) received a diagnosis of OSA, with a median AHI of 22.8 (22.03) (Figure 5).
Figure 5.
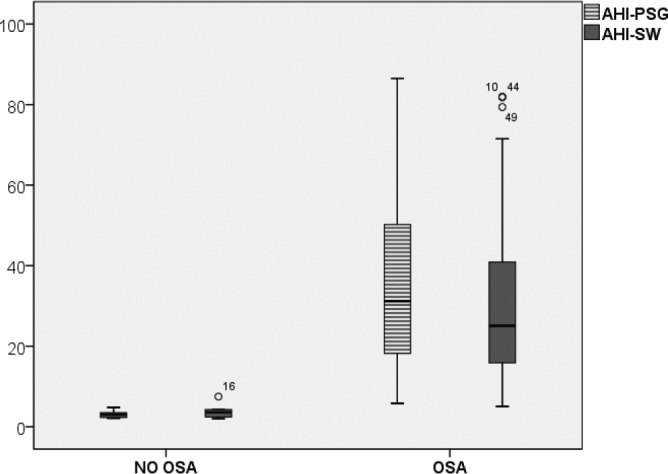
Comparative boxplot of the apnea-hypopnea index per hour (AHI/h) according to PSG and SleepWise (P = 0.131).
An analysis of the ability of PSG and SleepWise to classify patients by severity on the basis of their AHI shows that the two diagnostic systems distribute the different groups similarly. The mean AHI values obtained through PSG and Sleep-Wise for each degree of severity are reflected in Figure 6.
Figure 6.
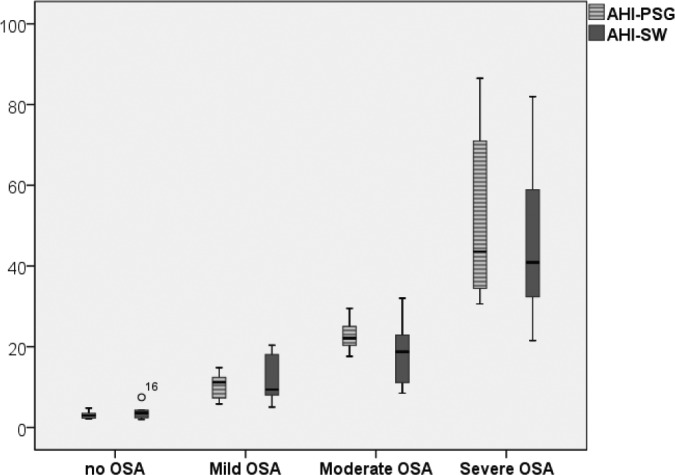
Degree of severity of OSA according to AHI/h values obtained through PSG and SleepWise.
Discriminative Potential of SleepWise
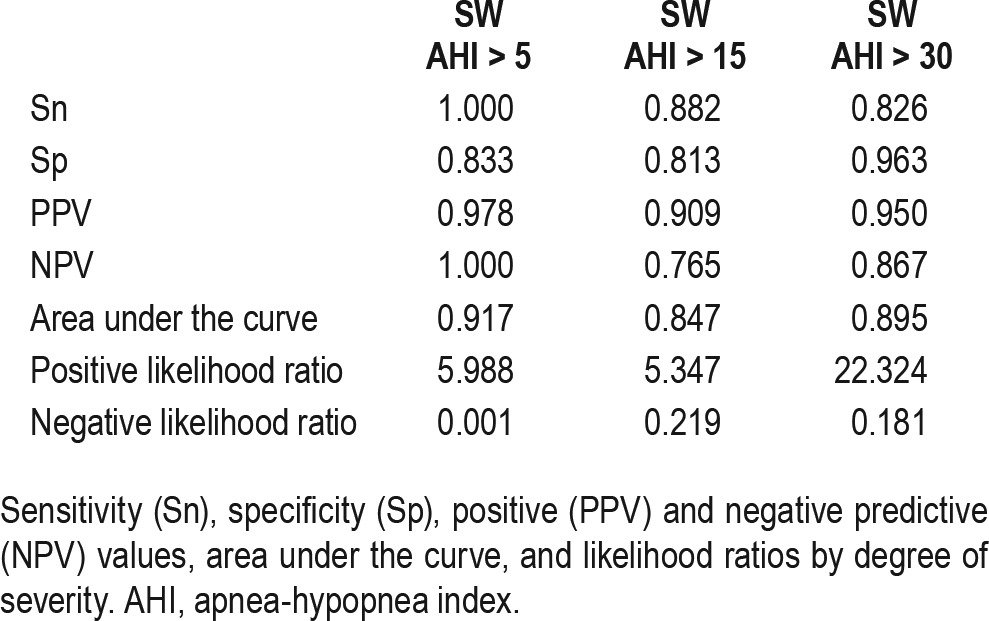
Table 3 shows the total events and sleep time values obtained through PSG and SleepWise for each degree of severity of OSA identified through PSG. There were no significant differences between them. For OSA diagnosis, SleepWise was found to have a sensitivity of 100% and a specificity of 83% in relation to PSG. The positive predictive value was 97% and the negative predictive value was 100%. Table 4 shows sensitivity, specificity, predictive values, and likelihood ratios values corresponding to the different degrees of severity of OSA. The area under the receiver operating characteristic curve was used to analyze the diagnostic validity of SleepWise in comparison to PSG for the different degrees of severity of OSA, taking the AHI values identified for each degree of severity as cutoff points. The values for the diagnosis of mild, moderate, and severe OSA were 0.917, 0.847, and 0.895 respectively. The AHI cutoff point of 7.75 showed the best discriminative power for OSA diagnosis
Table 3.
Comparison of PSG and SleepWise total events, AHI and sleep time values.

Table 4.
Values by degree of severity.
According to PSG, 23 patients (46%) were diagnosed with severe OSA, 11 patients (22%) with moderate OSA, and 10 patients (20%) with mild OSA. There were 6 patients (12%) who did not meet criteria for OSA (Table 3). In some patients there are differences in the classification between the severity of OSA detected by PSG and SleepWise. The analysis of these cases shows that this difference is caused by patients with AHI values very near the limits of the classification grades of severity. These differences are in classification of severity, but do not modify the therapeutic approach. In only one patient was OSA by PSG not diagnosed and classified as mild OSA by SleepWise (as PSG AHI of 4.8 and 7.4 according to SleepWise).
Degree of Agreement between Methods
A good degree of agreement and reliability using the ICC was observed between methods (ICC = 0.866, P < 0.001). When AHI transformed according to severity, good agreement was also shown (kappa (κ) index of 0.898 in mild OSA, κ = 0.684 in moderate OSA and κ = 0.797 in severe OSA, (P < 0.001, all).
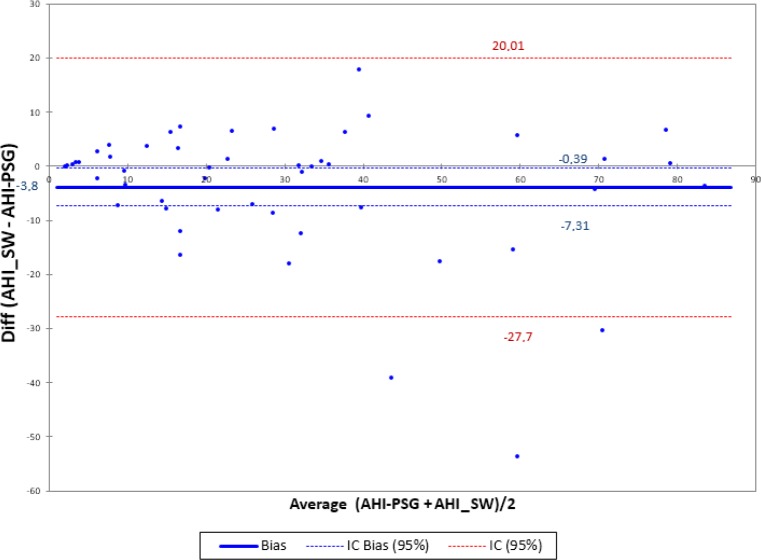
The Bland-Altman plot comparing the mean AHI values obtained through PSG and SleepWise shows very good agreement between the two diagnostic techniques, with a bias of −3.85 with a standard error of 12.81 and a confidence interval of −27.732 to 20.017 (Figure 7). There are three isolated cases involving substantial errors, the causes of which will be examined in the Discussion section.
Figure 7.
Bland-Altman plot for polysomnography (PSG) and SleepWise (SW) apnea-hypopnea index (AHI) shows an average difference of −3.8, which would indicate a slight tendency of SleepWise to underdiagnose. However, this is not a systematic error of the system because this trend was triggered by three samples. In these three samples, despite the correct ranking of the severity of obstructive sleep apnea (OSA), the error in the computation of AHI was very large. Such samples can be observed clearly outside the confidence interval for the difference of 95% of the samples [−27; 20] and maybe we would consider them as outliers. Nevertheless, the limits of agreement are calculated [−7.3; −0.39] indicating a good level of equivalence between the two systems. The cause of error in these three samples is specifically treated in the discussion of the article. Except for these three samples, we observe a uniformly distributed trend or inconsistent variability along the axis.
DISCUSSION
The results of our work propose SleepWise as an innovative and reliable system for the diagnosis of OSA.
According to our study, SleepWise enabled us to distinguish patients who have OSA from those who do not with a sensitivity of 100% and a specificity of 83%. It would thus be an excellent tool for screening. We found the system's sensitivity and specificity to be 88% and 81%, respectively, in the case of subjects with moderate OSA, and 82% and 96%, respectively, in the case of those with severe OSA. These results support the notion of SleepWise being useful not only for diagnosis but also for identifying the degree of severity involved.
Other authors have developed various techniques based on motion analysis for diagnosis of OSA, but there are signifi-cant differences when compared to SleepWise from the video analysis of breathing to the detection of respiratory events.
Because SleepWise does not use additional elements such as laser pointers or textured surfaces,5–8 it is easier to use and more comfortable for the patient. Our system records patients' sleep without any interference and with an improved quality of sleep. The sleep log signal will not be influenced either by the spontaneous movements of the patient or by external interferences, and the patients' sleep will be more physiological. However, although the patients analyzed underwent simultaneous PSG, we do not believe this fact had an influence on the features of patients' respiratory movements and its detection and classification by SleepWise. SleepWise can detect respiratory movements independently of the position while sleeping or even if the patient is covered by a blanket.
Regarding the detection of respiratory events, several ideas for the future have been proposed. There is speculation about how to detect a central or an obstructive apnea, but currently there is no real difference among respiratory events. The standard classification for apnea and hypopnea is currently based on information given by different sensors on the patient's body; thus, there is no normative of classification according to respiratory movements detected by a video camera. Therefore, for our study we have made a great effort to determine which parameters were correlated more precisely between a respiratory event detected by PSG and one detected by SleepWise. This correlation was calculated using different automatic learning algorithms based on the data of the PSG. In contrast with our studies, other published works have not detected a characterization of respiratory events compared to PSG.
In our case, although currently the system does not distinguish between apneas and hypopneas (that is why we always refer to the concept of respiratory events without determining their nature) it would be possible to establish a classification of events based on the fall in respiratory flow. An event would generally be an apnea if the fall involved is very sharp and fast; otherwise, it would be a hypopnea. Central apneas could be detected on the basis of the total absence of respiratory movement. Incorporating such a classification into the software is a task for future versions.
However, the previous studies are based only on the analysis of three or five patients and never comparing their devices with PSG, which is the gold standard for the diagnosis of OSA. In this sense, our study including 50 patients undergoing simultaneous PSG and SleepWise and then comparing both diagnostic techniques offers more confident results.
Comparing SleepWise to other simplified systems, it has the amazing advantage of inferring patients' state of sleep/awake in a highly reliably way. The sleep time determined by Sleep-Wise showed no statistically significant differences compared to the sleep time determined by PSG. This gives greater reliability when determining the AHI without the problem of underdiagnosis that can occur with the current simplified systems.
As far as SleepWise limitations are concerned, we have noticed certain difficulties in detecting isolated respiratory events whose duration is close to the 10-sec threshold. That is the main factor in the substantial difference between the AHI values determined by PSG and SleepWise in three cases, resulting in a slight discrepancy between the two systems' mean number of events and mean AHI values that were highlighted in the Bland-Altman plot. In these three cases, patients had a very high AHI and experienced very brief events in quick successions. Because SleepWise analyzes sessions automatically, events whose duration was too close to the minimum required were rejected, even though their pathological classification seemed very clear in context. Given that the number of respiratory events that occurred was very high, the number of events that were rejected also was high, causing a considerable error in AHI calculation. However, that did not affect diagnosis or the identification of the degree of severity. We think that such errors could easily be corrected through manual analysis performed by a specialist in sleep medicine.
Another limitation is that, because this study is not population based, there could be a selection bias by excluding patients with severe comorbidities. Although we strongly believe the presence of comorbidities is not an exclusion criteria for the use of SleepWise as a diagnosis tool for OSA, as the goal of our work was to validate its diagnostic accuracy compared with PSG performed in a sleep laboratory, we excluded patients with severe comorbidities to reduce as much as possible confounding factors that may hinder or interfere with the diagnosis of OSA. We plan to overcome this limitation in future studies by including a larger number of patients and by omitting any type of comorbidity or its severity as exclusion criteria.
Something else to be borne in mind is the lack of an oxygen saturation recording. If the level of oxygen saturation were identified, it would be possible to assess the systemic repercussion of respiratory events and underline their importance. It is technically possible to add the information in question, but that would lead to the drawback of the system ceasing to be noninvasive.
SleepWise offers benefits that make us think that it could be a useful tool to study out-patients and pediatric patients. However, further studies are needed that allow us to verify the effectiveness of the device in these contexts. It is also necessary to analyze cost effectiveness compared with current diagnostic tools.
In conclusion, SleepWise is a system that is noninvasive, easy to use, and effective and has high sensitivity and specificity for the diagnosis of OSA. SleepWise also allows us to establish the severity of OSA and determine the sleep time with a high level of confidence.
DISCLOSURE STATEMENT
This was not an industry supported study. The authors have indicated no financial conflicts of interest. This study was performed at Hospital Universitari Germans Trias i Pujol (HUGTiP), Badalona, Spain.
ACKNOWLEDGMENTS
Appreciation is expressed to Maria José Masdéu, PhD, Fernando Masa, PhD, and Ferran Barbé, PhD for their critical comments on the manuscript. We are also greatly thankful to James Haigh for his help with the manuscript translation. The authors thank the sleep laboratory nurses, including Alberto Baya and Estrella Fuentes, for their help with the realization of the sleep tests. Author contributions: All authors have contributed to the conception and design of the study; analysis and interpretation of data; and writing the article or revising it critically for important intellectual content. Drs. Abad, Cervantes, and Esquinas performed the statistical analysis and interpreted the results. Dr. Muñoz-Ferrer prepared the first draft of the paper. Drs. Abad and Cervantes had full access to all of the data in the study and take responsibility for the integrity of the data and the accuracy of the data analysis. All authors read and approved the final manuscript.
ABBREVIATIONS
- AASM
American Academy of Sleep Medicine
- AHI
apnea-hypopnea index
- EEG
electroencephalography
- EKG
electrocardiography
- EMG
electromyography
- EOG
electroculography
- ESS
Epworth Sleepiness Scale
- HUGTiP
Hospital Universitari Germans Trias i Pujol
- NPV
negative predictive value
- OSA
obstructive sleep apnea
- PPV
positive predictive value
- PSG
polysomnography
- RIP
respiratory inductance plethysmography
- Sn
sensitivity
- Sp
specificity
- SW
SleepWise
REFERENCES
- 1.Kushida CA, Littner MR, Morgenthaler T, et al. Practice parameters for the indications for polysomnography and related procedures: an update for 2005. Sleep. 2005;28:499–521. doi: 10.1093/sleep/28.4.499. [DOI] [PubMed] [Google Scholar]
- 2.Corral-Peñafiel J, Pepin JL, Barbe F. Ambulatory monitoring in the diagnosis and management of obstructive sleep apnoea syndrome. Eur Respir Rev. 2013;22:312–24. doi: 10.1183/09059180.00004213. [DOI] [PMC free article] [PubMed] [Google Scholar]
- 3.Agnew HW, Webb WB, William RL. The first night effect: an EEG study of sleep. Psychophysiology. 1996;2:263–6. doi: 10.1111/j.1469-8986.1966.tb02650.x. [DOI] [PubMed] [Google Scholar]
- 4.Collop NA, Anderson WM, Boechlecke B, et al. Clinical guidelines for the use of unattended portable monitors in the diagnosis of obstructive sleep apnea in adult patients. Portable Monitoring Task Force of the American Academy of Sleep Medicine. J Clin Sleep Med. 2007;3:737–47. [PMC free article] [PubMed] [Google Scholar]
- 5.Griffiths CJ, Cooper BG, Gibson GJ. A video system for investigating breathing disorders during sleep. Thorax. 1991;46:136–40. doi: 10.1136/thx.46.2.136. [DOI] [PMC free article] [PubMed] [Google Scholar]
- 6.Takemura Y, Sato J, Nakajima M. A respiratory movement monitoring system using fiber-grating vision sensor for diagnosing sleep apnea syndrome. Optical Rev. 2005;12:46–53. [Google Scholar]
- 7.Nakajima K, Matsumoto Y, Tamura T. Development of real-time image sequence analysis for evaluating posture change and respiratory rate of a subject in bed. Physiol Meas. 2001;22:N21–8. doi: 10.1088/0967-3334/22/3/401. [DOI] [PubMed] [Google Scholar]
- 8.Drummond GB, Duffy ND. A video-based optical system for rapid measurements of chest wall movement. Physiol Meas. 2001;22:489–503. doi: 10.1088/0967-3334/22/3/307. [DOI] [PubMed] [Google Scholar]
- 9.Beattie ZT, Hayes TL, Guilleminault C, Hagen C. Accurate scoring of the apnea-hyponea index using a simple non-contact breathing sensor. J Sleep Res. 2013;22:356–62. doi: 10.1111/jsr.12023. [DOI] [PMC free article] [PubMed] [Google Scholar]
- 10.Morgenthaler T, Alessi C, Freiedman L, et al. Practice parameters for the use of actigraphy in the assessment of sleep and sleep disorders: an update for 2007. Sleep. 2007;30:519–29. doi: 10.1093/sleep/30.4.519. [DOI] [PubMed] [Google Scholar]
- 11.Karci E, Drogusoz YS, Ciloglu T. Detection of post apnea sounds and apnea periods from sleep sounds. 33rd Annual International Conference of the IEEE EMBS; August 30-September 3, 2011; Boston, Massachusetts. [DOI] [PubMed] [Google Scholar]
- 12.Lee LA, Yu JF, Chen YS, et al. Energy types of snoring sounds in patients with obstructive sleep apnea syndrome: a preliminary observation. PLoS One. 2012;7:e53481. doi: 10.1371/journal.pone.0053481. [DOI] [PMC free article] [PubMed] [Google Scholar]
- 13.Fiz JA, Jané R, Solà-Soler J, Abad J, García MA, Morera J. Continuous analysis and monitoring of snores and their relationship to the apneahypopnea index. Laryngoscope. 2010;120:854–62. doi: 10.1002/lary.20815. [DOI] [PubMed] [Google Scholar]
- 14.Levendowski DJ, Seagraves S, Popovic D, Westbrook PR. Assessment of a neck-based treatment and monitoring device for positional obstructive sleep apnea. J Clin Sleep Med. 2014;10:863–71. doi: 10.5664/jcsm.3956. [DOI] [PMC free article] [PubMed] [Google Scholar]
- 15.Berry RB, Budhiraja R, Gottlieb DJ, et al. Rules for scoring respiratory events in sleep: update of the 2007 AASM Manual for the Scoring of Sleep and Associated Events. Deliberations of the Sleep Apnea Definitions Task Force of the American Academy of Sleep Medicine. J Clin Sleep Med. 2012;8:597–619. doi: 10.5664/jcsm.2172. [DOI] [PMC free article] [PubMed] [Google Scholar]
- 16.West JB. Ventilation- How gas gets to the alveoli. In: West JB, editor. Respiratory Physiology: The Essentials. 9th ed. Philadelphia, PA: Wolters Kluwer Lippincott Williams & Wilkins; 2012. [Google Scholar]
- 17.West JB. Mechanics of breathing--How the lung is supported and moved. In: West JB, editor. Respiratory Physiology: The Essentials. 9th ed. Philadelphia, PA: Wolters Kluwer Lippincott Williams & Wilkins; 2012. [Google Scholar]
- 18.Roebuck A, Monasterio V, Gederi E, et al. A review of signals used in sleep analysis. Physiol Meas. 2014;35:R1–57. doi: 10.1088/0967-3334/35/1/R1. [DOI] [PMC free article] [PubMed] [Google Scholar]
Associated Data
This section collects any data citations, data availability statements, or supplementary materials included in this article.


