Abstract
The structure of the human brain changes in a variety of ways as we age. While a sizeable literature has examined age-related differences in cortical thickness, and to a lesser degree, gyrification, here we examined differences in cortical complexity, as indexed by fractal dimensionality in a sample of over 400 individuals across the adult lifespan. While prior studies have shown differences in fractal dimensionality between patient populations and age-matched, healthy controls, it is unclear how well this measure would relate to age-related cortical atrophy. Initially computing a single measure for the entire cortical ribbon, i.e., unparcellated gray matter, we found fractal dimensionality to be more sensitive to age-related differences than either cortical thickness or gyrification index. We additionally observed regional differences in age-related atrophy between the three measures, suggesting that they may index distinct differences in cortical structure. We also provide a freely available MATLAB toolbox for calculating fractal dimensionality.
Keywords: cortical structure, fractal dimensionality, age, atrophy, cortical thickness, gyrification
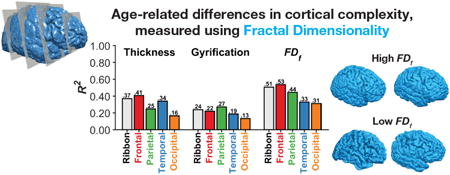
Graphical abstract
Introduction
As we age, the structure of our brain changes in numerous ways, ranging from vascularization to cellular (Kemper, 1994; Raz & Rodrigue, 2006; Wiśniewksi & Terry, 1973). Age-related brain atrophy can be readily measured in vivo using magnetic resonance imaging (MRI). Many earlier studies have observed age-related differences in gray matter volume (e.g., Coffey et al., 1992; Ge et al., 2002; Jernigan et al., 1991; Passe et al., 1997; Raz et al., 1997; Resnick et al., 2000, 2003; Steiner et al., 1985). However, more recent studies have demonstrated that, in cortical regions, inter-individual differences in gray matter volume are more closely related to differences in cortical thickness, rather than surface area (Barnes et al., 2010; Hutton et al., 2009; McKay et al., 2014; Storsve et al., 2014; Winkler et al., 2010). Converging with this, differences in cortical thickness have been shown to be related to aging, while inter-individual differences in surface area have been more strongly influenced by sex differences (Barnes et al., 2010; Fjell et al., 2009a, 2009b; Herron et al., 2015; Hogstrom et al., 2013; Hutton et al., 2009; McKay et al., 2014; Salat et al., 2004; Sowell et al., 2007; Storve et al., 2014; Thambisetty et al., 2010). These studies make clear that different metrics of gray matter will have different sensitivities in detecting age-related differences. With the increased focus on relatively short-term longitudinal studies (e.g., to assess the effects of behavioural interventions, such as exercise and meditation, on brain morphology; see Hayes et al., 2014; Tang et al., 2015), it is useful to have additional metrics of cortical structure that are sensitive to age-related differences.
Here we considered how age affects cortical structure by using both cortical thickness and another metric, cortical complexity, measured using calculations originally designed to quantify the structure of fractals. Prior studies have demonstrated that cortical complexity is related to cognitive performance (Im et al., 2006; Mustafa et al., 2012; Sandu et al., 2014) and differs between several neurological patient populations relative to healthy controls (e.g., Alzheimer's disease: King et al., 2009, 2010; schizophrenia: Sandu et al., 2008; Nenadic et al., 2014; Yotter et al., 2011; multiple sclerosis: Esteban et al., 2009; frontal lobe epilepsy: Cook et al., 1995; multiple system atrophy: Wu et al., 2010; William's syndrome: Thompson et al., 2005). Here we investigated age-related differences in fractal dimensionality of the cortical ribbon and parcellated regions of cortex in a large sample of adults across the lifespan, using structural images obtained from an open-access dataset. To conduct these analyses, we developed a MATLAB toolbox designed to use intermediate files produced in a standard FreeSurfer analysis, which we now freely distribute (see http://cmadan.github.io/calcFD/).
Complex natural structures can be difficult to quantify. While fractal dimensionality analyses were initially developed for use with fractals, they were found to be useful in quantifying the complexity of ‘natural’ structures, such as the complexity of continental coastlines (Mandelbrot, 1967). Fractal dimensionality analyses have been shown to be useful in quantifying the natural complexity of the brain across multiple scales, ranging from molecular to whole brain (see Di Ieva et al., 2014, 2015, for comprehensive discussions). In these MRI studies, researchers specifically sought to use fractal dimensionality analyses to quantify the convolutional properties of the cortex (Cook et al., 1995; Free et al., 1996; Kiselev et al., 2003; Luders et al., 2004; Thompson et al., 1996). Recent studies have used fractal dimensionality to assess age-related differences in white matter morphology (Farahibozorg et al., 2015; Zhang et al., 2007). Im et al. (2006) found that whole-brain mean cortical thickness and fractal dimensionality shared approximately 50% of the variance (i.e., r2; also see King et al., 2010), suggesting that fractal dimensionality may relate to age-related brain atrophy, but also may be sensitive to other differences in gray matter structure that are not indexed by cortical thickness.
Prior research has demonstrated that in addition to cortical thickness, fractal dimensionality co-varies with gyrification (King et al., 2009, 2010). As such, we additionally examined age-related differences in gyrification index as a comparison. Briefly, the gyrification index measures the amount of cortical folding in a region of the brain. Gyrification index is calculated by estimating a smooth surface contour that wraps around the pial surface, where the gyrification index is the ratio of a regional surface area for the pial surface to this smoothed outer surface (i.e., a convex hull; for an illustration, see Figure 3 of Mietchen & Gaser, 2009, or Figure 2 of Toro et al., 2008; also see Kochunov et al., 2012). Though age-related differences in gyrification have not been studied as extensively as those in relation to cortical thickness, Hogstrom et al. (2013) found clear evidence for age-related reductions in gyrification (also see Rogers et al., 2010), and that these differences were not correlated with decreases in cortical thickness, which they also observed. Thus, one of our aims was also to examine the relationship between fractal dimensionality, cortical thickness, and gyrification index, within a large sample of healthy adults across the lifespan.
Here we examined age-related differences in whole-brain and lobe-wise estimates of cortical complexity, as indexed by fractal dimensionality, in a sample of over 400 individuals across the adult lifespan. These results were compared with similar analyses testing for age-related differences in cortical thickness and gyrification index, as well as the relationship between these more established measures and fractal dimensionality. Finally, we used a multivariate regression approach to directly compare these different measures of cortical morphology, and used regression models that included predictors from each of the three measures. We found fractal dimensionality to be more sensitive to age-related differences than either thickness or gyrification; we also observed regional differences in age-related atrophy depending on which cortical measure was used, suggesting that each measure may index distinct differences in cortical structure. We also provide a freely available MATLAB toolbox for calculating fractal dimensionality, using intermediate files generated as part of the standard FreeSurfer analysis pipeline, and present benchmark analysis demonstrating its functionality.
Procedure
Dataset
All MRI data was drawn from the IXI (“Information eXtraction from Images”) dataset, a collection of structural MRIs from 581 healthy adults across the lifespan (20-86 years old). The IXI dataset was collected in 2005-2006 from three sites in the UK (each with a different scanner system) and includes T1, T2, DTI, PD, and MRA images. Here we only used the T1-weighted structural images. The dataset is freely available from: http://brain-development.org/ixi-dataset/. The IXI dataset has been used in numerous studies investigating structural properties of the brain and related differences due to healthy aging (e.g., Ardekani & Bachman, 2009; Franke et al., 2010; Ganzetti et al., 2014; Koutsouleris et al., 2014; Robinson et al., 2010; Ziegler et al., 2012). Unfortunately, the criteria used to assess that these individuals were healthy adults without any neurological or psychiatric disorders is not provided.
Of these 581 adults for which there was imaging data in the IXI dataset, the analyses reported here are based on a sample of 427 individuals. Individuals were excluded based on three criteria: age not available (N=18), or if the gyrification index analyses failed to determine a suitable convex-hull surface for at least one hemisphere (N=6), or if the surface reconstruction failed visual inspection1 (an additional N=130). The full list of IDs for the individuals included in the analyses are listed in the appendix. Examples of surfaces that failed the visual inspection are shown in Figure A3.
Demographics (for the individuals that were included in the analyses) and scan parameters for the data from each of the sites are as follows. From the Guy's Hospital sample (Philips 1.5T), data was used from 251 individuals (147 female), with ages ranging from 20-86. Scan parameters for the T1 volumes were: TR: 9.8 ms; TE: 4.6 ms; phase encoding steps: 192; echo train length: 0; reconstruction diameter: 240 mm; flip angle: 8°. From the Hammersmith Hospital sample (Philips 3T), data was used from 129 individuals (81 female), with ages from 20-81. Scan parameters for the T1 volumes were: TR: 9.6 ms; TE: 4.6 ms; phase encoding steps: 208; echo train length: 208; reconstruction diameter: 240 mm; flip angle: 8°. From the Institute of Psychiatry sample (General Electric 1.5T), data was used from 47 individuals (32 female), with ages from 21-78. Scan parameters for the volumes collected at this site are not available.
Preprocessing of the Structural Data
Prior to the fractal dimensionality analyses, the structural MRIs for all 581 scan volumes was processed using FreeSurfer 5.3.0 on a machine running CentOS 6.6 (Fischl, 2012; Fischl & Dale, 2000; Fischl et al., 2002). FreeSurfer's standard pipeline was used (i.e., recon-all) and no manual edits were made to the surface models As is typically done, gray matter was defined by segmenting the anatomical volume to determine the white matter surface (white-gray interface) and the pial surface (gray-cerebrospinal fluid [CSF] interface).
Gyrification index was calculated using FreeSurfer, as described in Schaer et al. (2012). Briefly, gyrification index is calculated by estimating a smooth surface contour that wraps around the pial surface, where the gyrification index is the ratio of a regional surface area for the pial surface to this smoothed outer surface (i.e., a convex hull).
Calculating Fractal Dimensionality
In fractal geometry, several approaches have been proposed to quantify the ‘dimensionality’ or complexity of a fractal. The approach here calculates the Minkowski–Bouligand dimension, which in most cases is also equivalent to the Hausdorff dimension (see Mandelbrot, 1967). Several algorithms have been proposed for calculating this dimensionality measure (see Fernandez & Jelinek, 2001), two of which have been implemented in the toolbox we developed for these analyses: the box-counting algorithm and the dilation algorithm.
The box-counting algorithm (Caserta et al., 1995; Mandelbrot, 1982) involves considering the 3D structure within a fixed grid, and counting how many grid ‘boxes’ (i.e., voxels) contain portions of the surface of the structure (Figure A2). The size of the grid is then increased, and the number of filled boxes is counted again. By using multiple box sizes and obtaining their respective counts, a relationship can be determined, which is related to the complexity of the structure. These two values will follow a power-law relationship, and the exponent will relate to the structure's complexity, as illustrated in Figures 1 and 2B. Re-plotting the box size and related counts in log-log space and taking the additive inverse of the slope produces the fractal dimensionality of the structure. Thus, the corresponding equation is:
Figure 1. Illustration of how fractal dimensionality is measured from a 2D structure.
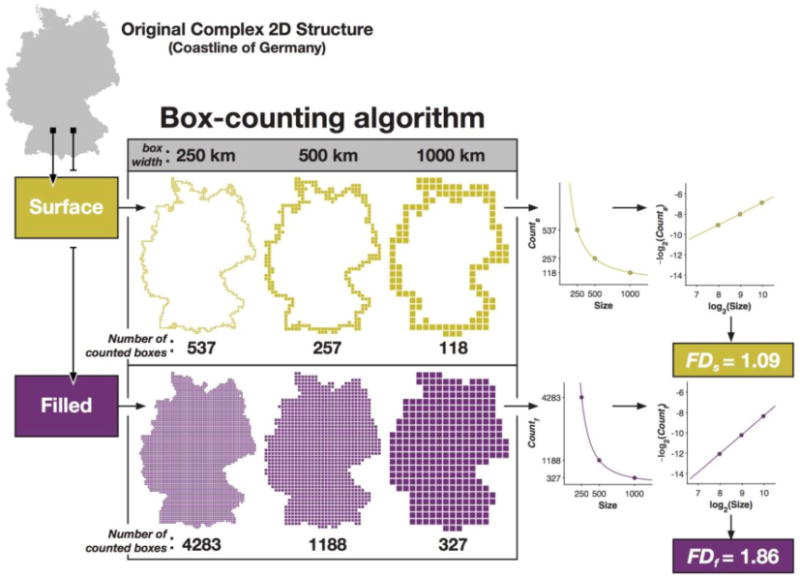
Figure 2. Illustration of how fractal dimensionality is measured from a 3D structure.
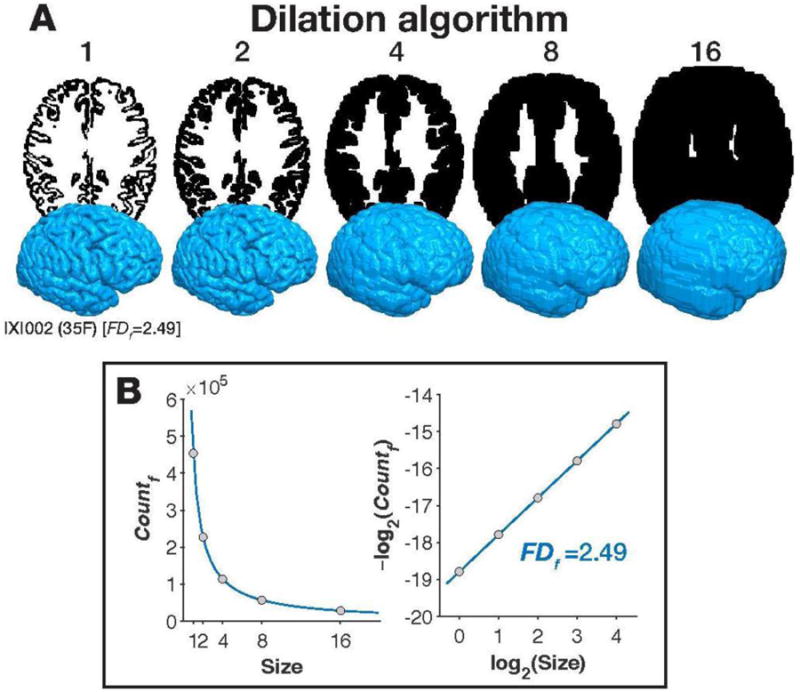
Panel A shows the filled boxes that are counted at each box size (corresponding to FDf), shown as axial slices from the middle of the brain and as 3D surface volumes, for the dilation algorithm. Panel B plots the number of counted, filled boxes at each box size (left), and re-plotted in log-log space. The fractal dimensionality is the slope of the line in log-log space. All brain images are shown from IXI002, 35 year-old female, from the IXI dataset. 3D surfaces are rendered using the pipeline described in Madan (2015).
Note, the box-counting method is similar to the line-segment method originally proposed to describe the complexity of intricate two-dimensional shapes (coastlines) (see Mandelbrot, 1967).
In Figure 1 we illustrate the procedure for calculating the fractal dimensionality of a complex 2D structure, here the coastline of Germany. Using the box-counting method, we determined the number of boxes that would fit the edge (‘surface’) of the structure using various sizes of boxes. Plotting the relationship between the number of counted boxes and the size of the boxes follows a power-law relationship, but re-plotting the values in log-log space yields a straight line. The slope of this line is the fractal dimensionality of the structure. Figure 1 shows that this procedure can be used for either the edge/‘surface’ of the complex structure, which we refer to as FDs, or can be calculated including the ‘filled’ space within the structure, which we refer to as FDf.
Most prior studies of cortical complexity have used the box-counting algorithm (e.g., Im et al., 2006; King et al., 2009, 2010; Thompson et al., 1996). Here we also implemented the dilation algorithm, where each box/voxel is replaced with a cube of a given box size (i.e., ‘dilated’). This was implemented using a 3D-convolution operation ( convn in MATLAB). Although prior studies have implemented dilation using spheres (e.g., Fernandez & Jelinek, 2001; Free et al., 1996), we used a cube here as this makes the dilation algorithm a more precise version of the box-counting algorithm. Specifically, whereas the box-counting algorithm usually uses a fixed grid scan to count if the boxes are filled or not, using the dilation algorithm with a cube is functionally identical to computing the box-counting algorithm using a sliding grid scan (i.e., if the grid was shifted in alignment with the structure, and the average of all shifted counts was taken, see Figure 2A). While a sliding grid space has been used previously (e.g., Goñi et al., 2013), the 3D-convolution operation but can be calculated much faster as it is less computationally demanding.
Here we used box sizes (in mm) corresponding to powers of 2 (e.g., de Souza & Pires Rostirolla, 2011; Fernandez & Jelinek, 2001; Hou et al., 1990), ranging from 0 to 4 (i.e., 2k [k = 0, 1, 2, 3, 4] = 1, 2, 4, 8, 16 mm). For illustrative purposes, Figures 2 and A2 show the steps for each of the algorithms for the first participant in the IXI dataset, where the filled volume is counted (FDf), rather than just the surface (described further below). Figure 2A shows axial slices from the middle of the brain (i.e., the middle slice in native space), corresponding to the dilation algorithm at the box sizes we considered here. The 3D volumes corresponding to each level box size are also shown in Figure 2A. As described earlier, FD is calculated based on the number of boxes (voxels) that are filled at each box size. As shown in the left panel of Figure 2B, as box size increases, this value decreases as volume of each box can contain more of the structure. After taking the log of both the box size and counting the boxes filled, we obtain the fractal dimensionality.
To ensure that our obtained fractal dimensionality values were valid, we computed the dimensionality of a set of benchmark volumes, i.e., simulated phantoms. The details of these benchmark analyses are reported in the Appendix. In these analyses we also found that the dilation algorithm yielded slightly more robust fractal dimensionality values; thus, all of the fractal dimensionality results reported here were calculated using the dilation algorithm.
Relationship with Intracranial Volume
Mathematically, fractal dimensionality (FD) is scale-invariant and should not be related to intracranial volume (ICV); it is possible, however, that biological constraints may cause FD and ICV to be correlated, e.g., smaller ICV space results in a relative increase in cortical complexity. Here we sought to determine if FD is correlated with ICV, such that we can appropriately control for this relationship, if it exists. We estimated ICV using FreeSurfer (Buckner et al., 2004), which has been shown to correspond well with manual tracing (Sargolzaei et al., 2015). ICV was only weakly related to age differences [r(416) = −.190, p <.001], though was found to be correlated with sex [r(416) = −.572, p <.001].
Analyses indicated that ICV correlated only weakly with either measure of fractal dimensionality of the cortical ribbon [ICV↔FDs: r(425) = 213, p<.001; ICV↔FDf: r(425) = 178, p<.001]. These relationships were not affected by additionally controlling for effects of sex and site [ICV↔FDs: rp(420) =.194, p<.001; ICV↔FDf : rp(420) =.167, p<.001]. As such, it does not appear that ICV and FD are meaningfully related.
Data Analysis
Previous studies have observed sex differences in cortical thickness (e.g., Herron et al., 2015; Sowell et al., 2007) and fractal dimensionality (Luders et al., 2004), but not gyrification (Hogstrom et al., 2013). Additionally, it is likely that scanning the same individual at a different scanner site would yield differences in estimates of brain morphology (e.g., see Dickerson et al., 2008; Han et al., 2006; Iscan et al., 2015; Jovicich et al., 2013). As such, all of the correlations reported were conducted as partial correlations, controlling for effects of sex and site.
Results
Cortical Ribbon
We first examined correlations between the individuals' age and the complexity of the cortical ribbon, i.e., unparcellated gray matter. In FreeSurfer, the cortical ribbon is output as an intermediate file during the analyses ( ribbon.mgz).
Cortical complexity
As shown in Figure 3 A, cortical complexity, as quantified as the fractal dimensionality of the filled volume (FDf) robustly decreased as a function of age [age↔FDf: rp(425) = −.732, p <.001]. Convergent with prior findings (King et al., 2010), the relationship was weaker when we instead used the fractal dimensionality of the surface (FDs) [age↔FDs: rp(425) = −.719, p<.001]. Nonetheless, the two fractal dimensionality measures were highly correlated [FDf↔FDs: rp(425) = .982, p<.001]. Figure 4 shows the cortical surface for individuals with the high and low FDf values. By comparing these sets of cortical surfaces, it is qualitatively observable that these differ in cortical complexity. The surfaces for these individuals are viewable in an online interactive viewer at: http://brain3d.cmadan.com/IXI-FD/.
Figure 3. Fractal dimensionality (FDf) for the individuals in the IXI dataset.
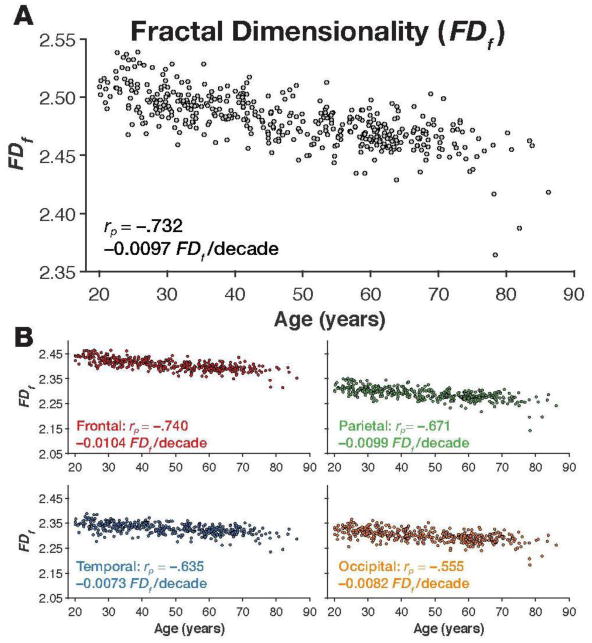
Panel A shows the scatter plot of age and FDf for the cortical ribbon, along with the correlation and slope. Scatter plots of age and FDf for each lobe, are shown in panel B, along with the respective correlations and slopes.
Figure 4. Cortical surfaces for individuals with high and low FDf values, along with their demographic information.

Surfaces for these individuals also viewable in an online interactive viewer at: http://brain3d.cmadan.com/IXI-FD/.
Other cortical measures
For comparison, we calculated the relationship between whole-brain mean cortical thickness and gyrification index. Cortical thickness estimates were calculated as the average of the distance from the white matter surface to the closest possible point on the pial surface, as calculated using the standard FreeSurfer pipeline. Using the output from FreeSurfer for each hemisphere, we averaged the mean cortical thickness for each hemisphere as a weighted average, accounting for hemispheric differences in surface area, yielding an estimate of whole-brain mean cortical thickness; a similar procedure was used to estimate whole-brain gyrification index.
As expected, both whole-brain mean cortical thickness and gyrification index decreased with age [age↔CT: rp(425) = −.603, p<.001; age↔GI: rp(425) = −.494, p<.001] (Figures 5A and 6A), however, both of these relationships were qualitatively weaker than that found with fractal dimensionality of the filled volume. Nonetheless, cortical thickness and gyrification index were only weakly with each other, suggesting that the two cortical measures quantified unique sources of inter-individual variability [CT↔GI: rp(425) = .228, p<.001].
Figure 5. Mean cortical thickness for the individuals in the IXI dataset.
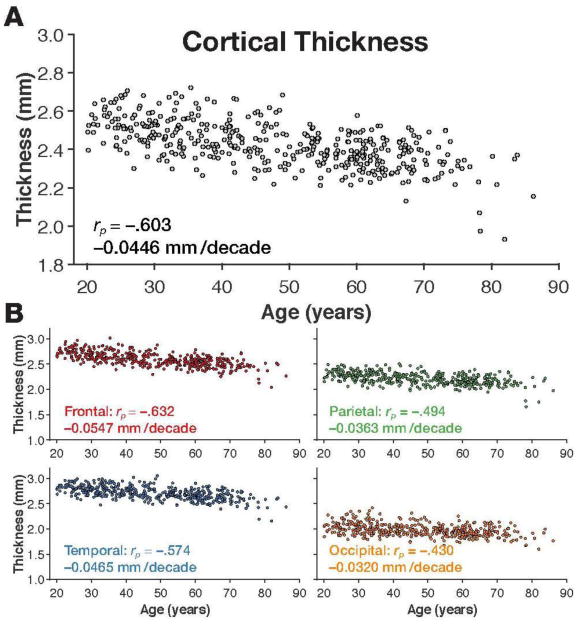
Panel A shows the scatter plot of age and whole-brain mean cortical thickness, along with the correlation and slope. Scatter plots of age and mean cortical thickness for each lobe, are shown in panel B, along with the respective correlations and slopes.
Figure 6. Gyrification index for the individuals in the IXI dataset.
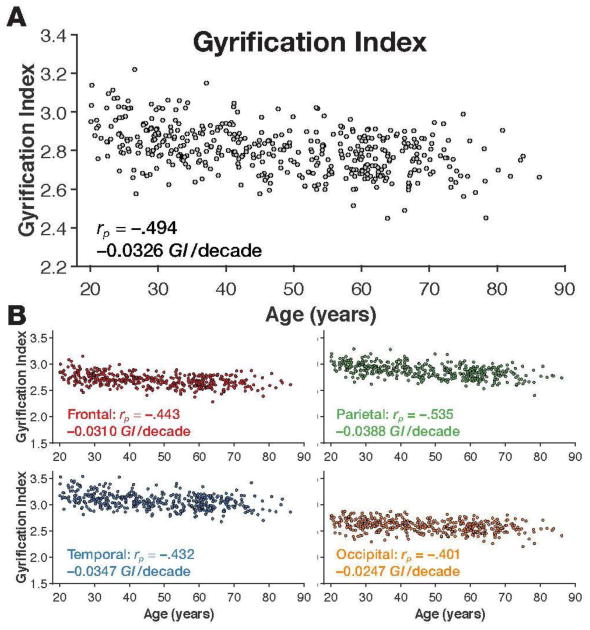
Panel A shows the scatter plot of age and whole-brain gyrification index, along with the correlation and slope. Scatter plots of age and mean gyrification index for each lobe, are shown in panel B, along with the respective correlations and slopes.
Next, we quantitatively evaluated how the two extant measures related to fractal dimensionality. While mean cortical thickness was strongly correlated with both measures of fractal dimensionality, it was more strongly correlated with the fractal dimensionality of the filled volume than of the surface [CT↔FDf: rp(425) = .865, p<.001; CT↔FDs: rp(425) = .783, p<.001]. Conceptually, the main difference between the two measures of fractal dimensionality is that FDf more directly incorporates the volume of the gray matter, suggesting that FDf captures more of the inter-individual variability in cortical volume and thickness than FDs. To test this relationship further, we tested if FDf captured age-related variability above that explained by mean cortical thickness, and vice versa. Using partial correlations, we found that FDf significantly decreased with age, even after accounting for mean cortical thickness [rp(424) = − .525, p<.001]. Mean cortical thickness did not decrease with age, above what could be explained by FDf[rp(424) = .087, p=.075]. However, despite both partial correlations being significant, these results suggest that FDf is a more sensitive quantitative measure of age-related brain atrophy than whole-brain mean cortical thickness.
Gyrification index was strongly correlated with both measures of fractal dimensionality [GI↔FDf: rp(425) = .626, p<.001; GI↔FDs: rp(425) = .702, p<.001]. Using partial correlations, we found that FDf was still strongly correlated with age, even after accounting for the gyrification index [rp(424) = −.623, p<.001]. In contrast, gyrification index was not correlated with age, above what could be explained by FDf [rp(424) = −.066, p=.17]. Thus, whole-brain fractal dimensionality appears to better quantify age-related cortical atrophy than either whole-brain cortical thickness or gyrification index.
Comparing our results with those in the extant literature, in a sample of 70 individuals (35 Alzheimer's patients and 35 age-matched healthy controls), King et al. (2010) found the correlations between fractal dimensionality of the cortical ribbon (i.e., filled volume) and cortical thickness and gyrification index to be r=.832 and r=.555, respectively. In a sample of over 400 healthy adults across the lifespan, here we found these same correlations for cortical thickness and gyrification index to be rp=.863 and rp=.626, respectively. Thus, our calculations relating fractal dimensionality to other cortical measures appear to be in-line with prior findings, but also demonstrate that fractal dimensionality is more sensitive to age-related differences in brain morphology than either cortical thickness or gyrification index. The relatively weak correlation between thickness and gyrification also corresponds well to King et al.'s results, r=.184, whereas we found this relationship to be rp=.228.
Regional Complexity
It is well known that age-related cortical atrophy, as measured by cortical thickness, does not occur homogenously across the cortical surface. Recent cross-sectional and longitudinal studies that investigated age-related differences in cortical thickness have found that the two lobes most affected are the frontal and temporal lobes, while the occipital lobe is the least affected (e.g., Fjell et al., 2009a, 2009b; Hogstrom et al., 2013; Hutton et al., 2009; Salat et al., 2004; Sowell et al., 2003)2. Yet, the regional heterogeneity in age-related differences may vary depending on the metric used. For instance, Hogstrom et al. (2013) found that while frontal and temporal lobes were most correlated with age when cortical thickness was measured, the parietal lobe was most correlated with age when gyrification index was used. Here, we compared the effect of age on cortical complexity, cortical thickness, and gyrification index for each lobe.
Cortical complexity
We calculated the fractal dimensionality of parcellations of gray matter corresponding to each lobe. This was done by using the Desteriux et al. (2010) parcellation protocol, built into the standard FreeSurfer pipeline ( aparc.a2009s+aseg.mgz), where each of the 148 parcellated regions were dummy-coded by lobe. The provided MATLAB toolbox is designed to group together parcellated regions assigned the same dummy-coded label into a binarized volume prior to calculating the fractal dimensionality. As FDf estimates for each lobe were highly correlated across hemispheres [frontal: r(425) = .971, p<.001; parietal: r(425) =.913, p<.001; temporal: r(425) = .903, p<.001; occipital: r(425) =.877, p<.001], here we used bilateral structures for each lobe in subsequent analyses. As shown in Figure 3B, we found age-related decreases in fractal dimensionality to be highest in the frontal lobe [rp(420) = −.740, p<.001], followed by the parietal lobe [rp(420) = −.671, p<.001], while the temporal lobe was the least associated with age-related differences [rp(420) = −.555, p<.001].
Other cortical measures
It was surprising that we found the temporal lobe to be least affected by age-related differences, as measured using fractal dimensionality analyses. However, this discrepancy could be due to the use of a different measure of age atrophy, rather than cortical thickness, or it could be because the individuals in the IXI dataset exhibited less temporal atrophy than is usually found. To distinguish between these two possibilities, we also calculated the mean cortical thickness for each lobe, and similarly correlated each of these sets of values with the individuals' age. As shown in Figure 5B, differences in cortical thickness were most pronounced in the frontal lobe [rp(420) = −.634, p<.001], followed by the temporal lobe [rp(420) = −.574, p<.001].
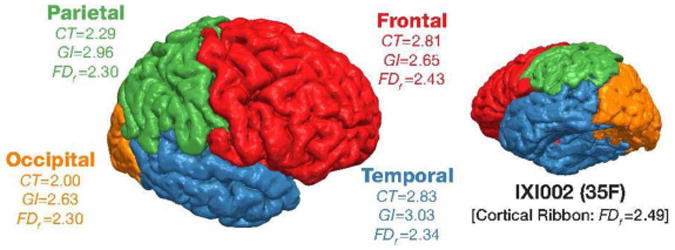
As shown in Figure 6B, we additionally calculated the gyrification index for each lobe and found age-related differences to be greatest in the parietal lobe [rp(420) = −.535, p<.001], and relatively comparable in the frontal and temporal lobes [frontal: rp(420) = −.443, p<.001; temporal: rp(420) = −.432, p<.001]. Thus, lobe gyrification correlated more weakly with age than cortical thickness, and was most pronounced in a different lobe. These results are consistent with prior findings. Hogstrom et al. (2013) similarly found weaker correlations with gyrification index than cortical thickness and found a similar pattern in terms of regional specificity. To provide further insight into these three measures, Figure 7 shows an example cortical surface along with the cortical morphology measures associated with each lobe.
Figure 7. Cortical surface for participant IXI002 from the IXI dataset, colored by lobe parcellation, along with cortical surface measures.
Regional heterogeneity
Given these different patterns of correlations between lobe-wise estimates of each cortical morphology measure and age, we sought to examine differences in how these lobe-wise estimates may correlate. For instance, if inter-individual differences in fractal dimensionality were more homogenous, i.e., more collinear, across the cortex relative to regional variability in cortical thickness. To assess this, we computed the pairwise correlations between all of the lobes using each of our three measures. Figure 8 reports these lobe-wise correlation matrices (i.e., corrgram; Friendly, 2002).
Figure 8. Lobe-wise homogeneity in cortical structure, as measured using cortical thickness, gyrification index, and fractal dimensionality (FDf).
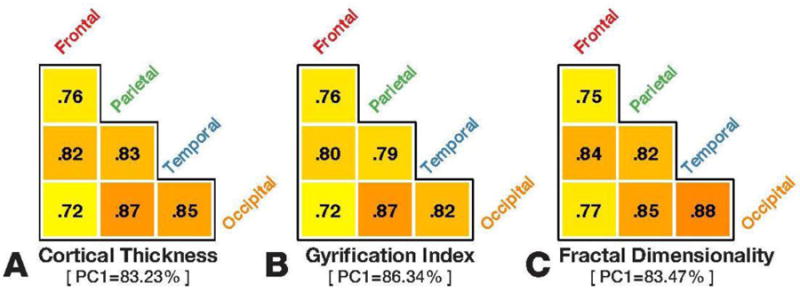
Triangular grids show pair-wise correlations across lobes. Below each grid is the variance explained by the first principal component for each cortical measure.
As shown in Figure 8, the pairwise correlations between lobes were relatively consistent, between the three measures, with all three showing slightly lower correlations for the frontal lobe. Averaging across regions (via Fisher's Z-transform; see Corey et al., 1998) yielded comparable average correlations for both measures [cortical thickness: rp(420, N=6) = .814, p<.001; gyrification index: rp(420, N=6) = .798, p<.001; fractal dimensionality: rp(420, N=6) = .824, p<.001]. As a secondary approach, we also tested if a multivariate approach would be more sensitive to these potential differences in regional homogeneity by conducted principal component analyses (PCA) for each set of values (e.g., lobe-wise estimates of cortical thickness). The first principal component in each case explained between 83% and 86% of the variance (see Figure 8). Thus, it does not appear that any of the measures exhibits more or less regional specificity/collinearity than the others, based on lobe-wise parcellated regions.
Multivariate relationship with age
These differences between regional cortical thickness, gyrification, and complexity suggest that fractal dimensionality analyses may quantify a different aspect of age-related differences in brain structure, rather than being merely a co-varying metric. To test this, we conducted a set of regression models, all with the dependant variable of age (controlling for effects of sex and site), using different sets of predictors related to cortical thickness, gyrification index, and fractal dimensionality (FDf). Here we report the amount of variability in age explained by each set of predictors (i.e., R2). Furthermore, we formally compare the fitness of the models using the Bayesian Information Criterion (BIC), which evaluates model fitness while penalizing models for having more parameters. As a rule of thumb, if the difference between BIC for two model fits is less than two, neither of the models' fit to the data is significantly better (Burnham & Anderson, 2002, 2004). As absolute BIC values themselves are arbitrary, we subtract the BIC value for the best model considered from all BIC values and report ΔBIC for each of the models, as is common practice. As a result, the best model considered is ΔBIC=0.00 by definition. All of the models are listed in Table 1.
Table 1. Multivariate regression models measuring the relationship between cortical thickness, gyrification index, and fractal dimensionality with age.
Models with ΔBIC values with a difference greater than 2 suggest that the model with the lower value is a significantly better fit. See main text for further details.
| Model | Model Parameters | Model Fitness | ||||
|---|---|---|---|---|---|---|
|
|
|
|||||
| Relationship | Regions | Measure | N. Predictors | Var. Explained (R2) | ΔBIC | |
| 1 | Linear | Whole-brain | Cortical Thickness | 1 | 33.55% | 135.91 |
| 2 | (Cortical Ribbon) | Gyrification Index | 1 | 20.61% | 211.88 | |
| 3 | Fractal Dimensionality (FDf) | 1 | 51.66% | 0.00 | ||
| 4 | [All 3] | 3 | 51.72% | 11.63 | ||
|
| ||||||
| 5 | Linear | Lobe-wise | Cortical Thickness | 4 | 38.99% | 117.64 |
| 6 | Parcellations | Gyrification Index | 4 | 26.35% | 198.02 | |
| 7 | Fractal Dimensionality (FDf) | 4 | 53.22% | 4.20 | ||
| 8 | [All 3] | 12 | 56.54% | 21.23 | ||
|
| ||||||
| 9 | Linear & Quadratic | Whole-brain | Cortical Thickness | 2 | 33.59% | 141.71 |
| 10 | (Cortical Ribbon) | Gyrification Index | 2 | 20.62% | 217.90 | |
| 11 | Fractal Dimensionality (FDf) | 2 | 52.13% | 1.90 | ||
| 12 | [All 3] | 6 | 52.39% | 23.86 | ||
|
| ||||||
| 13 | Linear & Quadratic | Lobe-wise | Cortical Thickness | 8 | 38.66% | 119.91 |
| 14 | Parcellations | Gyrification Index | 8 | 26.14% | 199.23 | |
| 15 | Fractal Dimensionality (FDf) | 8 | 53.28% | 3.69 | ||
| 16 | [All 3] | 24 | 59.53% | 63.47 | ||
In the first three models, we input whole-brain cortical thickness, gyrification index, or fractal dimensionality as the predictors, respectively. These three models directly correspond to the correlations shown in Figures 3A, 5A, and 6A. In the fourth model, we used all three— whole-brain estimates of cortical thickness, gyrification index, and fractal dimensionality—as predictors to further test if there is independent variance explained by each metric, even after penalizing for the additional degree of freedom in the model. We found that whole-brain fractal dimensionality explained more variance (i.e., R2) than the other two single predictor models [FDf : 51.7%; CT: 33.5%; GI: 20.6%]. Combining the three measures of cortical structure led to a slight increase in the amount of variability explained [51.7%]; however this increase did not produce a significantly better fit relative to its use of an additional parameter (i.e., ΔBIC between the lowest two models was greater than two).
In the next set of models, we first used lobe-wise measures of cortical thickness, gyrification index, or fractal dimensionality, respectively (models 5-7). In the eighth model, we considered lobe-wise predictors for all three measures, yielding a total of twelve predictors. Again we found that the fractal dimensionality explained more of the variance in age than the other two measures, though there was still an additional benefit of combining all three measures. The lobe-wise regional estimates of fractal dimensionality also provided a small but significant improvement in predictive value relative to the whole-brain estimate (i.e., comparing models 7 and 3).
Many studies have found that age-related differences in cortical thickness are not linearly related to age; often a quadratic term is additionally included in the regression model (e.g., Crivello et al., 2014; Hogstrom et al., 2013; McKay et al., 2014; Sowell et al., 2003; Thambisetty et al., 2010; Walhovd et al., 2011), however, interpreting the beta coefficients must be done with caution (see Fjell et al., 2010). Hogstrom et al. (2013) also found significant quadratic relationships between age and gyrification index, suggesting that including these non-linear effects would be beneficial to include in our regression models here. To this end, we re-ran the above eight models, incorporating both linear and quadratic terms for each of the included predictors.
In nearly all of the eight cases, the models that included the quadratic component only slightly outperformed the equivalent models that only contained a linear component; this benefit was not sufficient to compensate for the additional parameters used (i.e., BIC). Across the 16 models, the linear-only whole-brain fractal-dimensionality model (model 3) explained the most variability in age, relative to the number of parameters it used. Specifically, it was able to explain 51.7% of the variance with only one parameter. The highest amount of variability explained, of all of the models considered, was 59.5%.
Figure 9 summarizes our findings of age-related differences across the three structural measures, for the entire cortical ribbon and individual lobe-wise parcellations.
Figure 9. Relationship between each cortical structure measure (cortical thickness, gyrification index, and fractal dimensionality [FDf]) with age, for the entire cortical ribbon and individual lobe-wise parcellations.
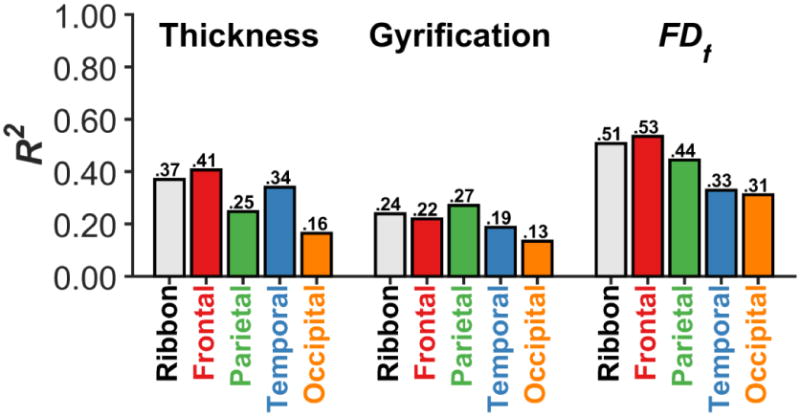
Each bar represents the R2 for a quadratic regression model with age.
Considering the influence of age-related artifacts in MRI acquisition
Recent research has demonstrated that head motion during MRI acquisition can lead to lower estimates of cortical thickness (Reuter et al., 2015). This is of particular relevance when investigating the association between brain structure and aging, as older adults tend to move their heads during MRI scanning more than young adults (Andrews-Hanna et al., 2007; Salat, 2014; Van Dijk et al., 2012). Thus, MRI measurements of cortical thickness would be influenced by both objectively thinner cortex and age-related differences in head motion during MRI acquisition. Since the cortical complexity calculations presented here are based on the cortical ribbon (or subregions of it), it is likely plausible that FDf would also be affected by head motion. As a coarse approach to evaluate whether the age-related differences in cortical complexity would remain even without age differences in motion, we additionally computed fractal dimensionality from post-mortem structural MRIs (thus void of motion) from individuals who donated their brain to science, obtained from the Allen Human Brain Atlas. Currently there are MRIs available from eight donors (who did not have any psychological or neurological disorders), however FreeSurfer was unable to estimate the surface for one of the donors (H0351.1009). The seven donors used in these analyses, and their demographic details, are: H0351.1012 (31M), H0351.1015 (49F), H0351.1016 (55M), H0351.2001 (24M), H0351.2002 (39M), H0351.2003 (48F), H372.0006 (44M). The structural MRIs are freely available from: http://human.brain-map.org/mri_viewers/data (see Allen Institute for Brain Science, 2013, for the MRI acquisition parameters).
As before, we calculated six measures: fractal dimensionality (FDf), mean cortical thickness, and gyrification index across the entire cortical ribbon, and mean cortical thickness and FDf for each lobe.
Even in this small sample, we did observe age-related decreases in FDf (Figure 10A-B). Here we also found the rank-order of FDf values across lobes to be consistent with our findings in the IXI dataset (i.e., Figure 3B): frontal, temporal, parietal, occipital.
Figure 10. Mean cortical thickness, gyrification index, and fractal dimensionality (FDf) for the individuals in the Allen Human Brain Atlas dataset.
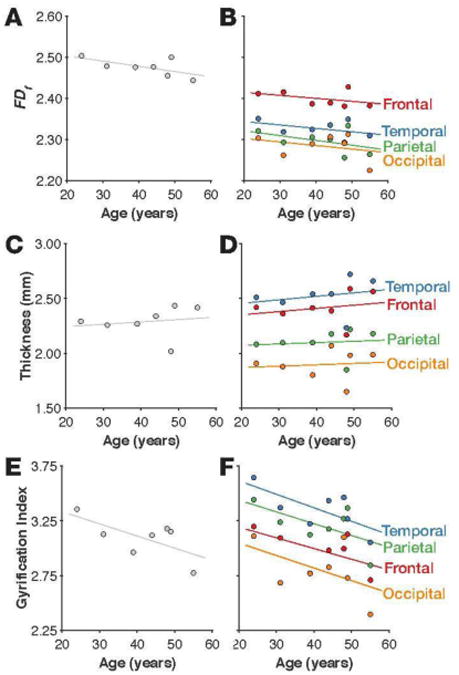
Fractal dimensionality for the whole-brain and each lobe are shown in panels A and B. Mean cortical thickness and gyrification index for the whole-brain and each lobe are shown in panels C-F.
As shown in Figures 10C-D, age-related differences in mean cortical thickness did not appear to decrease with age. As this is cross-sectional data from a small sample, this is not necessarily concerning. The rank-order of cortical thickness across the lobes did match with our findings in the IXI dataset (i.e., Figure 5B): temporal, frontal, parietal, occipital. Figures 10E-F show that we still did observe age-related declines in gyrification, and that the rank-order across the lobes was again consistent with our findings in the IXI dataset (i.e., Figure 6B): temporal, parietal, frontal, occipital.
Thus, this dataset provides preliminary evidence that age-related differences in cortical complexity (FDf) are present even when head motion cannot influence the MRI acquisition, and potentially also suggests that FDf may be more robust to age-related differences in brain morpohology than mean cortical thickness.
Discussion
Here we demonstrate that fractional dimensionality of gray matter is sensitive to age-related differences in cortical structure and, in fact, can be more sensitive to age-related differences than other metrics of cortical integrity such as cortical thickness or gyrification. We also provide evidence that fractional dimensionality is not redundant with these other metrics; multivariate regression models that include multiple metrics provide the best ability to track age-related differences. Fractional dimensionality therefore appears to be a useful metric for studies of cognitive aging, and with this in mind, we additionally provide a new toolbox to facilitate other researchers incorporating fractional dimensionality into their investigations of age-related cognitive differences.
Previous research has shown that fractal dimensionality of the filled volume, e.g., cortical ribbon, is related to both cortical thickness and gyrification index (King et al., 2009, 2010). However, our findings clearly show that fractal dimensionality also indexes other facets of cortical morphology that result in a stronger correlation with age: Age-related correlations with each of the cortical measures were notably higher for fractal dimensionality [FDf: rp=−.732; CT: rp=−.603; GI: rp=−.494]. We speculate that one possibility is that measurements of cortical complexity are better able to capture differences in the organization of cortical regions than other measures such as cortical thickness. It is also likely that fractal dimensionality is less susceptible to some artifacts than other measures, making it more sensitive to age-related differences. For example, while measures of cortical structure relate to age-related atrophy and cognitive abilities, they also are influenced by ‘nuisance’ factors such as hydration (Streitbürger et al., 2012) and head movement (e.g., Reuter et al., 2015). It is plausible that cortical thickness may be more readily influenced by these types of state changes than gyrification and cortical complexity. Thus, considering several metrics (e.g., thickness, gyrification, and complexity) will allow researchers to better index relevant differences in cortical structure.
Our regional analyses present an additional interesting finding: the degree of age-related differences in morphology are not consistent across measures. As others have found, the frontal and temporal lobes were more affected by age-related differences than the parietal or occipital lobes, when measured using estimates of cortical thickness (but see footnote 1). However, age-related differences were most prevalent in the parietal lobe when measured using gyrification. There were some commonalities across measures: With both cortical thickness and gyrification, we found that the occipital lobe was least affected by age-related differences. We observed a different pattern with fractal dimensionality, where the temporal lobe was the least affected by age-related differences. These differences provides evidence that fractal dimensionality is not merely pooling information that otherwise would be quantified by cortical thickness or gyrificiation index, but is also capturing additional age-related differences in the cortical structure.
In addition to correlating with age, fractal dimensionality has been shown to correlate with inter-individual variability in cognitive measures. In a cohort of over 200 adults aged about 68 years old, Mustafa et al. (2012) found that individuals with greater whole-brain white-matter complexity had higher fluid intelligence scores and less evidence of age-related cognitive decline (also see Sandu et al., 2014). King et al. (2010) also provide evidence that fractal dimensionality of the cortical ribbon correlated with scores on a cognitive battery, and that this correlation was qualitatively stronger than comparable correlations using cortical thickness and gyrification index. Im et al. (2006) observed correlations between whole-brain fractal dimensionality and both IQ and years of education, though lobe-wise correlations were not significant. Interestingly, the correlations with education were slightly stronger than those with IQ, potentially suggesting an influence of education-related development on cortical complexity. These findings support the use of cortical complexity as a sensitive metric not only for age-related differences in brain structure but also for capturing relations between brain structure and cognitive function.
We believe that fractal dimensionality provides an important additional measure of brain structures, providing us with a means to consider differences in the shape of structures, rather the size (e.g., volume, thickness). While here we measured changes in relatively coarse parcellations of the cortex (i.e., lobes), more fine-grained parcellations of cortical and subcortical regions can be calculated, and may be particularly useful when relating FD estimates to cognitive measures. As a proof-of-principle, in the Appendix we report age-related differences in volume and FDf for the hippocampus (see Figure A4). While some studies have been done comparing FD between healthy controls and patient populations, these were done using whole-brain measures and could also benefit from more fine-grained parcellations. It is also unclear how head motion may affect estimates of FD. To this end, we additionally provide our code as a MATLAB toolbox such that other researchers can also readily calculate fractal dimensionality in their analyses.
MATLAB Toolbox
Given the utility of fractional dimensionality, we provide a freely available MATLAB toolbox to calculate the fractal dimensionality of the cortical ribbon or parcellated regions of cortex, using intermediate files generated as part of the standard FreeSurfer analysis pipeline ( ribbon.mgz, aparc.a2009s+aseg.mgz), or directly from other 3D volumes. The toolbox includes options to use different masking files (and related documentation on making the masks) and is implemented to use either the box-counting or dilation algorithms and to use either the filled volume or just the surface of the structure. The toolbox can easily be run on all of the participants in a FreeSurfer subject folder, or just on specified subject folders. The toolbox can be downloaded from: http://cmadan.github.io/calcFD/.
The MATLAB toolbox also includes several functions designed to improve functionality, such as the automatic ‘cropping’ of the volume space to the smallest bounding box necessary to contain the volume (while leaving sufficient space for the dilation of the volume), improving computation time drastically. Example files are also provided to aid in using the toolbox for the user's needs. All of the presented fractal dimensionality measures were obtained using the provided toolbox without any further modification. On our machine, the FD calculations, using the dilation algorithm on filled volumes (what most of the results are based on), took an average of 11 seconds per participant for the whole-brain and 96 seconds per participant to determine the FDf for each of the four bilateral lobes. As a general recommendation, we suggest using the dilation algorithm on the filled structures.
Acknowledgments
Portions of this research were supported by a grant from the National Institutes of Health (MH080833; to E.A.K.) and by funding provided by Boston College. The MRI data used in the preparation of this article were obtained from the Information eXtraction from Images (IXI) dataset (http://brain-development.org/ixi-dataset/; funded by Engineering and Physical Sciences Research Council [EPSRC] of the UK [EPSRC GR/S21533/02]) and the Allen Human Brain Atlas (http://human.brain-map.org/mri_viewers/data).
Appendix
Benchmark Performance
To evaluate the performance of the fractal dimensionality calculations, ten simulated phantom volumes were constructed in MATLAB and saved in FreeSurfer's native .mgz format, and are provided with the toolbox.
The first two structures were a sphere with a diameter of 200 voxels and a cube with a width of 200 voxels. The next volumes were constructed to be a more complex structure, the Menger sponge. Briefly, a Menger sponge is a cube-based 3-dimensional fractal, where the cube is divided into a 9×9×9 grid and the middle sub-cubes from every face are removed, as well as the center-most sub-cube. Thus, of the 27 sub-cubes (i.e., 93), only 20 remain. One iteration of this procedure is shown in Figure A1. This procedure can be infinitely iteratively repeated for each of the sub-cubes, theoretically producing a structure with infinite surface area, but zero volume. The Menger sponge is related to two 2-dimensional fractals, the Cantor set and the Sierpinski carpet. Here we constructed three Menger sponges, each with a width of 200 voxels: first-iteration, second-iteration, and fourth-iteration. (A cube can be considered a zero-iteration Menger sponge.) These five structures are shown in the upper row of Figure A1.
We additionally computed the fractal dimensionality of several more complex structures, as shown in the lower row of Figure A1. The first three of these structures were selected because they have been used as ‘standard’ benchmark objects in the 3D modelling and rendering literature: the Newell Teapot, Stanford Bunny, and Stanford Armadillo (e.g., Crow, 1987; Labatut et al., 2009). (Note, the teapot has a wall thickness and is hollow inside, i.e., it is not a ‘filled’ teapot.) A mug was included as a simple everyday object. The “Fiber Cup” was included as a more complex object that was developed as a ground-truth phantom volume for DTI analyses. The structural volume used here was reproduced from Figure 1 of Fillard et al. (2011) as we were unable to obtain the original 3D volume. (The thickness of our volume does not match the original as it was reproduced from only a 2D image.)
Figure A1. 3D renderings of the benchmark structures used.
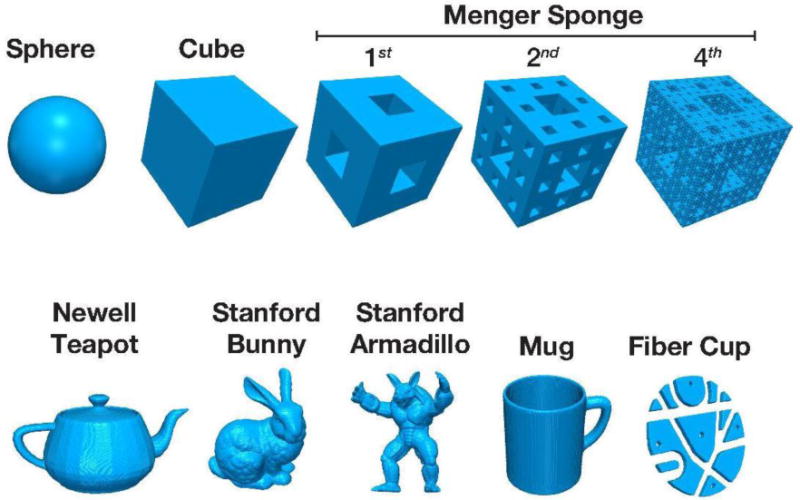
See main text and Table 1 for further details.
Table A1 shows the benchmark statistics for each of these structures. Note, because we are calculating the surface area in voxels, the calculations are not the same as if the structures had surfaces with no thickness. For instance, in the cube, voxels that are part of the upper edge of a side should not be counted again as part of the top. As a result, the surface area of the cube in voxels would not be 240,000 (i.e., 2002×6), but is instead 237,608 (i.e., 2003–1983). Similarly, because surface area is calculated as ‘surface’ voxels, the SA/V ratio cannot become smaller than 1, i.e., every surface voxel counts towards the volume and there are no ‘inner’ voxels.
Though fractal dimensionality is usually calculated only based on the surface of the structure, King et al. (2010) found that additionally counting the ‘filled’ volume can lead to better measurements of age-related differences in cortical complexity, an approach that has also been used in a number of other studies (e.g., Esteban et al., 2009; Im et al., 2006; Kiselev et al., 2003). Here we computed two measures of fractal dimensionality, one based on only the surface structure (FDs) and one that also includes the filled volume (FDf).
Table A1. Benchmark statistics for each of the benchmark structures (shown in Figure A1).
The geometric properties of each structure include the length of the longest dimension (L), volume (V), surface area (SA), and the ratio of volume to surface area (V/SA). Fractal dimensionality was calculated using four different methods, using either the box-counting or dilation algorithms, and either only counting the surface voxels of the structure (FDs) or also including the filled volume of the structure (FDf).
| Structure | Geometric | Box-Counting | Dilation | |||||
|---|---|---|---|---|---|---|---|---|
|
|
|
|
||||||
| L | V | SA | V/SA | FDs | FDf | FDs | FDf | |
| Sphere | 200 | 4,187,854 | 186,053 | 22.51 | 1.99 | 2.89 | 2.00 | 2.89 |
| Cube | 200 | 8,000,000 | 237,608 | 33.67 | 1.97 | 2.97 | 2.00 | 2.92 |
| Menger-1 | 200 | 5,961,392 | 316,792 | 18.82 | 1.98 | 2.91 | 2.00 | 2.88 |
| Menger-2 | 200 | 4,447,440 | 517,016 | 8.60 | 2.02 | 2.81 | 2.03 | 2.78 |
| Menger-4 | 200 | 2,477,920 | 1,921,376 | 1.29 | 2.46 | 2.60 | 2.49 | 2.56 |
|
| ||||||||
| Newell Teapot | 225 | 1,119,692 | 90,899 | 12.32 | 2.03 | 2.81 | 2.02 | 2.81 |
| Stanford Bunny | 221 | 2,211,262 | 167,897 | 13.17 | 2.03 | 2.81 | 2.01 | 2.82 |
| Stanford Armadillo | 225 | 825,402 | 121,628 | 6.77 | 2.03 | 2.68 | 2.02 | 2.69 |
| Mug | 220 | 1,113,980 | 340,802 | 3.27 | 2.14 | 2.53 | 2.13 | 2.56 |
| Fiber Cup | 223 | 245,102 | 69,926 | 3.41 | 1.96 | 2.40 | 2.00 | 2.46 |
Theoretically, a cube should have fractal dimensionality values corresponding to 2 and 3 for the surface and filled volumes, respectively. A sphere should have a surface fractal dimensionality of 2, and a filled fractal dimensionality slightly below 3. Our results match with these values well.
For the Menger sponge volumes, an nth iteration structure, which has infinite surface area and zero volume, should have a surface fractal dimensionality of 2.73. We can see that the higher-iteration Menger sponge structures have increasing surface fractal dimensionality values, but we could not generate higher-iteration structures of comparable resolution as brain volumes (i.e., constraints of voxel coordinate space). We also see that the filled fractal dimensionality decreases with higher iterations, as expected.
Though the theoretical fractal dimensionality values are not known for the remaining structures, their inclusion is intended to aid the reader in understanding how fractal dimensionality relates to a structure's complexity. Additionally, the simulated phantom volumes for all ten structures are included with the toolbox, allowing them to serve as benchmarks for future work.
Formal comparison
To formally compare the two algorithms, box counting and dilation, we generated 3D box structures that were based on a random subset of cubes in a 20×20×20 arrangement. For each structure, we computed the filled fractal dimensionality (FDf) using both the box-counting and dilation algorithms. This was repeated for 10,000 simulated structures.
Generally, the algorithms were highly correlated in their fractal dimensionality estimates and deviations were minimal in magnitude [r(9998)=.9997, p<.001; Difference: M (SD) = .0263 (.0096)]. Nonetheless, we did find that the box-counting FDf was nearly always higher than the FDf obtained using the dilation algorithm, as shown in Figure A2. Logically, this is due to a cumulative rounding error from the box-counting algorithm using a fixed grid scan, while the dilation is effectively using a sliding grid scan. This bias was higher for structures with more extreme levels of fractal dimensionality (i.e., near to either 2 or 3). Based on this comparison, we used the dilation algorithm in the reported cortical complexity analyses, though both algorithms are implemented in the MATLAB toolbox.
Figure A2. Comparison between fractal dimensionality values (FDf) obtained using the box-counting and dilation algorithms.
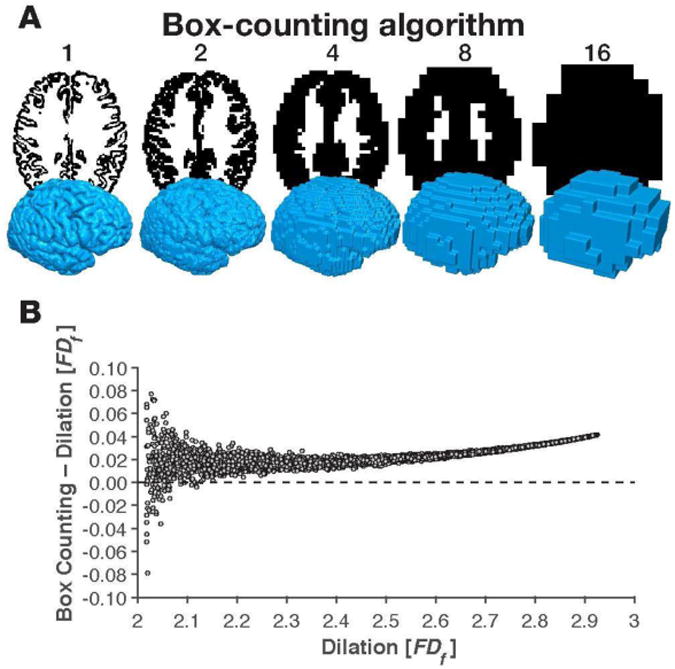
Panel A shows axial slices and 3D volumes representing the box-counting algorithm (compare with Figure 2A). Panel B shows a formal comparison between the two algorithms.
IXI Dataset
IDs for the 427 individuals included in the analyses reported here: 002, 012, 014, 015, 017, 019, 020, 021, 022, 023, 024, 025, 026, 027, 028, 029, 030, 031, 033, 034, 035, 036, 037, 039, 040, 042, 043, 044, 045, 046, 048, 049, 050, 051, 052, 053, 054, 055, 056, 057, 058, 060, 061, 062, 063, 064, 065, 067, 068, 069, 070, 071, 073, 074, 075, 076, 077, 078, 079, 080, 083, 084, 085, 086, 087, 089, 090, 092, 097, 098, 102, 105, 106, 107, 109, 110, 111, 113, 115, 118, 119, 120, 121, 122, 123, 126, 127, 128, 129, 130, 131, 134, 135, 137, 138, 140, 141, 142, 143, 144, 145, 148, 150, 151, 153, 154, 157, 158, 159, 160, 161, 163, 164, 166, 167, 169, 170, 172, 173, 174, 176, 177, 178, 180, 181, 182, 183, 184, 185, 186, 188, 189, 191, 192, 193, 195, 196, 197, 198, 200, 201, 202, 204, 205, 206, 207, 209, 212, 213, 214, 216, 217, 218, 219, 221, 222, 224, 225, 226, 227, 230, 231, 232, 233, 234, 237, 238, 239, 240, 241, 242, 244, 246, 247, 248, 249, 251, 253, 254, 255, 258, 259, 262, 264, 265, 266, 268, 269, 270, 275, 276, 277, 278, 279, 280, 282, 284, 285, 286, 287, 289, 290, 291, 294, 295, 296, 297, 298, 299, 304, 305, 306, 307, 308, 310, 311, 312, 315, 316, 318, 319, 320, 321, 322, 324, 325, 326, 328, 329, 332, 334, 335, 336, 338, 342, 344, 348, 350, 351, 353, 354, 356, 357, 358, 359, 360, 362, 363, 364, 365, 367, 368, 369, 370, 371, 372, 373, 375, 377, 378, 379, 380, 385, 386, 387, 388, 389, 390, 391, 392, 393, 396, 397, 398, 399, 401, 402, 403, 405, 408, 410, 411, 412, 414, 415, 418, 419, 420, 422, 427, 428, 431, 433, 434, 436, 437, 438, 439, 441, 442, 444, 445, 446, 447, 449, 450, 451, 452, 453, 454, 455, 456, 458, 459, 460, 461, 462, 467, 468, 469, 473, 474, 475, 476, 477, 478, 480, 482, 484, 485, 486, 487, 490, 493, 494, 495, 496, 498, 500, 502, 504, 505, 507, 508, 510, 516, 517, 522, 524, 525, 526, 527, 528, 531, 532, 534, 535, 536, 538, 539, 543, 544, 546, 547, 548, 549, 550, 551, 553, 554, 558, 559, 560, 561, 562, 563, 565, 566, 567, 568, 569, 572, 573, 574, 575, 576, 577, 578, 579, 582, 586, 587, 588, 591, 592, 593, 594, 595, 598, 601, 603, 605, 606, 607, 609, 612, 613, 614, 616, 617, 618, 621, 625, 626, 627, 629, 631, 634, 639, 640, 641, 642, 644, 648, 652, 653, 662
Figure A3. Examples of issues with cortical surfaces that resulted in exclusion.
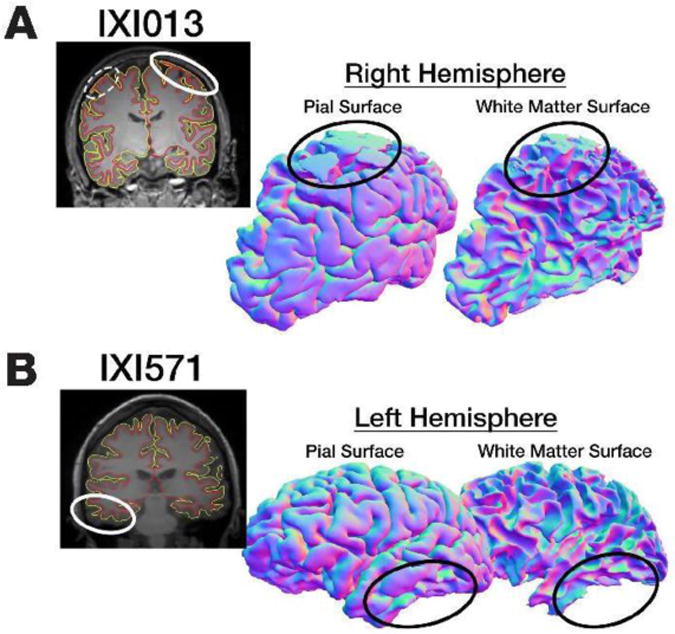
Panel A shows an example of the surface boundary being too inclusive and including tissue surrounding the gray matter; panel B shows an example of the surface reconstruction being too restrictive and missing portions of gray matter.
Subcortical Volumes
As a proof-of-principle, we have calculated the age-related differences in the hippocampus, as measured as using volume and FDf. Hippocampal volume was estimated using FreeSurfer, and the sum of the left and right hemisphere volumes was used in the analysis. Prior to computing the partial correlation (controlling for sex and site), volume was taken as the residual after regressing on ICV (e.g., see Walhovd et al., 2011). Fractal dimensionlity (of the filled structure) was calculated based on the bilateral structure, using the provided toolbox. We observed age-related differences in both hippocampal volume and structural complexity [volume: rp(420) = −.342, p<.001; FDf : rp(420) = − .273, p<.001].
Figure A4. Hippocampal volume and fractal dimensionality (FDf) for the individuals in the IXI dataset.
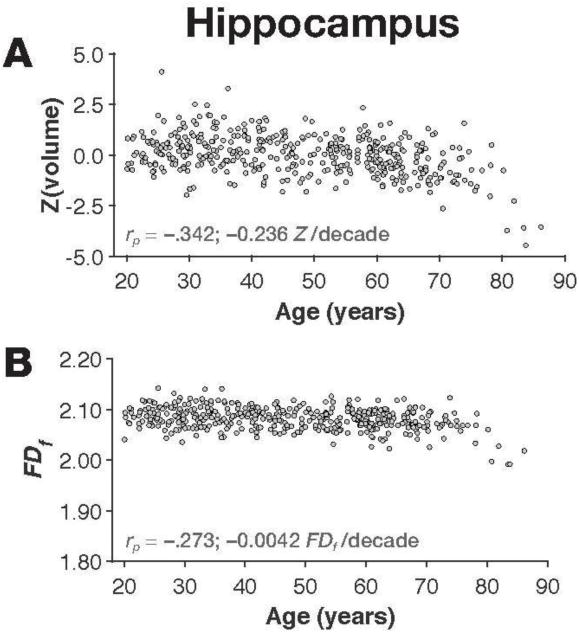
Panel A shows the scatter plot of age and volume, along with the correlation and slope; panel B shows age and FDf.
Footnotes
These surface reconstruction errors are likely related to the images having insufficient signal intensity to differentiate gray matter from surrounding tissue and CSF, a problem that has been shown to be related to age (Salat et al., 2009). FD estimates would likely have been under-estimated for these individuals, and would have potentially led to over-estimation of age-related differences in FD.
However, some longitudinal studies suggest that the frontal and parietal lobes are the most affected by aging (e.g., Crivello et al., 2014; Resneck et al., 2003; Thambisetty et al., 2010).
Publisher's Disclaimer: This is a PDF file of an unedited manuscript that has been accepted for publication. As a service to our customers we are providing this early version of the manuscript. The manuscript will undergo copyediting, typesetting, and review of the resulting proof before it is published in its final citable form. Please note that during the production process errors may be discovered which could affect the content, and all legal disclaimers that apply to the journal pertain.
References
- Allen Institute for Brain Science. Allen Human Brain Atlas: Microarray Survey. Technical White Paper October 2013. 2013;7 [Google Scholar]
- Andrews-Hanna JR, Snyder AZ, Vincent JL, Lustig C, Head D, Raichle ME, Buckner RL. Disruption of large-scale brain systems in advanced aging. Neuron. 2007;56:924–935. doi: 10.1016/j.neuron.2007.10.038. [DOI] [PMC free article] [PubMed] [Google Scholar]
- Ardekani BA, Bachman AH. Model-based automatic detection of the anterior and posterior commissures on MRI scans. NeuroImage. 2009;46:677–682. doi: 10.1016/j.neuroimage.2009.02.030. [DOI] [PMC free article] [PubMed] [Google Scholar]
- Barnes J, Ridgway GR, Bartlett J, Henley SMD, Lehmann M, Hobbs N, et al. Fox NC. Head size, age and gender adjustment in MRI studies: a necessary nuisance? NeuroImage. 2010;53:1244–1255. doi: 10.1016/j.neuroimage.2010.06.025. [DOI] [PubMed] [Google Scholar]
- Buckner RL, Head D, Parker J, Fotenos AF, Marcus D, Morris JC, Snyder AZ. A unified approach for morphometric and functional data analysis in young, old, and demented adults using automated atlas-based head size normalization: reliability and validation against manual measurement of total intracranial volume. NeuroImage. 2004;23:724–738. doi: 10.1016/j.neuroimage.2004.06.018. [DOI] [PubMed] [Google Scholar]
- Burnham KE, Anderson DR. Model selection and multimodel inference. 2nd. New York: Springer-Verlag; 2002. [Google Scholar]
- Burnham KP, Anderson DR. Multimodel inference: Understanding AIC and BIC in model selection. Sociological Methods & Research. 2004;33:261–304. doi: 10.1177/0049124104268644. [DOI] [Google Scholar]
- Caserta F, Eldred WD, Fernandez E, Hausman RE, Stanford LR, Bulderev SV, et al. Stanley HE. Determination of fractal dimension of physiologically characterized neurons in two and three dimensions. Journal of Neuroscience Methods. 1995;56:133–144. doi: 10.1016/0165-0270(94)00115-w. [DOI] [PubMed] [Google Scholar]
- Coffey CE, Wilkinson WE, Parashos LA, Soady SAR, Sullivan RJ, Patterson LJ, et al. Djang WT. Quantitative cerebral anatomy of the aging human brain: A cross- sectional study using magnetic resonance imaging. Neurology. 1992;42:527–527. doi: 10.1212/wnl.42.3.527. [DOI] [PubMed] [Google Scholar]
- Cook MJ, Free SL, Manford MRA, Fish DR, Shorvon SD, Stevens JM. Fractal description of cerebral cortical patterns in frontal lobe epilepsy. European Neurology. 1995;35:327–335. doi: 10.1159/000117155. [DOI] [PubMed] [Google Scholar]
- Corey DM, Dunlap WP, Burke MJ. Averaging Correlations: Expected values and bias in combined Pearson r's and Fisher's Z transformations. Journal of General Psychology. 1998;125:245–261. doi: 10.1080/00221309809595548. [DOI] [Google Scholar]
- Crivello F, Tzourio-Mazoyer N, Tzourio C, Mazoyer B. Longitudinal assessment of global and regional rate of grey matter atrophy in 1,172 healthy older adults: Modulation by sex and age. PLOS ONE. 2014;9:e114478. doi: 10.1371/journal.pone.0114478. [DOI] [PMC free article] [PubMed] [Google Scholar]
- Crow F. The Origins of the teapot. IEEE Computer Graphics and Applications. 1987;7:8–19. doi: 10.1109/mcg.1987.277023. [DOI] [Google Scholar]
- de Souza J, Pires Rostirolla S. A fast MATLAB program to estimate the multifractal spectrum of multidimensional data: Application to fractures. Computers & Geosciences. 2011;37:241–249. doi: 10.1016/j.cageo.2010.09.001. [DOI] [Google Scholar]
- Destrieux C, Fischl B, Dale A, Halgren E. Automatic parcellation of human cortical gyri and sulci using standard anatomical nomenclature. NeuroImage. 2010;53:1–15. doi: 10.1016/j.neuroimage.2010.06.010. [DOI] [PMC free article] [PubMed] [Google Scholar]
- Di Ieva A, Esteban FJ, Grizzi F, Klonowski W, Martin-Landrove M. Fractals in the neurosciences, Part II: Clinical applications and future perspectives. The Neuroscientist. 2015;21:30–43. doi: 10.1177/1073858413513928. [DOI] [PubMed] [Google Scholar]
- Di Ieva A, Grizzi F, Jelinek H, Pellionisz AJ, Losa GA. Fractals in the neurosciences, Part I: General principles and basic neurosciences. The Neuroscientist. 2014;20:403–417. doi: 10.1177/1073858413513927. [DOI] [PubMed] [Google Scholar]
- Dickerson BC, Fenstermacher E, Salat DH, Wolk DA, Maguire RP, Desikan R, et al. Fischl B. Detection of cortical thickness correlates of cognitive performance: Reliability across MRI scan sessions, scanners, and field strengths. NeuroImage. 2008;39:10–18. doi: 10.1016/j.neuroimage.2007.08.042. [DOI] [PMC free article] [PubMed] [Google Scholar]
- Esteban FJ, Sepulcre J, de Miras JR, Navas J, de Mendizábal NV, Goñi J, et al. Villoslada P. Fractal dimension analysis of grey matter in multiple sclerosis. Journal of the Neurological Sciences. 2009;282:67–71. doi: 10.1016/j.jns.2008.12.023. [DOI] [PubMed] [Google Scholar]
- Farahibozorg S, Hashemi-Golpayegani SM, Ashburner J. Age- and sex-related variations in the brain white matter fractal dimension throughout adulthood: An MRI study. Clinical Neuroradiology. 2015;25:19–32. doi: 10.1007/s00062-013-0273-3. [DOI] [PMC free article] [PubMed] [Google Scholar]
- Fernández E, Jelinek HF. Use of fractal theory in neuroscience: Methods, advantages, and potential problems. Methods. 2001;24:309–321. doi: 10.1006/meth.2001.1201. [DOI] [PubMed] [Google Scholar]
- Fillard P, Descoteaux M, Goh A, Gouttard S, Jeurissen B, Malcolm J, et al. Poupon C. Quantitative evaluation of 10 tractography algorithms on a realistic diffusion MR phantom. NeuroImage. 2011;56:220–234. doi: 10.1016/j.neuroimage.2011.01.032. [DOI] [PubMed] [Google Scholar]
- Fischl B. FreeSurfer. NeuroImage. 2012;62:774–781. doi: 10.1016/j.neuroimage.2012.01.021. [DOI] [PMC free article] [PubMed] [Google Scholar]
- Fischl B, Dale AM. Measuring the thickness of the human cerebral cortex from magnetic resonance images. Proceedings of the National Academy of Sciences USA. 2000;97:11050–11055. doi: 10.1073/pnas.200033797. [DOI] [PMC free article] [PubMed] [Google Scholar]
- Fischl B, Salat DH, Busa E, Albert M, Dieterich M, Haselgrove C, et al. Dale AM. Whole brain segmentation: Automated labelling of neuroanatomical structures in the human brain. Neuron. 2002;33:341–355. doi: 10.1016/s0896-6273(02)00569-x. [DOI] [PubMed] [Google Scholar]
- Fjell AM, Walhovd KB, Fennema-Notestine C, McEvoy LK, Hagler DJ, Holland D, et al. Dale AM. One-year brain atrophy evident in healthy aging. Journal of Neuroscience. 2009b;29:15223–15231. doi: 10.1523/jneurosci.3252-09.2009. [DOI] [PMC free article] [PubMed] [Google Scholar]
- Fjell AM, Walhovd KB, Westlye LT, Østby Y, Tamnes CK, Jernigan TL, et al. Dale AM. When does brain aging accelerate? Dangers of quadratic fits in cross-sectional studies. NeuroImage. 2010;50:1376–1383. doi: 10.1016/j.neuroimage.2010.01.061. [DOI] [PubMed] [Google Scholar]
- Fjell AM, Westlye LT, Amlien I, Espeseth T, Reinvang I, Raz N, et al. Walhovd KB. High consistency of regional cortical thinning in aging across multiple samples. Cerebral Cortex. 2009a;19:2001–2012. doi: 10.1093/cercor/bhn232. [DOI] [PMC free article] [PubMed] [Google Scholar]
- Franke K, Ziegler G, Klöppel S, Gaser C. Estimating the age of healthy subjects from T1-weighted MRI scans using kernel methods: Exploring the influence of various parameters. NeuroImage. 2010;50:883–892. doi: 10.1016/j.neuroimage.2010.01.005. [DOI] [PubMed] [Google Scholar]
- Free SL, Sisodiya SM, Cook MJ, Fish DR, Shorvon SD. Three-dimensional fractal analysis of the white matter surface from magnetic resonance images of the human brain. Cerebral Cortex. 1996;6:830–836. doi: 10.1093/cercor/6.6.830. [DOI] [PubMed] [Google Scholar]
- Friendly M. Corrgrams: Exploratory displays for correlation matricies. American Statistician. 2002;56:316–324. doi: 10.1198/000313002533. [DOI] [Google Scholar]
- Ganzetti M, Wenderoth N, Mantini D. Whole brain myelin mapping using T1- and T2-weighted MR imaging data. Frontiers in Human Neuroscience. 2014;8 doi: 10.3389/fnhum.2014.00671. [DOI] [PMC free article] [PubMed] [Google Scholar]
- Ge Y, Grossman RI, Babb JS, Rabin ML, Mannon LJ, Kolson DL. Age-related total gray matter and white matter changes in normal adult brain, Part I: Volumetric MR imaging analysis. American Journal of Neuroradiology. 2002;23:1327–1333. [PMC free article] [PubMed] [Google Scholar]
- Goñi J, Sporns O, Cheng H, Aznárez-Sanado M, Wang Y, Josa S, et al. Pastor MA. Robust estimation of fractal measures for characterizing the structural complexity of the human brain: Optimization and reproducibility. NeuroImage. 2013;83:646–657. doi: 10.1016/j.neuroimage.2013.06.072. [DOI] [PMC free article] [PubMed] [Google Scholar]
- Han X, Jovicich J, Salat D, van der Kouwe A, Quinn B, Czanner S, et al. Fischl B. Reliability of MRI-derived measurements of human cerebral cortical thickness: The effects of field strength, scanner upgrade and manufacturer. NeuroImage. 2006;32:180–194. doi: 10.1016/j.neuroimage.2006.02.051. [DOI] [PubMed] [Google Scholar]
- Hayes SM, Alosco ML, Forman DE. The effects of aerobic exercise on cognitive and neural decline in aging and cardiovascular disease. Current Geriatrics Reports. 2014;3:282–290. doi: 10.1007/s13670-014-0101-x. [DOI] [PMC free article] [PubMed] [Google Scholar]
- Herron TJ, Kang X, Woods DL. Sex differences in cortical and subcortical human brain anatomy. F1000Resarch. 2015;4:88. doi: 10.12688/f1000research.6210.1. [DOI] [Google Scholar]
- Hogstrom LJ, Westlye LT, Walhovd KB, Fjell AM. The structure of the cerebral cortex across adult Life: Age-related patterns of surface area, thickness, and gyrification. Cerebral Cortex. 2013;23:2521–2530. doi: 10.1093/cercor/bhs231. [DOI] [PubMed] [Google Scholar]
- Hou XJ, Gilmore R, Mindlin GB, Solari HG. An efficient algorithm for fast box counting. Physics Letters A. 1990;151:43–46. doi: 10.1016/0375-9601(90)90844-e. [DOI] [Google Scholar]
- Hutton C, Draganski B, Ashburner J, Weiskopf N. A comparison between voxel-based cortical thickness and voxel-based morphometry in normal aging. NeuroImage. 2009;48:371–380. doi: 10.1016/j.neuroimage.2009.06.043. [DOI] [PMC free article] [PubMed] [Google Scholar]
- Im K, Lee JM, Yoon U, Shin YW, Hong SB, Kim IY, et al. Kim SI. Fractal dimension in human cortical surface: Multiple regression analysis with cortical thickness, sulcal depth, and folding area. Human Brain Mapping. 2006;27:994–1003. doi: 10.1002/hbm.20238. [DOI] [PMC free article] [PubMed] [Google Scholar]
- Iscan Z, Jin TB, Kendrick A, Szeglin B, Lu H, Trivedi M, et al. DeLorenzo C. Test-retest reliability of FreeSurfer measurements within and between sites: Effects of visual approval process. Human Brain Mapping. 2015;36:3472–3485. doi: 10.1002/hbm.22856. [DOI] [PMC free article] [PubMed] [Google Scholar]
- Jernigan TL, Archibald SL, Berhow MT, Sowell ER, Foster DS, Hesselink JR. Cerebral structure on MRI, Part I: Localization of age-related changes. Biological Psychiatry. 1991;29:55–67. doi: 10.1016/0006-3223(91)90210-d. [DOI] [PubMed] [Google Scholar]
- Jovicich J, Marizzoni M, Sala-Llonch R, Bosch B, Bartrés-Faz D, Arnold J, et al. Frisoni GB. Brain morphometry reproducibility in multi-center 3T MRI studies: A comparison of cross-sectional and longitudinal segmentations. NeuroImage. 2013;83:472–484. doi: 10.1016/j.neuroimage.2013.05.007. [DOI] [PubMed] [Google Scholar]
- Kemper TL. Neuroanatomical and neuropathological changes during aging and dementia. In: Albert ML, Knoefel JE, editors. Clinical neurology of aging. 2nd. New York: Oxford University Press; 1994. pp. 3–67. [Google Scholar]
- King RD, Brown B, Hwang M, Jeon T, George AT. Fractal dimension analysis of the cortical ribbon in mild Alzheimer's disease. NeuroImage. 2010;53:471–479. doi: 10.1016/j.neuroimage.2010.06.050. [DOI] [PMC free article] [PubMed] [Google Scholar]
- King RD, George AT, Jeon T, Hynan LS, Youn TS, Kennedy DN, Dickerson B. Characterization of atrophic changes in the cerebral cortex using fractal dimensional analysis. Brain Imaging and Behavior. 2009;3:154–166. doi: 10.1007/s11682-008-9057-9. [DOI] [PMC free article] [PubMed] [Google Scholar]
- Kiselev VG, Hahn KR, Auer DP. Is the brain cortex a fractal? NeuroImage. 2003;20:1765–1774. doi: 10.1016/s1053-8119(03)00380-x. [DOI] [PubMed] [Google Scholar]
- Kochunov P, Rogers W, Mangin JF, Lancaster J. A Library of Cortical Morphology Analysis Tools to Study Development, Aging and Genetics of Cerebral Cortex. Neuroinformatics. 2012;10(1):81–96. doi: 10.1007/s12021-011-9127-9. [DOI] [PMC free article] [PubMed] [Google Scholar]
- Koutsouleris N, Davatzikos C, Borgwardt S, Gaser C, Bottlender R, Frodl T, et al. Meisenzahl E. Accelerated brain aging in schizophrenia and beyond: A neuroanatomical marker of psychiatric disorders. Schizophrenia Bulletin. 2014;40:1140–1153. doi: 10.1093/schbul/sbt142. [DOI] [PMC free article] [PubMed] [Google Scholar]
- Labatut P, Pons JP, Keriven R. Robust and efficient surface reconstruction from range data. Computer Graphics Forum. 2009;28:2275–2290. doi: 10.1111/j.1467-8659.2009.01530.x. [DOI] [Google Scholar]
- Luders E, Narr KL, Thompson PM, Rex DE, Jancke L, Steinmetz H, Toga AW. Gender differences in cortical complexity. Nat Neurosci. 2004;7(8):799–800. doi: 10.1038/nn1277. [DOI] [PubMed] [Google Scholar]
- Madan CR. Creating 3D visualizations of MRI data: A brief guide. F1000Research. 2015;4:466. doi: 10.12688/f1000research.6838.1. [DOI] [PMC free article] [PubMed] [Google Scholar]
- Mandelbrot B. How long is the coast of Britain? Statistical self-similarity and fractional dimension. Science. 1967;156:636–638. doi: 10.1126/science.156.3775.636. [DOI] [PubMed] [Google Scholar]
- Mandelbrot BB. The Fractal Geometry of Nature. San Francisco: W.H. Freeman; 1982. [Google Scholar]
- McKay DR, Knowles EEM, Winkler AAM, Sprooten E, Kochunov P, Olvera RL, et al. Glahn DC. Influence of age, sex and genetic factors on the human brain. Brain Imaging and Behavior. 2014;8:143–152. doi: 10.1007/s11682-013-9277-5. [DOI] [PMC free article] [PubMed] [Google Scholar]
- Mietchen D, Gaser C. Computational morphometry for detecting changes in brain structure due to development, aging, learning, disease and evolution. Frontiers in Neuroinformatics. 2009;3:25. doi: 10.3389/neuro.11.025.2009. [DOI] [PMC free article] [PubMed] [Google Scholar]
- Mustafa N, Ahearn TS, Waiter GD, Murray AD, Whalley LJ, Staff RT. Brain structural complexity and life course cognitive change. NeuroImage. 2012;61:694–701. doi: 10.1016/j.neuroimage.2012.03.088. [DOI] [PubMed] [Google Scholar]
- Nenadic I, Yotter RA, Sauer H, Gaser C. Cortical surface complexity in frontal and temporal areas varies across subgroups of schizophrenia. Human Brain Mapping. 2014;35:1691–1699. doi: 10.1002/hbm.22283. [DOI] [PMC free article] [PubMed] [Google Scholar]
- Passe TJ, Rajagopalan P, Tupler LA, Byrum CE, Macfall JR, Krishnan KRR. Age and sex effects on brain morphology. Progress in Neuro-Psychopharmacology and Biological Psychiatry. 1997;21:1231–1237. doi: 10.1016/s0278-5846(97)00160-7. [DOI] [PubMed] [Google Scholar]
- Raz N, Rodrigue KM. Differential aging of the brain: Patterns, cognitive correlates and modifiers. Neuroscience & Biobehavioral Reviews. 2006;30:730–748. doi: 10.1016/j.neubiorev.2006.07.001. [DOI] [PMC free article] [PubMed] [Google Scholar]
- Raz N, Gunning FM, Head D, Dupuis JH, McQuain J, Briggs SD, et al. Acker JD. Selective aging of the human cerebral cortex observed in vivo: differential vulnerability of the prefrontal gray matter. Cerebral Cortex. 1997;7:268–282. doi: 10.1093/cercor/7.3.268. [DOI] [PubMed] [Google Scholar]
- Resnick SM, Goldszal AF, Davatzikos C, Golski S, Kraut MA, et al. Zonderman AB. One-year age changes in mri brain volumes in older adults. Cerebral Cortex. 2000;10:464–472. doi: 10.1093/cercor/10.5.464. [DOI] [PubMed] [Google Scholar]
- Resnick SM, Pham DL, Kraut MA, Zonderman AB, Davatzikos C. Longitudinal magnetic resonance imaging studies of older adults: A shrinking brain. Journal of Neuroscience. 2003;23:3295–3301. doi: 10.1523/JNEUROSCI.23-08-03295.2003. [DOI] [PMC free article] [PubMed] [Google Scholar]
- Reuter M, Tisdall MD, Qureshi A, Buckner RL, van der Kouwe AJW, Fischl B. Head motion during MRI acquisition reduces gray matter volume and thickness estimates. NeuroImage. 2015;107:107–115. doi: 10.1016/j.neuroimage.2014.12.006. [DOI] [PMC free article] [PubMed] [Google Scholar]
- Robinson EC, Hammers A, Ericsson A, Edwards AD, Rueckert D. Identifying population differences in whole-brain structural networks: A machine learning approach. NeuroImage. 2010;50:910–919. doi: 10.1016/j.neuroimage.2010.01.019. [DOI] [PubMed] [Google Scholar]
- Rogers J, Kochunov P, Zilles K, Shelledy W, Lancaster J, Thompson P, et al. Glahn DC. On the genetic architecture of cortical folding and brain volume in primates. NeuroImage. 2010;53:1103–1108. doi: 10.1016/j.neuroimage.2010.02.020. [DOI] [PMC free article] [PubMed] [Google Scholar]
- Salat DH. Diffusion tensor imaging in the study of aging and age-associated neural disease. In: Johansen-Berg H, Behrens TEJ, editors. Diffusion MRI: From Quantitative Measurement to In vivo Neuroanatomy. 2nd. San Diego: Academic Press; 2014. pp. 257–281. [DOI] [Google Scholar]
- Salat DH, Buckner RL, Snyder AZ, Greve DN, Desikan RSR, et al. Fischl B. Thinning of the cerebral cortex in aging. Cerebral Cortex. 2004;14:721–730. doi: 10.1093/cercor/bhh032. [DOI] [PubMed] [Google Scholar]
- Salat DH, Lee SY, van der Kouwe AJ, Greve DN, Fischl B, Rosas HD. Age-associated alterations in cortical gray and white matter signal intensity and gray to white matter contrast. NeuroImage. 2009;48:21–28. doi: 10.1016/j.neuroimage.2009.06.074. [DOI] [PMC free article] [PubMed] [Google Scholar]
- Sandu AL, Rasmussen IA, Lundervold A, Kreuder F, Neckelmann G, Hugdahl K, Specht K. Fractal dimension analysis of MR images reveals grey matter structure irregularities in schizophrenia. Computerized Medical Imaging and Graphics. 2008;32:150–158. doi: 10.1016/j.compmedimag.2007.10.005. [DOI] [PubMed] [Google Scholar]
- Sandu AL, Staff RT, McNeil CJ, Mustafa N, Ahearn T, Whalley LJ, Murray AD. Structural brain complexity and cognitive decline in late life: A longitudinal study in the Aberdeen 1936 Birth Cohort. NeuroImage. 2014;100:558–563. doi: 10.1016/j.neuroimage.2014.06.054. [DOI] [PubMed] [Google Scholar]
- Sargolzaei S, Sargolzaei A, Cabrerizo M, Chen G, Goryawala M, Pinzon-Ardila A, et al. Adjouadi M. Estimating intracranial volume in brain research: An evaluation of methods. Neuroinformatics. 2015;13:427–441. doi: 10.1007/s12021-015-9266-5. [DOI] [PubMed] [Google Scholar]
- Schaer M, Cuadra MB, Schmansky N, Fischl B, Thiran JP, Eliez S. How to measure cortical folding from MR images: A step-by-step tutorial to compute local gyrification index. Journal of Visualized Experiments. 2012;59:e3417. doi: 10.3791/3417. [DOI] [PMC free article] [PubMed] [Google Scholar]
- Sowell ER, Peterson BS, Kan E, Woods RP, Yoshii J, Bansal R, et al. Toga AW. Sex differences in cortical thickness mapped in 176 healthy individuals between 7 and 87 years of age. Cerebral Cortex. 2007;17:1550–1560. doi: 10.1093/cercor/bhl066. [DOI] [PMC free article] [PubMed] [Google Scholar]
- Sowell ER, Peterson BS, Thompson PM, Welcome SE, Henkenius AL, Toga AW. Mapping cortical change across the human life span. Nature Neuroscience. 2003;6:309–315. doi: 10.1038/nn1008. [DOI] [PubMed] [Google Scholar]
- Steiner I, Gomori JM, Melamed E. Progressive brain atrophy during normal aging in man: A quantitative computerized tomography study. Israel Journal of Medical Sciences. 1985;21:279–282. [PubMed] [Google Scholar]
- Storsve AB, Fjell AM, Tamnes CK, Westlye LT, Overbye K, Aasland HW, Walhovd KB. Differential longitudinal changes in cortical thickness, surface area and volume across the adult life span: Regions of accelerating and decelerating change. Journal of Neuroscience. 2014;34:8488–8498. doi: 10.1523/jneurosci.0391-14.2014. [DOI] [PMC free article] [PubMed] [Google Scholar]
- Streitbürger DP, Möller HE, Tittgemeyer M, Hund-Georgiadis M, Schroeter ML, Mueller K. Investigating structural brain changes of dehydration using voxel-based morphometry. PLOS ONE. 2012;7:e44195. doi: 10.1371/journal.pone.0044195. [DOI] [PMC free article] [PubMed] [Google Scholar]
- Tang YY, Hölzel BK, Posner MI. The neuroscience of mindfulness meditation. Nature Reviews Neuroscience. 2015;16:213–225. doi: 10.1038/nrn3916. [DOI] [PubMed] [Google Scholar]
- Thambisetty M, Wan J, Carass A, An Y, Prince JL, Resnick SM. Longitudinal changes in cortical thickness associated with normal aging. NeuroImage. 2010;52:1215–1223. doi: 10.1016/j.neuroimage.2010.04.258. [DOI] [PMC free article] [PubMed] [Google Scholar]
- Thompson PM, Lee AD, Dutton RA, Geaga JA, Hayashi KM, Eckert MA, et al. Reiss AL. Abnormal cortical complexity and thickness profiles mapped in Williams syndrome. Journal of Neuroscience. 2005;25:4146–4158. doi: 10.1523/jneurosci.0165-05.2005. [DOI] [PMC free article] [PubMed] [Google Scholar]
- Thompson PM, Schwartz C, Lin RT, Khan AA, Toga AW. Three-dimensional statistical analysis of sulcal variability in the human brain. Journal of Neuroscience. 1996;16:4261–4274. doi: 10.1523/JNEUROSCI.16-13-04261.1996. [DOI] [PMC free article] [PubMed] [Google Scholar]
- Toro R, Perron M, Pike B, Richer L, Veillette S, Pausova Z, Paus T. Brain size and folding of the human cerebral cortex. Cerebral Cortex. 2008;18:2352–2357. doi: 10.1093/cercor/bhm261. [DOI] [PubMed] [Google Scholar]
- Van Dijk KRA, Sabuncu MR, Buckner RL. The influence of head motion on intrinsic functional connectivity MRI. NeuroImage. 2012;59:431–438. doi: 10.1016/j.neuroimage.2011.07.044. [DOI] [PMC free article] [PubMed] [Google Scholar]
- Walhovd KB, Westlye LT, Amlien I, Espeseth T, Reinvang I, Raz N, et al. Fjell AM. Consistent neuroanatomical age-related volume differences across multiple samples. Neurobiology of Aging. 2011;32:916–932. doi: 10.1016/j.neurobiolaging.2009.05.013. [DOI] [PMC free article] [PubMed] [Google Scholar]
- Winkler AM, Kochunov P, Blangero J, Almasy L, Zilles K, Fox PT, et al. Glahn DC. Cortical thickness or grey matter volume? The importance of selecting the phenotype for imaging genetics studies. NeuroImage. 2010;53:1135–1146. doi: 10.1016/j.neuroimage.2009.12.028. [DOI] [PMC free article] [PubMed] [Google Scholar]
- Wiśniewski HM, Terry RD. Morphology of the aging brain, human and animal. Progress in Brain Research. 1973;40:167–186. doi: 10.1016/s0079-6123(08)60686-x. [DOI] [PubMed] [Google Scholar]
- Wu YT, Shyu KK, Jao CW, Wang ZY, Soong BW, Wu HM, Wang PS. Fractal dimension analysis for quantifying cerebellar morphological change of multiple system atrophy of the cerebellar type (MSA-C) NeuroImage. 2010;49:539–551. doi: 10.1016/j.neuroimage.2009.07.042. [DOI] [PubMed] [Google Scholar]
- Yotter RA, Nenadic I, Ziegler G, Thompson PM, Gaser C. Local cortical surface complexity maps from spherical harmonic reconstructions. NeuroImage. 2011;56:961–973. doi: 10.1016/j.neuroimage.2011.02.007. [DOI] [PubMed] [Google Scholar]
- Zhang L, Dean D, Liu JZ, Sahgal V, Wang X, Yue GH. Quantifying degeneration of white matter in normal aging using fractal dimension. Neurobiology of Aging. 2007;28:1543–1555. doi: 10.1016/j.neurobiolaging.2006.06.020. [DOI] [PubMed] [Google Scholar]
- Ziegler G, Dahnke R, Jäncke L, Yotter RA, May A, Gaser C. Brain structural trajectories over the adult lifespan. Human Brain Mapping. 2012;33:2377–2389. doi: 10.1002/hbm.21374. [DOI] [PMC free article] [PubMed] [Google Scholar]


