

Abstract
Background
Cost-related non-adherence (CRN) is prevalent among individuals with diabetes and can have significant negative health consequences. We examined health and non-health-related pressures and the use of cost-reducing strategies among the U.S. adult population with and without diabetes that may impact CRN.
Methods
Data from the 2013 wave of National Health Interview Survey (n=34,557) were used to identify the independent impact of perceived financial stress, financial insecurity with healthcare, food insecurity, and cost-reducing strategies on CRN.
Results
11% (n=4,158) of adults reported diabetes. 14% with diabetes reported CRN, compared to 7% without. Greater perceived financial stress (Prevalence Ratio (PR)=1.07 [95% CI: 1.05 to 1.09]), financial insecurity with healthcare (PR=1.6 [95% CI: 1.5 to 1.67]), and food insecurity (PR=1.30 [95% CI: 1.2 to 1.4]) were all associated with a greater likelihood of CRN. Asking the doctor for a lower cost medication was associated with a lower likelihood of CRN (PR=0.2 [95% CI: 0.2 to 0.3]), and 27% with CRN reported this. Other cost-reducing behavioral strategies (using alternative therapies, buying prescriptions overseas) were associated with a greater likelihood of CRN.
Conclusions
Half of adults with diabetes perceived financial stress, and one-fifth reported financial insecurity with healthcare and food insecurity. Talking to a health care provider about low-cost options may be protective against CRN in some situations. Improving screening and communication to identify CRN and increase transparency of low-cost options patients are pursuing may help safeguard from the health consequences of cutting back on treatment.
Keywords: Diabetes, cost-related non-adherence, financial stress
INTRODUCTION
Lack of affordability is one of the primary reasons why patients do not adhere to therapeutic recommendations (20% of the U.S. population), and this problem is especially concerning among those who manage a chronic condition.1 Cost-related non-adherence (CRN) to treatment plans may put chronically-ill patients at risk for avoidable complications. CRN may include taking a smaller or less frequent dose of medications, delaying or not fulfilling therapeutic recommendations, and borrowing medicines from others.2 The relationship between risk factors and CRN is complex, and contributing factors go beyond objectively-measured financial resources. Some low-income individuals report continuing to take their medication as prescribed despite serious cost pressures, while some high-income individuals or those with generous insurance coverage may engage in CRN despite manageable out-of-pocket costs.3,4
Studies report rates of CRN between 20–40% among people with diabetes, and further investigation of contributing factors are needed to inform effective screening and counseling practices in this group to reduce the high rates of complications that worsen health status.2,5 CRN is associated with worse glycemic control and declines in functioning.6 People with diabetes have medical expenditures 3 times higher to those without diabetes,7 and as a result, face challenges with adhering to their diabetes regimens, with only about a quarter adhering to all of their medicines.8,9 Comorbidity contributes to CRN. One-third of Medicare Beneficiaries with diabetes report having 5 or more chronic conditions.10
Several studies suggest that social determinants of health that contribute to financial burdens are not easily identifiable in a clinical encounter and may be important risk factors for CRN and poor diabetes outcomes. Associations between perceived financial burden and poor glucose control among diabetes patients in outpatient clinics have been observed.11 Rates of food insecurity are as high as 54% among older adults with diabetes12, and those pressures may lead to decreased adherence to diabetes self-care behaviors and worse glycemic control.13,14,15 Dietary regimens are common therapeutic strategies integral to prevention and effective management of chronic disease, yet also vulnerable to CRN. National Health Interview Survey (NHIS) data have shown that 1 in 3 chronically ill adults report that they are unable to afford food, medication or both, and CRN is more common among those with food insecurity.16
Among those managing chronic illness, two-thirds of patients who engage in CRN never tell their physicians17, and the ability of physicians’ to identify such patients remains poor.18 Fewer than half of patients with diabetes report discussing the cost of medications with their physicians, although over 75% express that such communications were important.19 One study with diabetes patients has shown that those who use alternative therapies are more likely to engage in CRN.20
We are not aware of any studies that have examined whether health and non-health related financial stress, influence diabetes patients’ risk of CRN. We are also not aware of any nationally representative studies that have examined whether patients who engage in different cost-reducing behaviors such as asking the doctor for a lower cost regimen or using alternative therapies have higher or lower rates of CRN. Such inquiry may have implications for improved screening practices to identify patients who may be engaging in CRN, and the design of interventions to promote adherence despite the costs that patients experience, especially for individuals who manage diabetes.
Using the 2013 NHIS, our aim was to 1) examine health and non-health-related financial burden risk factors for CRN and cost-reducing behavioral strategies utilized among adults with diabetes compared to those without, and 2) examine the associations between burdens, cost-reducing strategies, and CRN among those with diabetes. We hypothesized that risk factors for CRN would be more pronounced among those with diabetes compared to those without, the magnitude of each risk factor on CRN would be high for those with diabetes, and cost-reducing strategies would be associated with lower rates of CRN.
METHODS
Data Source
The NHIS is a cross-sectional household interview survey of a nationally representative sample of noninstitutionalized households that comprise 90,000 individuals from 35,000 families each year.21 The NHIS uses a complex, multistage area probability sample design.21 From each participant family, one adult is randomly selected, and information on them is collected with the Sample Adult Core questionnaire. Written informed consent was collected for all participates.
Analytic Sample
The current study analyzed NHIS data from 2013. The analytic sample included only adults ages 18 years of age and older. The final unweighted sample included 34,557 adults (weighted response rate of 81.7%), and 4,158 of these individuals were identified as having diabetes, based on affirmative responses to the question: “Have you ever been told by a doctor or other health professional that you have diabetes or sugar diabetes?”
Measures
We used the 22 questions (see Table 1) focused on financial pressures to identify four possible domains of economic burden that might influence respondents’ risk of CRN. We used principal axis factor analysis with a varimax rotation to identify multi-item measures: CRN behaviors, perceived financial stress, financial insecurity with healthcare, and food insecurity. Items with factor loadings greater than 0.60 were included within a factor. Cronbach’s α evaluated internal consistency of each factor.
Table 1.
Characteristics of financial burden items from exploratory factor analysis, National Health Interview Survey 2013.
| Factor Loadings | ||||
|---|---|---|---|---|
| Survey items | CRN behaviors | Perceived Financial Stress | Financial insecurity with healthcare | Food insecurity |
| Couldn’t afford dental care, past 12 m | 0.1 | 0.1 | 0.6 | 0.1 |
| Couldn’t afford eyeglasses, past 12 m | 0.1 | 0.1 | 0.6 | 0.1 |
| Couldn’t afford to see a specialist, past 12 m | 0.2 | 0.1 | 0.7 | 0.04 |
| Couldn’t afford follow-up care, past 12 m | 0.2 | 0.1 | 0.7 | −0.0 |
| How worried are you about…medical costs of healthcare | 0.2 | 0.8 | 0.2 | −0.0 |
| How worried are you about…paying rent/mortgage/housing costs | 0.04 | 0.7 | 0.1 | 0.2 |
| How worried are you about…medical costs of illness/accident | 0.2 | 0.8 | 0.2 | −0.04 |
| How worried are you about…paying monthly bills | 0.05 | 0.8 | 0.1 | 0.2 |
| How worried are you about…money for retirement | 0.06 | 0.7 | 0.1 | 0.1 |
| How worried are you about…maintaining standard of living | 0.12 | 0.8 | 0.1 | 0.1 |
| Cut size or skipped meals because not enough money | 0.12 | 0.01 | 0.1 | 0.6 |
| Could not afford to eat balanced meals | −0.02 | 0.03 | 0.1 | 0.7 |
| Food did not last before had money to get more | 0.01 | 0.04 | 0.1 | 0.8 |
| Worried food would run out before got money to buy more | 0.05 | 0.1 | 0.03 | 0.8 |
| Skipped medication doses to save money, past 12 m | 0.8 | 0.1 | 0.1 | 0.1 |
| Took less medicine to save money, past 12 m | 0.8 | 0.1 | 0.1 | 0.1 |
| Delayed filling a prescription to save money, past 12 m | 0.8 | 0.2 | 0.2 | 0.1 |
| Any family member delay seeking medical care, 12m? | 0.2 | 0.1 | 0.3 | 0.03 |
| Medical bills being paid off over time | 0.02 | 0.1 | −0.1 | −0.1 |
| Couldn’t afford prescription medicine, past 12 m | 0.5 | 0.1 | 0.4 | 0.1 |
| Couldn’t afford mental health care/counseling, past 12 m | 0.1 | 0.02 | 0.4 | 0.1 |
| How worried are you about…credit card payments | −0.04 | 0.3 | −0.1 | −0.02 |
| How worried are you about…paying for children’s college | 0.1 | 0.3 | −0.0 | −0.1 |
| Unable to pay medical bills | 0.0 | 0.1 | 0.2 | 0.2 |
| Get sick or have accident, worried about paying medical bills | 0.2 | 0.5 | 0.2 | −0.04 |
| Cronbach alpha coefficient α | 0.9 | 0.9 | 0.7 | 0.9 |
Cost-Related Non-Adherence (CRN)
The main outcome of interest was CRN measured by three items (α = 0.9) that asked participants whether they engaged in any of the following behaviors over the past 12 months to save money (yes versus no): skipped medication doses, took less medicine, and delayed filling a prescription. CRN was analyzed as a dichotomous variable, with a positive response to any of the three items indicating CRN to accommodate differences in compensatory behaviors individuals may engage in.22
Perceived financial stress
Perceived financial stress was measured by six items (α = 0.9) that asked how worried the respondent was about 1) medical costs of healthcare, 2) paying rent/mortgage/housing costs, 3) medical costs of an illness/accident, 4) paying monthly bills, 5) not having enough money for retirement, 6) maintaining standard of living. All items were measured on a 4-point Likert scale ranging from ‘very worried’ to ‘not worried at all’. For descriptive analyses, each item was dichotomized based on the distribution of responses. For regression models, all items were summed to create a score for perceived financial stress that ranged from 4 – 24, with higher scores indicating greater stress.
Financial insecurity with healthcare
Financial insecurity with healthcare was measured by four items (α = 0.7) that asked participants if during the past 12 months they could not afford 1) dental care, 2) eyeglasses, 3) seeing a specialist, or 4) follow-up care. All items were measured by a dichotomous response option. For regression models, all items were summed to create a score for financial insecurity with healthcare that ranged from 0–4, with higher scores indicating greater financial insecurity.
Food insecurity
Food insecurity was measured by four items (α = 0.9) that asked participants if 1) they cut the size of or skipped meals because they did not have money (y/n), and how often it was true that 2) they could not afford to eat balanced meals, 3) food did not last before they had money to get more, 4) they worried food would run out before they got money to buy more. The last 3 items were measured on a 3-point Likert scale ranging from ‘never true’ to ‘often true’, and were dichotomized based on the distribution of responses (used for descriptive analyses). For regression models, all items were then summed to create a score for food insecurity that ranged from 0 – 4, with higher scores indicating greater food insecurity.
Changes to health insurance coverage
Changes to health insurance coverage was assessed with the following item: “At any time during the past 12 months, did changes take place related to your health insurance” (y/n).
Cost-reducing strategies
Behavioral strategies to manage medication costs were examined. Specifically, respondents reported whether in the past 12 months they engaged in each of the following behaviors to save money: 1) asked their doctor for a lower cost medication (y/n), 2) used alternative therapies (y/n), and 3) bought prescription drugs from another country (y/n). They were also asked about participation in government assistance programs such as WIC, SNAP, receipt of welfare income, or programs that provide rent support.
Clinical characteristics and demographic characteristics were also measured.
Analyses
Analyses used SAS (v.9.4) and SUDAAN (v.11.01) taking the NHIS sampling design and survey weights into account in order to produce nationally representative estimates. Data were weighted using the full sample one-year health interview weight for NHIS. Statistical significance was assigned based on a Type 1 error level of α=0.05 or 95% CI for estimates of population statistics.
Population-based estimates of characteristics of adults with and without diabetes in the U.S. were estimated using SAS 9.4 Proc SurveyFreq and Proc SurveyMeans commands. Estimates were compared using Student’s T tests and chi-square tests of independence with the Rao-Scott complex sample design adjustment.
After creating the four composite measures of potential risk factors for CRN described previously, we examined differences between respondents with and without diabetes with respect to these risk factors (perceived financial stress, financial insecurity with healthcare, food insecurity, and changes to health insurance coverage), and items assessing cost-reducing behavioral strategies (asked their doctor for a lower cost medication, used alternative therapies, bought prescription drugs from another country, used government assistance programs). All estimates were compared using chi-square tests of independence with the Rao-Scott complex sample design adjustment.
Multivariate Poisson regression was used to examine the relationship between potential predictors of CRN, including factors related to health and non-health-related economic burden, and cost-reducing behavioral strategies. The interaction of burden-items and age, as well as cost-reducing behavioral strategies and burden items on CRN were also further examined. Models were estimated in SUDAAN with Taylor Series variance estimation to account for the complex sample design. Models were estimated using the NHIS analysis weight and were adjusted for age, income-to-needs ratio, health insurance, and additionally for burden-related items for models examining cost-reducing behavioral strategies on CRN.
RESULTS
The mean age of the sample was 46 years, and 48% were male. Eleven percent (n=4,158) reported physician-diagnosed diabetes. Compared to the population without diabetes, adults with diabetes were older (60 versus 45 years, p<0.001), and included a higher percentage of individuals who identified as Black/African American (p<0.001), met federal guidelines for poverty (p<0.001), and were covered by health insurance (p<0.001) (Table 2). Respondents with diabetes also reported higher body mass index (BMI) and obesity (p<0.001), and a greater average number of comorbidities (p<0.001) compared to respondents without diabetes.
Table 2.
Sample characteristics of the population with and without diabetes.
| Factor | Total (N=34,708) % [95% CI] |
No Diabetes (N=30,527) % [95% CI] |
Diabetes (N=4,158) % [95% CI] |
|---|---|---|---|
|
|
|
|
|
| Age (Mean [95% CI]) | 46.7 [46.4 to 47.0] |
45.1 [44.8 to 45.4] |
60.3 [59.7 to 60.9] |
| Male | 48.1 [47.4 to 48.8] |
47.9 [47.2 to 48.7] |
49.6 [47.7 to 51.4] |
| Race/Ethnicity | |||
| White/Caucasian | 81.7 [81.0 to 82.3] |
82.0 [81.4 to 82.7] |
78.8 [77.0 to 80.4] |
| Black/African American | 13.1 [12.5 to 13.7] |
12.7 [12.1 to 13.3] |
16.3 [14.8 to 17.8] |
| American Indian | 0.8 [0.6 to 1.0] |
0.8 [0.6 to 1.0] |
1.1 [0.6 to 1.7] |
| Asian | 3.9 [3.6 to 4.2] |
4.0 [3.6 to 4.3] |
3.4 [2.6 to 4.2] |
| Multiple Race | 0.3 [0.2 to 0.3] |
0.3 [0.2 to 0.4] |
0.2 [0.05 to 0.4] |
| Income-to-needs ratio | |||
| Poverty | 26.2 [25.5 to 27.0] |
25.5 [24.7 to 26.3] |
32.2 [30.1 to 34.2] |
| Above Poverty level | 73.7 [72.9 to 74.4] |
74.4 [73.6 to 75.2] |
67.7 [65.7 to 69.8] |
| Health insurance coverage (% yes) | 92.7 [92.4 to 93.1] |
92.4 [92.0 to 92.8] |
95.2 [94.4 to 96.0] |
| BMI (Mean [95% CI]) | 27.6 [27.5 to 27.7] |
27.1 [27.1 to 27.3] |
31.3 [31.0 to 31.5] |
| Normal weight |
37.0 [36.3 to 37.7] |
39.5 [38.6 to 40.3] |
16.7 [15.2 to 18.2] |
| Overweight |
34.3 [33.6 to 35.1] |
34.7 [33.9 to 35.5] |
31.1 [29.1 to 33.1] |
| Obese |
28.5 [27.8 to 29.2] |
25.7 [24.9 to 26.5] |
52.1 [49.9 to 54.2] |
|
Years living with diabetes (Mean [95% CI]) |
13.9 [13.2 to 14.6] |
||
| Type of medication regimen | |||
| No medication | 91.4 [91.0 to 91.7] |
23.1 [21.5 to 24.7] |
|
| Diabetic pills only | 5.7 [5.4 to 6.0] |
50.6 [48.7 to 52.5] |
|
| Insulin only | 1.3 [1.2 to 1.5] |
12.8 [11.5 to 14.1] |
|
| Insulin and diabetic pills | 1.4 [1.2 to 1.6] |
13.3 [11.9 to 14.7] |
|
| Number of comorbidities | 1.0 [1.0 to 1.04] |
0.8 [0.8 to 0.88] |
2.3 [2.3 to 2.4] |
CI=confidence interval
Compared to those without diabetes, a higher proportion of adults with diabetes endorsed various forms of financial insecurity with healthcare, perceived financial stress, food insecurity, and CRN, except 2 items where no group differences were observed: worried about saving for retirement, and cutting back on meals due to lack of money (Figure 1).
Figure 1.
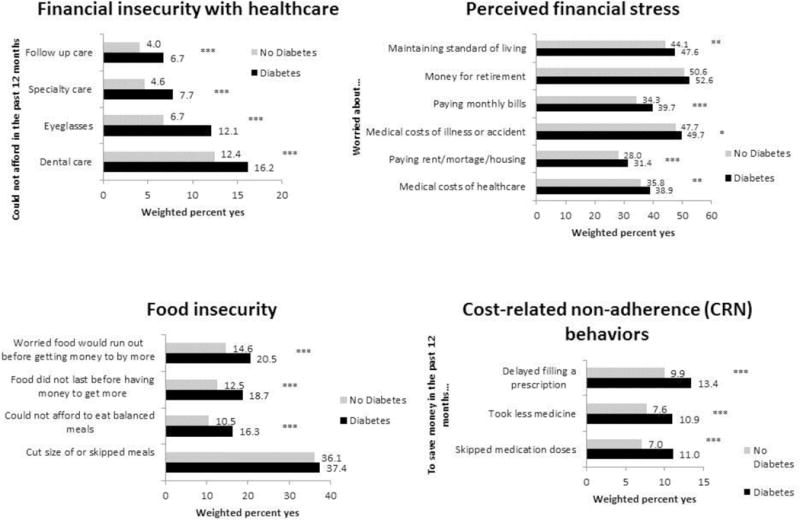
Health and non-health-related burden items and cost-related non-adherence (CRN) with and without diabetes, National Health Interview Survey 2013.
Chi-square tests were used to examine differences between those with and without diabetes. *p<.05, **p<.01, ***p<.001
The diabetes group reported more individuals who asked their doctor for a lower cost medication (27% vs. 13.5%, p<0.001) and used government assistance programs (22% vs. 17%, p<0.001) compared to those without diabetes (Figure 2).
Figure 2.

Use of cost-reducing behavioral strategies among individuals with and without diabetes, National Health Interview Survey, 2013.
Chi-square tests were used to examine differences between those with and without diabetes. *p<.05, **p<.01, ***p<.001
Differences in demographic, clinical and economic characteristics were observed by CRN status and age (see Table, Supplemental Digital Content 1). More adults with diabetes reported engaging in CRN behaviors over the past year than respondents without diabetes (14% vs. 7%, p<0.0001). Respondents with diabetes also were more likely than other respondents to report financial insecurity with healthcare (22% vs. 15%, p<0.0001), food insecurity (24% vs. 17%, p<0.0001), and changes to their health insurance coverage over the past year (2.2% vs. 1.6%, p<0.05). No differences in perceived financial stress were observed between the two groups.
Greater perceived financial stress (Prevalence Ratio (PR)=1.07 [95% CI: 1.05 to 1.09]), greater financial insecurity with healthcare (PR=1.6 [95% CI: 1.5 to 1.7]), and greater food insecurity (PR=1.3 [95% CI: 1.2 to 1.4]) were all associated with a greater likelihood of engaging in CRN behaviors over the past year when adjusted for age, income-to-needs, and health insurance coverage (Table 3). For those between the ages of 18–64 compared to those 65+, the effect of perceived financial stress on CRN was higher (PR=1.06 [95% CI: 1.03 to 1.1]), however financial insecurity with health care (PR=0.8 [95% CI: 0.7 to 0.9]) and food insecurity were lower (PR=0.99 [95% CI: 0.8 to 1.1]). There was no significant association observed between changes to health insurance over the past year and CRN.
Table 3.
Multiple variable regression models examining health and non-health-related burden factors, and cost-reducing behavioral strategies predictive of cost-related non-adherence behaviors (CRN) among the population with diabetes (n=4,158).
| Factor | Cost-related non-adherence behaviors Estimate [95% CI] |
|---|---|
|
| |
| Burden-related items1 | |
|
| |
| Perceived financial stress | 1.07 [1.05 to 1.09] |
| Financial insecurity with healthcare | 1.6 [1.5 to 1.7] |
| Food insecurity | 1.3 [1.2 to 1.4] |
| Changes to health insurance over the past year | 1.4 [0.8 to 2.4] |
|
| |
| Cost-reducing behavioral strategies2 | |
|
| |
| Asking the doctor for lower cost medication | 0.2 [0.2 to 0.3] |
| Using alternative therapies | 1.8 [1.4 to 2.2] |
| Bought prescription drugs from another country | 1.9 [1.5 to 2.4] |
| Use of government assistance programs | 1.1 [0.9 to 1.3] |
CI=confidence interval
Models adjusted for, income-to-needs ratio, age, health insurance
Models adjusted for multiple chronic conditions, income-to-needs ratio, age, health insurance, perceived financial stress, financial insecurity with healthcare, and food insecurity
Asking the doctor for a lower cost medication was reported by 27% of individuals with diabetes, and associated with a lower likelihood of engaging in CRN over the past year when adjusted for age, income-to-needs, health insurance coverage, perceived financial stress, financial insecurity with healthcare, and food insecurity (PR=0.2 [95% CI: 0.2 to 0.3]). . However, the effect of asking for a lower cost medication on CRN actually increased with greater food insecurity (PR=1.3 [95% CI: 1.2 to 1.5]). In contrast, using alternative therapies (PR=1.8 [95% CI: 1.4 to 2.2]), and buying prescriptions drugs from another country (PR=1.9 [95% CI: 1.5 to 2.4]) as cost-reducing behavioral strategies were associated with a greater likelihood of engaging in CRN behaviors. However, the effect of using alternative therapies on CRN decreased with greater financial insecurity with healthcare (PR=0.7 [95% CI: 0.6 to 0.8]) and food insecurity (PR=0.8 [95% CI: 0.7 to 0.9]). There was no significant association observed between using government assistance programs and CRN.
DISCUSSION
Diabetes complications are among the 10 leading causes of death and improving diabetes outcomes is a national priority.23 Understanding the complex relationships among social determinants of health that pose barriers to effective diabetes management is a first step to this end. This is the first study that has examined the influence of both health-related and non-health related perceived stressors and potential cost-reducing strategies on CRN in a nationally representative sample of adults with diabetes. We found that half of adults with diabetes perceived financial stress, and one-fifth reported financial insecurity with healthcare and food insecurity. These factors were associated with a significant increase in CRN behaviors regardless of age, income, and insurance status. We also found that cost-reducing behavioral strategies that may not engage the healthcare provider (e.g. using alternative therapies, buying prescription drugs from another country) were associated with significant increased risk of CRN. These findings are consistent other recent studies showing that problems with fulfilling basic needs may prompt CRN behaviors among people with diabetes.13,14,15
The Affordable Care Act (ACA) aims to increase access to healthcare, yet key gaps in coverage and high rates of cost-sharing make financial burden a reality for patients with diabetes.24 Second, Aside from prescription costs associated with diabetes care, recurring expenses include capillary blood glucose meters and test strips, insulin syringes, finger-lancing devices and lancets, insulin pumps, continuous glucose monitors and their sensors, and diabetic-friendly foods. The ACA provides few details about coverage of diabetes supplies and secondary prevention treatments, such as statin drugs or annual eye exams, making coverage highly variable across plans, and individuals with diabetes susceptible to a host of burdens that also include fulfilling basic needs. Greater attention to the perceived stress and financial insecurity that complex diabetes management poses is needed, both from a policy perspective and in the context of ongoing dialogue between individual patients and their healthcare teams.
We found that close to a quarter of adults with diabetes reported food insecurity, and this was strongly associated with CRN. Patients’ glycemic control is greatly influenced by their diet. Food insecurity is not only a risk factor for developing diabetes, but it also contributes to diabetes complications when coping behaviors stray from clinical recommendations.25 Individuals with diabetes who experience food insecurity have also been shown to use more urgent care services.26 While we were able to examine a series of behaviors that suggest food insecurity, the NHIS lacks more in-depth information on the causes of these behaviors. The reasons for food insecurity may be multifactorial and may require more careful consideration of low-cost options for an individual with diabetes. For an individual with diabetes struggling with food insecurity, food banks, shelters, and free-meals typically do not provide food that that is suitable for a diabetes-friendly diet.25 For such individuals, conversation between them and their healthcare providers should consider how to effectively prioritize diet in the context of financial stress and other health-related insecurities.
We found that more people with diabetes compared to those without asked their doctor for lower cost medication and they were less likely to engage in CRN. This finding supports the importance of discussions with providers about ways to address cost barriers around a therapeutic regimen. Such discussions often lead to a low-cost alternative as seen in our prior work.17 However, we found that the presence of food insecurity actually does not provide a safeguard for CRN, suggesting that communication may be unproductive for some social determinants, thus leading the patient to make decisions and trade-offs on their own. Fewer than half of patients report discussing the cost of medications with their physicians, while over 75% report that such communications are important.19 Patients report many barriers to discussing affordability challenges with their provider including a belief that no solution is available, time constraints, and embarrassment.19,27 More attention to productive communication around addressing low-cost options is needed.
We found that adults with diabetes who use alternative therapies and buy prescriptions overseas were two times more likely to engage in CRN compared to those who did not utilize such strategies. This finding is consistent with other work that has shown that unmet healthcare needs due to cost is more common among individuals with diabetes using alternative therapeutic approaches.20 Alternative approaches may have therapeutic benefit to patients, but may also indicate personal choice, less faith in allopathic medications, or other factors that prompt patients to forego their prescribed regimen in the face of cost pressures. We also found that financial health insecurity and food insecurity decreases the impact of using alternative therapies on CRN, suggesting that individuals may also shift of available resources to these therapies that usually are not covered by insurance,. Because patient disclosure of the use of alternative therapies to physicians is often low28, physicians need to specifically inquire about their use. Many individuals turn to international markets for low-cost prescription medications only after experiencing extreme financial pressures, and even if they are able to purchase some medications abroad, the current study suggests they still may have higher rates of CRN. We found that despite financial stress, this relationship still holds, suggesting that the mechanisms that prompt individuals to buy prescriptions overseas are complex. Safety and efficacy of therapies bought overseas is concerning given the heterogeneity in regulation of drug manufacturers (particularly those in low- and middle-income countries).29 Further research is needed to understand why CRN is high among those who buy therapies overseas, and how these practices impact health.
There are limitations to this study that should be noted. NHIS data are cross-sectional; therefore, the direction and mechanisms of causality between cost-reducing behavioral strategies and CRN cannot be definitively determined. We also do not know if those reporting CRN are cutting back on diabetes medication or medications for other health conditions. This was a secondary analysis of survey data. Items used to generate the burden-related constructs in this study and CRN behaviors are based upon available data, and there may be other items or ways to frame questions that would strengthen reliability. However the items used to construct these factors are consistent with other work that has used validated measures.15,22 We did not have access to data to verify the CRN behaviors reported in this study against pharmacy-claims or medical records, which would strengthen confidence in self-report data, however the rates of CRN that we found are in line with those reported in other work.1,2,5
This study has important implications for behavioral interventions, clinical practice, and policy. Diabetes management is complex and policy reforms continue to be needed to make it more affordable. We need to screen for social determinants of health, given that CRN is one consequence of failing to address social issues closely intertwined to health outcomes. Since both structural barriers and communication gaps make it difficult for providers to be fully aware of the perceived financial burden their patients face or the strategies patients adopt to address these burdens, systems need to be put into place to screen for these. Given the increased use of technology in care settings, there are many opportunities to streamline screening practices in a way that facilitates transparency and communication with providers. Such tools could potentially link patients more readily to appropriate low-cost resources. Screening questions should assess both health and non-health-related stressors as a starting point to initiate conversations with the care team about barriers to adherence. Self-management interventions may also encourage individuals with diabetes or other chronic conditions to ask their doctor about low-cost treatment options and provide skills training in having conversations with their providers around options they are using or considering. Increased communication and transparency of factors affecting adherence may also safeguard patients from the health consequences of cutting back on treatment and care, and move the needle towards improved diabetes outcomes.
Supplementary Material
Acknowledgments
This research used the Michigan Center for Diabetes Translational Research supported from grant number P30DK092926 from the National Institute of Diabetes and Digestive and Kidney Diseases. John Piette is a VA Senior Research Career Scientist.
Footnotes
The authors have no financial interests to disclose.
Contributor Information
Minal R. Patel, Department of Health Behavior & Health Education, University of Michigan School of Public Health, 1415 Washington Heights, Ann Arbor, MI 48109-2029.
John D. Piette, Email: jpiette@umich.edu, Department of Health Behavior & Health Education, University of Michigan School of Public Health, 1415 Washington Heights, Ann Arbor, MI 48109-2029, Phone: (734) 763-1457, Fax: (734) 763-9115.
Kenneth Resnicow, Email: kresnic@umich.edu, Department of Health Behavior & Health Education, University of Michigan School of Public Health, 1415 Washington Heights, Ann Arbor, MI 48109-2029, Phone: (734) 647-0212, Fax: (734) 763-9115.
Theresa Kowalski-Dobson, Email: tkowals@umich.edu, Department of Health Behavior & Health Education, University of Michigan School of Public Health, 1415 Washington Heights, Ann Arbor, MI 48109-2029, Phone: (734) 647-0224, Fax: (734) 763-9115.
Michele Heisler, Email: mheisler@umich.edu, Professor of Internal Medicine and Health Behavior and Health Education, PO Box 130170, Ann Arbor, MI 48113, Phone: (734) 845-3504, Fax: (734) 763-9115.
References
- 1.McHorney CA, Spain CV. Frequency of and reasons for medication non-fulfillment and non-persistence among American adults with chronic disease in 2008. Health Expect. 2011;14(3):307–320. doi: 10.1111/j.1369-7625.2010.00619.x. [DOI] [PMC free article] [PubMed] [Google Scholar]
- 2.Piette JD, Heisler M, Wagner TH. Cost-related medication underuse among chronically ill adults: the treatments people forgo, how often, and who is at risk. Am J Public Health. 2004;94(10):1782–1787. doi: 10.2105/ajph.94.10.1782. [DOI] [PMC free article] [PubMed] [Google Scholar]
- 3.Musich S, Cheng Y, Wang SS, et al. Pharmaceutical Cost-Saving Strategies and their Association with Medication Adherence in a Medicare Supplement Population. J Gen Intern Med. 2015;30(8):1208–14. doi: 10.1007/s11606-015-3196-7. [DOI] [PMC free article] [PubMed] [Google Scholar]
- 4.Piette JD, Beard A, Rosland AM, et al. Beliefs that influence cost-related medication non-adherence among the “haves” and “have nots” with chronic diseases. Patient Prefer Adherence. 2011;5:389–96. doi: 10.2147/PPA.S23111. [DOI] [PMC free article] [PubMed] [Google Scholar]
- 5.Marcum ZA, Zheng Y, Perera S, et al. Prevalence and correlates of self-reported medication non-adherence among older adults with coronary heart disease, diabetes mellitus, and/or hypertension. Res Social Adm Pharm. 2013;9(6):817–27. doi: 10.1016/j.sapharm.2012.12.002. [DOI] [PMC free article] [PubMed] [Google Scholar]
- 6.Piette JD, Wagner TH, Potter MB, et al. Health insurance status, cost-related medication underuse, and outcomes among diabetes patients in three systems of care. Med Care. 2004;42(2):102–9. doi: 10.1097/01.mlr.0000108742.26446.17. [DOI] [PubMed] [Google Scholar]
- 7.Cunningham P, Carrier E. Trends in the financial burden of medical care for nonelderly adults with diabetes, 2001 to 2009. Am J Manag Care. 2014;20(2):135–42. [PubMed] [Google Scholar]
- 8.Choudhry NK, Shrank WH, Levin RL, et al. Measuring concurrent adherence to multiple related medications. Am J Manag Care. 2009;15(7):457–64. [PMC free article] [PubMed] [Google Scholar]
- 9.Miller GE, Sarpong EM, Hill SC. Does increased adherence to medications change health care financial burdens for adults with diabetes? J Diabetes. 2015;7(6):872–80. doi: 10.1111/1753-0407.12292. [DOI] [PubMed] [Google Scholar]
- 10.Centers for Medicare and Medicaid Services. Medicare Chronic Conditions Dashboard: State Level. 2014 Available at: http://www.cms.gov/Research-Statistics-Data-and-Systems/Statistics-Trends-and-Reports/Dashboard/Chronic-Conditions-State/CC_State_Dashboard.html.
- 11.Ngo-Metzger Q, Sorkin DH, Billimek J, et al. The effects of financial pressures on adherence and glucose control among racial/ethnically diverse patients with diabetes. J Gen Intern Med. 2012;27(4):432–7. doi: 10.1007/s11606-011-1910-7. [DOI] [PMC free article] [PubMed] [Google Scholar]
- 12.Sattler EL, Lee JS, Bhargava V. Food insecurity and medication adherence in low-income older Medicare beneficiaries with type 2 diabetes. J Nutr Gerontol Geriatr. 2014;33(4):401–17. doi: 10.1080/21551197.2014.959680. [DOI] [PubMed] [Google Scholar]
- 13.Smalls BL, Gregory CM, Zoller JS, et al. Assessing the relationship between neighborhood factors and diabetes related health outcomes and self-care behaviors. BMC Health Serv Res. 2015;15:445. doi: 10.1186/s12913-015-1086-7. [DOI] [PMC free article] [PubMed] [Google Scholar]
- 14.Vijayaraghavan M, Jacobs EA, Seligman H, et al. The association between housing instability, food insecurity, and diabetes self-efficacy in low-income adults. J Health Care Poor Underserved. 2011;22(4):1279–91. doi: 10.1353/hpu.2011.0131. [DOI] [PubMed] [Google Scholar]
- 15.Heerman WJ, Wallston KA, Osborn CY, et al. Food insecurity is associated with diabetes self-care behaviours and glycaemic control. Diabet Med. 2015 doi: 10.1111/dme.12896. [DOI] [PMC free article] [PubMed] [Google Scholar]
- 16.Berkowitz SA, Seligman HK, Choudhry NK. Treat or eat: food insecurity, cost-related medication underuse, and unmet needs. Am J Med. 2014;127(4):303–310.e3. doi: 10.1016/j.amjmed.2014.01.002. [DOI] [PubMed] [Google Scholar]
- 17.Piette JD, Heisler M, Wagner TH. Cost-related medication underuse: do patients with chronic illnesses tell their doctors? Arch Intern Med. 2004;164(16):1749–1755. doi: 10.1001/archinte.164.16.1749. [DOI] [PubMed] [Google Scholar]
- 18.Heisler M, Wagner TH, Piette JD. Clinician identification of chronically ill patients who have problems paying for prescription medications. Am J Med. 2004;116(11):753–758. doi: 10.1016/j.amjmed.2004.01.013. [DOI] [PubMed] [Google Scholar]
- 19.Schmittdiel JA, Steers N, Duru OK, et al. Patient-provider communication regarding drug costs in Medicare Part D beneficiaries with diabetes: a TRIAD Study. BMC Health Serv Res. 2010;10:164-6963-10-164. doi: 10.1186/1472-6963-10-164. [DOI] [PMC free article] [PubMed] [Google Scholar]
- 20.Pagán JA, Tanguma J. Health care affordability and complementary and alternative medicine utilization by adults with diabetes. Diabetes Care. 2007;30(8):2030–1. doi: 10.2337/dc07-0433. [DOI] [PubMed] [Google Scholar]
- 21.Centers for Disease Control and Prevention. National Center for Health Statistics. National health interview survey data (2007–2012) Washington, DC: US Department of Health and Human Services; 2012. [Google Scholar]
- 22.Burcu M, Alexander GC, Ng X, et al. Construct validity and factor structure of survey-based assessment of cost-related medication burden. Med Care. 2015;53(2):199–206. doi: 10.1097/MLR.0000000000000286. [DOI] [PubMed] [Google Scholar]
- 23.American Diabetes Association. The cost of diabetes. 2012 Available at: http://www.diabetes.org/advocacy/news-events/cost-of-diabetes.html.
- 24.Burge MR, Schade DS. Diabetes and the Affordable Care Act. Diabetes Technol Ther. 2014;16(7):399–413. doi: 10.1089/dia.2014.0171. [DOI] [PMC free article] [PubMed] [Google Scholar]
- 25.Gucciardi E, Vahabi M, Norris N, et al. The intersection between food insecurity and diabetes: a review. Curr Nutr Rep. 2014;3(4):324–332. doi: 10.1007/s13668-014-0104-4. [DOI] [PMC free article] [PubMed] [Google Scholar]
- 26.Marjerrison S, Cummings EA, Glanville NT, et al. Prevalence and associations of food insecurity in children with diabetes mellitus. J Pediatr. 2011;158(4):607–11. doi: 10.1016/j.jpeds.2010.10.003. [DOI] [PubMed] [Google Scholar]
- 27.Alexander GC, Casalino LP, Meltzer DO. Patient-physician communication about out-of-pocket costs. JAMA. 2003;290(7):953–8. doi: 10.1001/jama.290.7.953. [DOI] [PubMed] [Google Scholar]
- 28.Chao MT, Handley MA, Quan J, et al. Disclosure of complementary health approaches among low income and racially diverse safety net patients with diabetes. Patient Educ Couns. 2015;98(11):1360–6. doi: 10.1016/j.pec.2015.06.011. [DOI] [PMC free article] [PubMed] [Google Scholar]
- 29.Thompson CA. Drug importation raises issues for pharmacists. Am J Health Syst Pharm. 2004;61(4):328, 333–4. doi: 10.1093/ajhp/61.4.328. [DOI] [PubMed] [Google Scholar]
Associated Data
This section collects any data citations, data availability statements, or supplementary materials included in this article.