Summary
The DNA replication and transcription machineries share a common DNA template and thus can collide with each other co-directionally or head-on1,2. Replication-transcription collisions can cause replication fork arrest, premature transcription termination, DNA breaks, and recombination intermediates threatening genome integrity1–10. Collisions may also trigger mutations, which are major contributors of genetic disease and evolution5,7,11. However, the nature and mechanisms of collision-induced mutagenesis remain poorly understood. Here we reveal the genetic consequence of replication-transcription collisions in actively dividing bacteria to be two classes of mutations: duplications/deletions and base substitutions in promoters. Both signatures are highly deleterious but are distinct from the well-characterized base substitutions in coding sequence. Duplications/deletions are likely caused by replication stalling events that are triggered by collisions; their distribution patterns are consistent with where the fork first encounters a transcription complex upon entering a transcription unit. Promoter substitutions result mostly from head-on collisions and frequently occur at a nucleotide conserved in promoters recognized by the major sigma factor in bacteria. This substitution is generated via adenine deamination on the template strand in the promoter open complex, as a consequence of head-on replication perturbing transcription initiation. We conclude that replication-transcription collisions induce distinct mutation signatures by antagonizing replication and transcription, not only in coding sequences but also in gene regulatory elements.
Mutations cause genetic diseases and drive evolution by altering either the gene coding sequence or the noncoding elements that control gene expression. A variety of mechanisms underlie mutagenesis: DNA replication errors, error-prone repair, transcription-associated mutagenesis (TAM), and replication stalling-mediated template switch10,12–15. Many mutagenic mechanisms depend on two fundamental processes- replication or transcription. However, little is known about mutagenic mechanisms involving replication-transcription collision, an unavoidable outcome of the two processes sharing the same DNA template. Identifying the mutagenic consequences of replication-transcription collisions remains an important challenge due to the difficulty of differentiating collision-induced mutation events from that of either replication or transcription.
An experimental approach to identify collision-induced mutagenesis is to analyze the mutagenic consequence of altering the relative directionality of transcription to replication7,10–12. Head-on collisions are proposed to generate mutations more frequently than co-directional collisions, which may underlie the genome-wide bias for essential genes to be transcribed co-directional to replication5,7,11. In support of this hypothesis, in the bacterium Bacillus subtilis in which 94% of essential genes are co-directional16, base substitution rates are higher within genes oriented head-on than co-directional to replication7,11. However, the orientation-dependent difference in substitution rates can also be explained by the difference in the fidelity between leading and lagging strand replication12,15,17,18, challenging the notion that collisions generate base substitutions in coding sequence11,19. Thus, conclusive evidence for collision-induced mutations is still lacking and necessitates a systematic analysis of collision-generated mutation signatures beyond base substitutions in coding sequence.
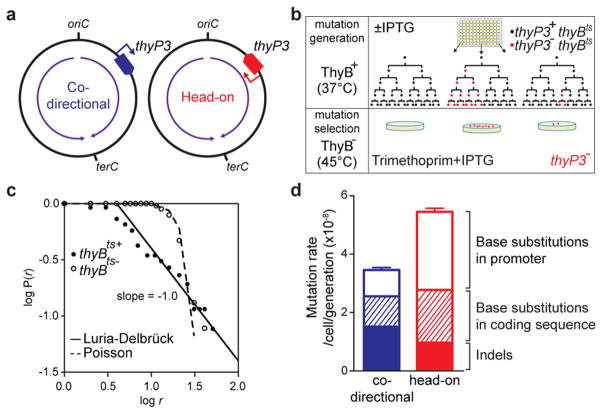
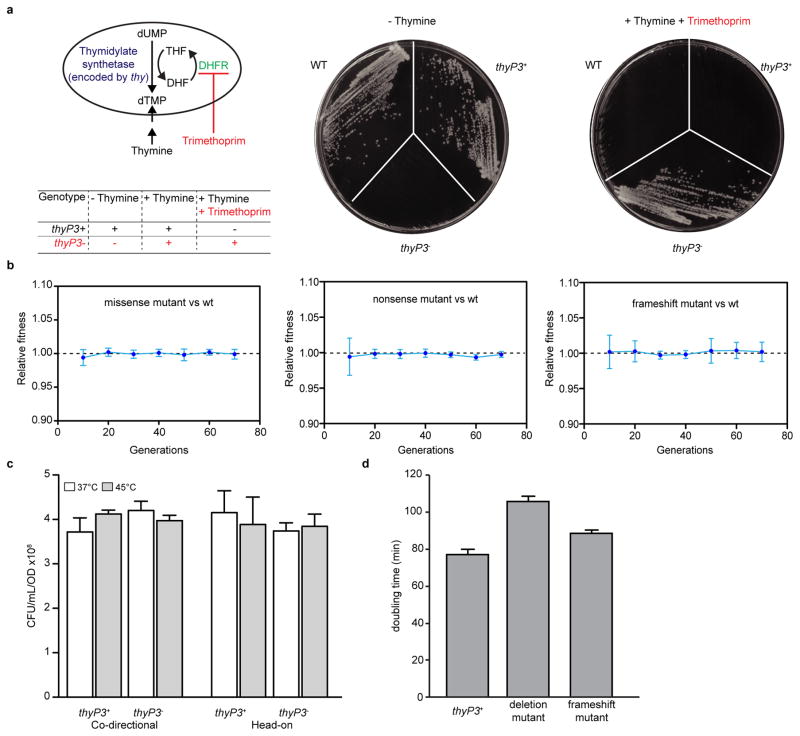
Here, we investigate whether mutations are generated by collisions by identifying the signatures and characterizing mechanisms of mutations caused by co-directional versus head-on collisions. We first developed an assay that can detect a wide range of mutations in B. subtilis. We chose the thymidylate synthetase gene thyP3 because any complete loss-of-function mutation in thyP3 can be selected using trimethoprim resistance (Extended Data Fig. 1a). To evaluate the effect of gene directionality on mutagenesis, we placed thyP3 under an IPTG-inducible promoter at a single location on the chromosome in either co-directional or head-on orientation (Fig. 1a). To estimate mutation rates, we performed the Luria-Delbrück fluctuation test using multiple growth cultures, selected for thyP3 mutants after growth, and statistically determined the rate of spontaneous mutations in thyP3 (Fig. 1b)20,21. Two additional features of our assay allowed critical analyses of mutagenesis. First, we chose the nonnative, phage-encoded thyP3 as the target sequence and deleted thyA, the native homolog of thyP3. We avoided using a native gene to evaluate the impact of gene directionality on mutagenesis because evolution may have already eliminated potential mutation hotspots within a native gene in its original orientation. Second, we took advantage of the temperature sensitivity of a second endogenous gene, thyB, to ensure that mutants were not defective during growth, which could alter the apparent mutation rate. We grew cells at the permissive temperature (37 °C), during which the functional ThyB masks any competitive disadvantage of thyP3 mutations (Extended Data Fig. 1b). Selection was done at a non-permissive temperature under which ThyB is inactivated and phenotypes associated with thyP3 mutation would be exposed (Fig. 1b, and Extended Data Fig. 1c). In the presence of thyB, mutants follow the Luria-Delbrück distribution (Fig. 1c), demonstrating that mutations arise with constant rate per cell division, before and not after selection20,21. Notably, the use of thyB was critical because without thyB, mutants followed the Poisson distribution instead of the expected Luria-Delbrück distribution (Fig. 1c), presumably due to the growth defect of thyP3 mutants (Extended Data Fig. 1d).
Figure 1. Transcription directionality affects spontaneous mutation rates and spectra in B. subtilis.
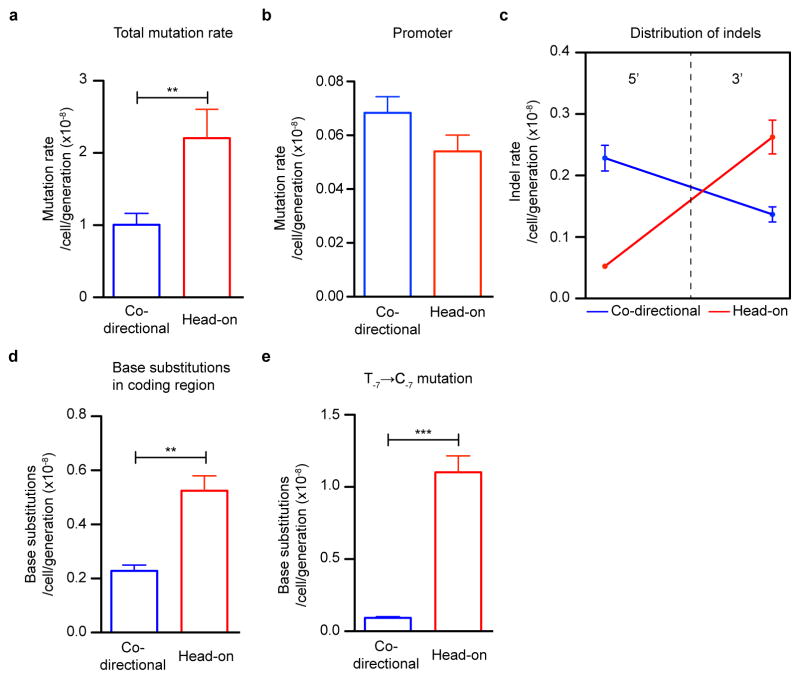
a, thyP3 gene with an IPTG-inducible promoter is integrated into the chromosome either co-directionally or head-on to replication. Purple arrow: replication direction, oriC: replication origin, terC: replication terminus. b, Modified fluctuation test to measure the rate of spontaneous mutations conferring trimethoprim resistance. c, Distribution of mutants: number of mutants per culture (r) plotted against proportion of cultures with ≥r mutants (P(r)). d, The mutation rates in co-directional and head-on thyP3 (subdivided by mutation spectra) when transcription is induced with IPTG. Mutation rates are expressed as mean±s.e.m here and all figures.
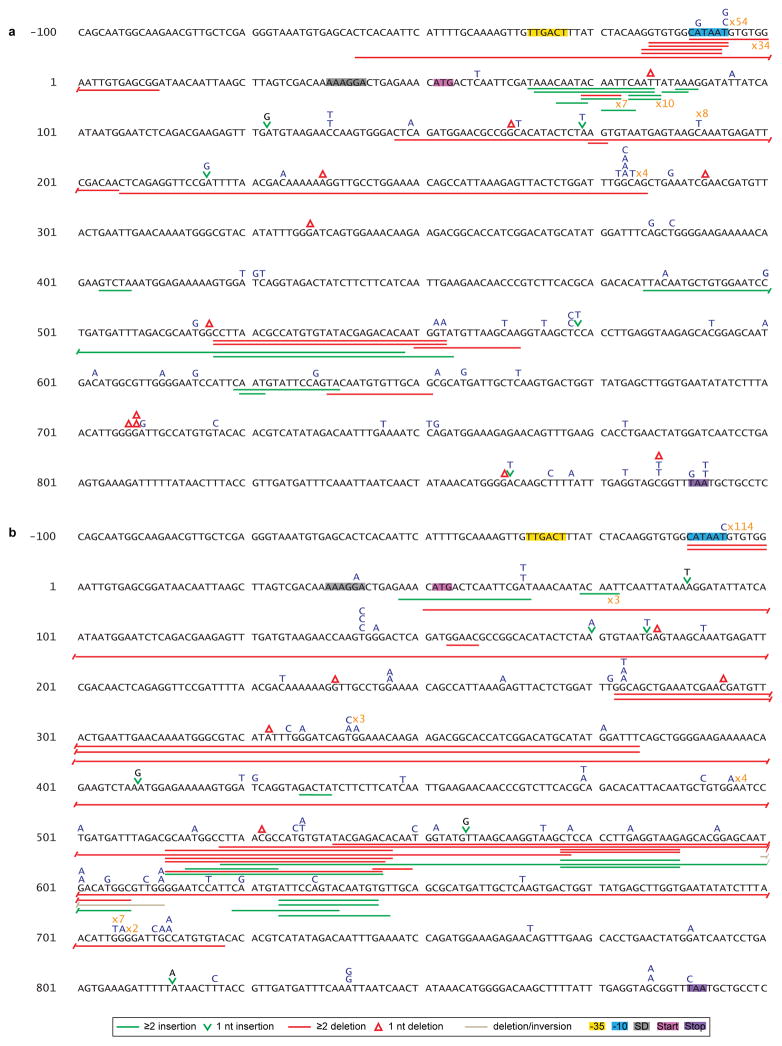
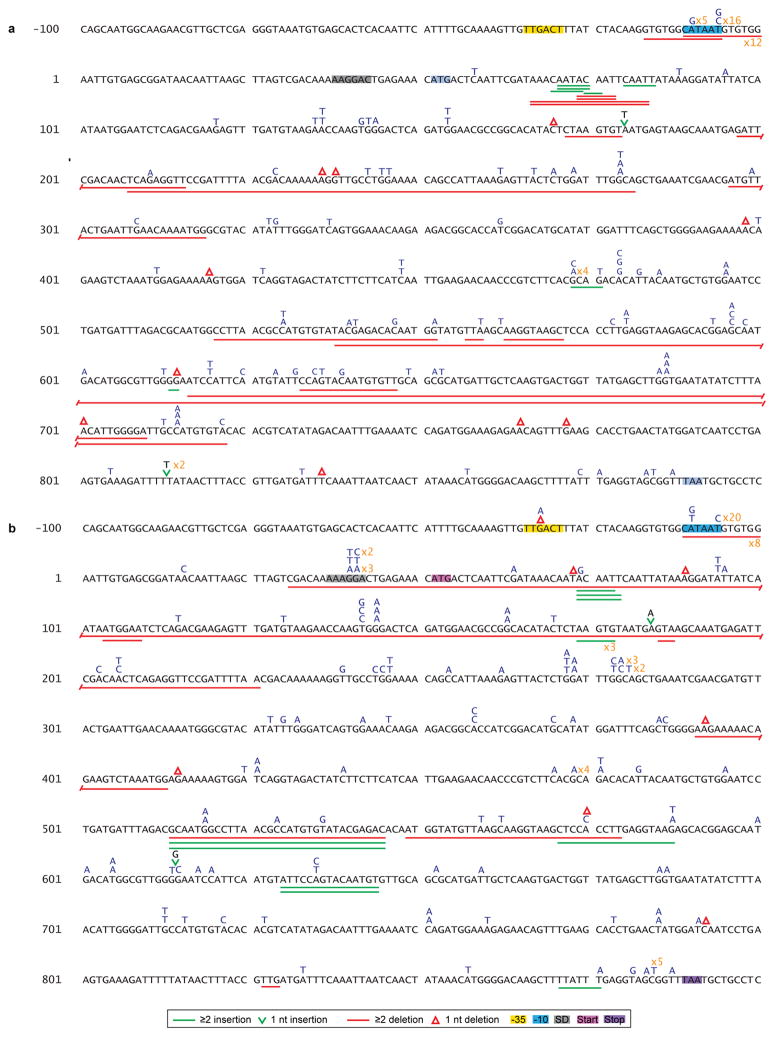
Using this assay, we compared mutations resulting from co-directional versus head-on oriented thyP3. When induced by IPTG, transcription reaches similar levels from either co-directional or head-on thyP3 (Extended Data Fig. 2a). A ~60% increase of total mutation rate in the head-on thyP3 compared to co-directional thyP3 was observed (Fig. 1d and Extended Data Fig. 2b–e). Next, we sequenced ~2000 mutants and obtained ~400 distinct mutations (Extended Data Fig. 3–4). Only less than a third of mutations observed in thyP3 under induced transcription were base substitutions within the coding region. The remaining majority of mutations fall into two prominent classes: indels (insertions/deletions) and promoter base substitutions. Their mutation rates are strongly and differentially altered by transcription directionality and strength (Extended Data Fig. 2e). These alterations are mostly not due to competitive or selection bias of the mutants (Extended Data Fig. 5). Further analyses, described below, revealed that indels and promoter substitutions are likely induced by replication-transcription collisions.
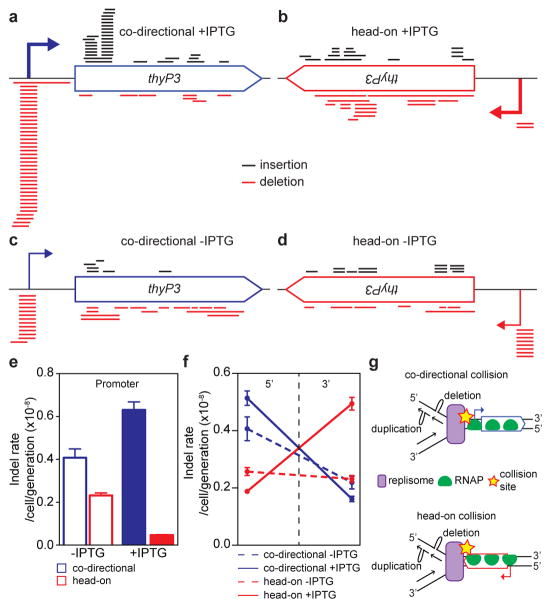
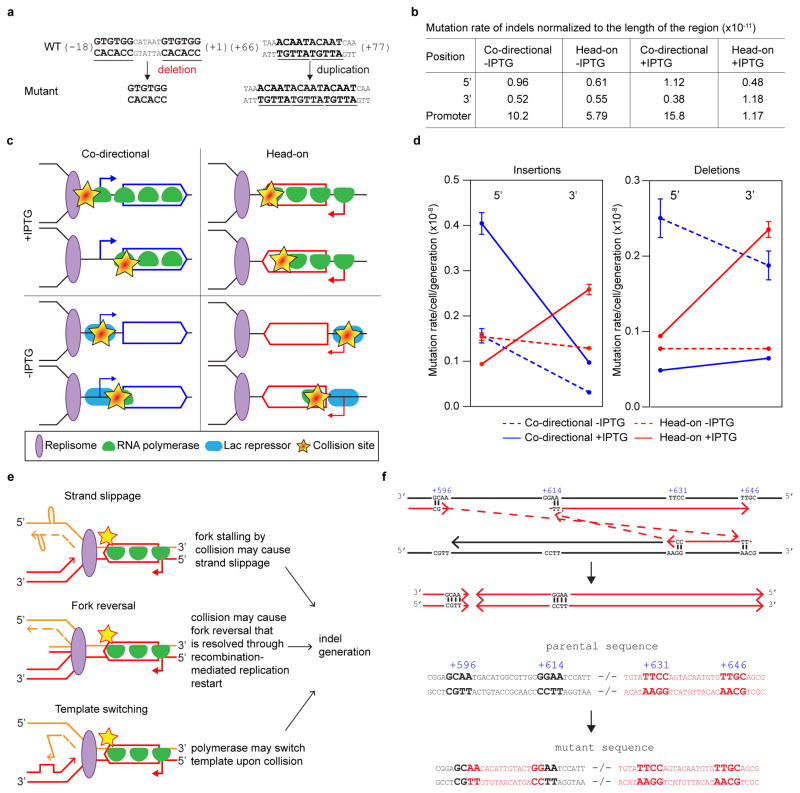
Indels are likely generated upon stalling of a replication fork after collision with a transcription complex or a transcription factor3,22. First, the majority of indels are duplications/deletions between repeated DNA sequences (3–522 bp, Extended Data Fig. 6a), which were proposed to originate from slippage/template switch of stalled replication forks13,14. Second, the frequencies of indels at different locations within thyP3 are strongly influenced by its transcription orientation and strength (Fig. 2a–f, Extended Data Fig. 6b). When thyP3 was co-directional to replication, indels were predominantly enriched at the promoter and 5′ half of the coding region (Fig. 2a), including promoter-proximal regions where RNA polymerases (RNAP) are known to often pause8. In contrast, when thyP3 was head-on, indels were found predominantly within the 3′ half (Fig. 2b), a bias that is largely absent when transcription was un-induced (at basal level) (Fig. 2c, d). This transcription-dependent enrichment pattern reflects the vicinity where the replication fork first encounters a transcription complex upon entering a transcription unit (Fig 2g, Extended Data Fig. 6c). Promoter deletions depended on the recombination protein RecA, thus are mostly caused by recombination13 after replication fork collision with transcription initiation complex22 or repressors23 (Extended Data Fig. 7). However, the distribution of indels within the transcribed sequence was not affected by RecA, suggesting that recombination is not necessary for their generation. Instead, collision with transcription elongation complex3,8,24 stalls replication fork progression, which can induce fork slippage, template switch or fork reversal that leads to duplications/deletions, or by collision-generated DNA breaks6–9 followed by microhomology-mediated break-induced replication (MMBIR) or microhomology-mediated end joining (MMEJ) (Extended Data Fig. 6e,f)14. Our work thus reveals the strong contribution of replication-transcription conflicts to the generation of indels.
Figure 2. Distributions of indels (insertions/deletions) are strongly dependent on transcription directionality and strength.
a–d, Positional distribution of indels of ≥3 bp in co-directional and head-on thyP3 under induced (+IPTG) and un-induced (−IPTG) conditions. Each bar represents an insertion (black) or deletion (red). e, The rates of ≥3 bp indels at the promoter. f, The rates of ≥3 bp indels within 5′ (1–420 bp) and 3′ (421–840 bp) of coding region. Rates of insertions and deletions are plotted separately in Extended Data Fig. 6d. g, Model illustrating the mechanism of generation of indels in the vicinity of collision site in co-directional and head-on orientations, via fork slippage (shown here), template switch or fork reversal (Extended Data Fig. 6e).
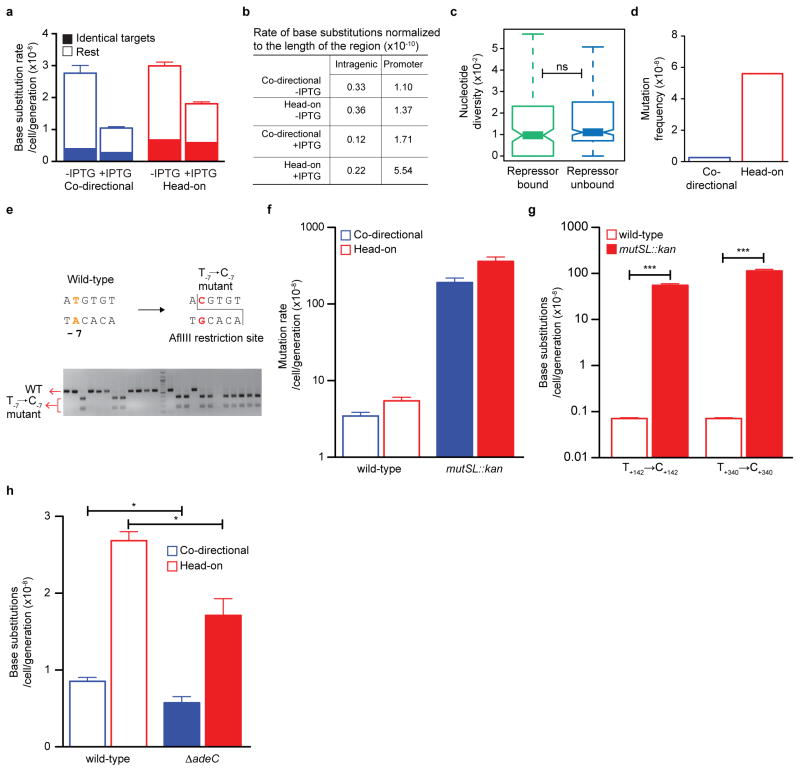
We next analyzed base substitutions in the coding sequence, which have been proposed to be generated by replication-transcription conflicts11. In contrast to indels, base substitutions within coding sequence were not enriched near locations of replication-transcription collisions (Fig. 3a–d). Base substitution rates were not higher under induced transcription compared to basal levels when considering identical mutation target sites (Extended Data Fig. 8a). We again observed higher substitution rates in coding sequence of head-on than co-directional genes7,11, which are most likely due to different replication fidelity between leading and lagging strands12,18, although collisions cannot be ruled out as a source of these mutations.
Figure 3. Head-on transcription induces base substitutions at the promoter.
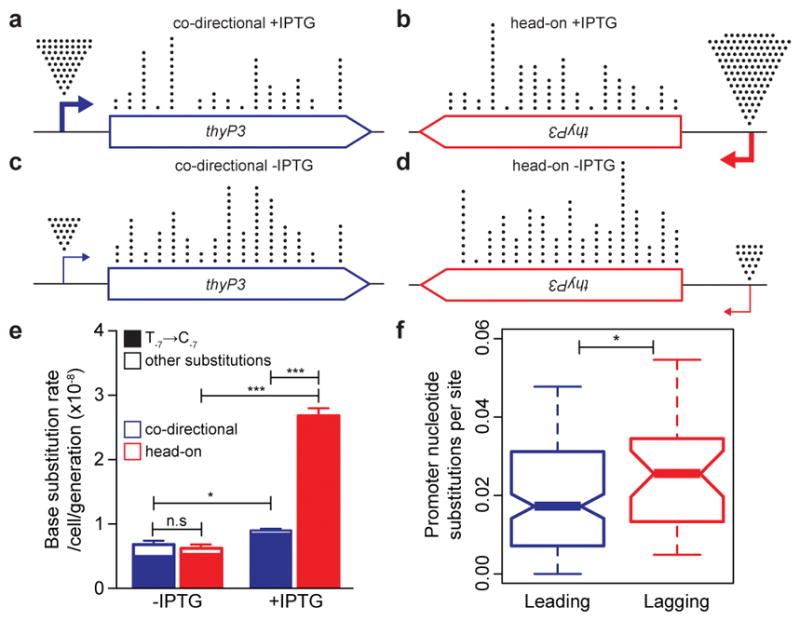
a–d, Positional distribution of base substitutions in co-directional and head-on thyP3 under induced (+IPTG) and un-induced (−IPTG) conditions. Each dot records a base substitution mapped in 50 nt window. e, Promoter base substitution rate is strongly increased in head-on orientation upon IPTG-induction. f-, Distribution of mean nucleotide substitutions per site of promoters, each estimated pairwise among Bacillus strains. Lagging strand promoters (n=32) show increased substitutions than leading strand promoters (n=147). Nucleotide substitutions are comparable between promoters bound and not bound by transcriptional repressors (Extended Data Fig. 8c). Central mark of box-plot represents median, edges are 25th and 75th centiles, notches are 95% CI of median, and whiskers represent extreme data points within range. (n.s-not significant; *P<0.05, **P<0.01, ***P<0.0001; Student’s t-test, Mann-Whitney U test).
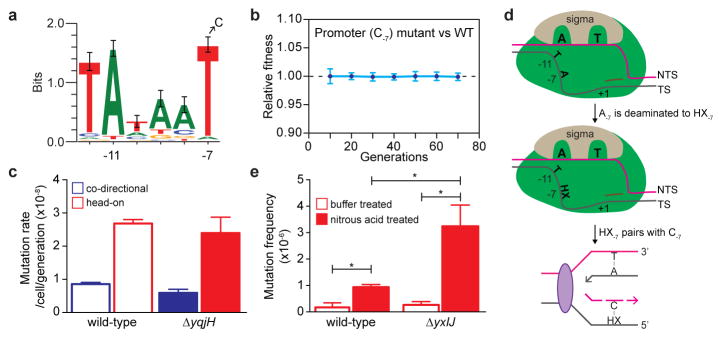
In contrast to coding sequence substitutions, promoter base substitutions were elevated upon induction of transcription, suggesting that transcription initiation causes genome instability at the promoter (Fig. 3e, Extended Data Fig. 8b). Most strikingly, this increase in promoter substitution rates is much stronger (400%) for head-on than co-directional transcription, strongly suggesting that head-on collisions generate promoter substitutions. To examine the generality of this observation, we performed a genome-wide phylogenetic analysis to estimate the number of nucleotide substitutions in promoters from multiple strains of Bacillus. The analysis showed that promoters of head-on genes have higher nucleotide substitutions than promoters of co-directional genes (Fig. 3f). Thus, head-on transcription not only increases mutation rate of the promoter sequence specifically studied above, but on a genome-wide scale in natural populations.
The most frequent substitution within the thyP3 promoter is at a conserved nucleotide in the −10 element recognized by the major sigma factor, T-7 (Fig. 4a). T-7→C-7 substitution accounted for all promoter substitutions and 50% of total mutation events upon induced transcription of head-on thyP3 (Fig. 3e). This enrichment is not due to competitive advantage of C-7 mutant over wild-type or other thyP3 mutants (Fig. 4b, Extended Data Fig. 5a–c), supporting T-7→C-7 as a bona fide mutation hotspot obtainable with our assay. Importantly, T-7 is conserved across species and occurs in promoters of ~50–70% of essential genes in B. subtilis and E. coli25. The possibility that these promoters are all susceptible to collision-induced T→C mutagenesis implicates a previously unidentified, pervasive mechanism that can inactivate transcription of many genes and result in loss of viability. Indeed, in E. coli T-7→C-7 was observed as a mutation hotspot in the head-on orientation in a plasmid-based assay (Extended Data Fig. 8d)26 and T→C was also observed in other positions of cis-regulatory elements beyond −7 position27, suggesting that base substitutions in gene-regulatory elements is a signature of head-on transcription in bacteria.
Figure 4. Promoter T-7→C-7 is a mutation hotspot generated via deamination.
a, The consensus −10 element of B. subtilis SigA-dependent promoters (n=358). The strongly conserved T-7 is frequently mutated to a C. b, Fitness of head-on T-7→C-7 mutant relative to head-on wild-type thyP3 cells under induced transcription (mean±s.d). c, Mutation rate of T-7→C-7 in yqjH mutant (error-prone polymerase PolIV). d, Model illustrating the mechanism of generation of T-7→C-7. During transcription initiation, the −10 element is single-stranded, creating solvent accessibility for A-7 on the template strand (TS), allowing it to be deaminated to hypoxanthine (HX). HX basepairs with C during replication, resulting in T-7→C-7. e, T-7→C-7 frequencies in head-on thyP3 upon nitrous acid treatment of wild-type and ΔyxlJ (hypoxanthine-DNA glycosylase) strains. (*-P<0.05; Student’s t-test).
To examine the mechanism underlying this mutation, we used a restriction enzyme-based assay that exclusively detects T-7→C-7 (Extended Data Fig. 8e) in thyP3 to test several alternatives. First, we found that the error prone DNA polymerase PolIV, which was proposed to be responsible for collision-induced substitutions19, is not a major contributor of this mutation (Fig. 4c). Second, T-7→C-7 is not generated by error-prone recombination repair as it still occurs frequently in the absence of recA (Extended Data Fig. 7e). Third, we examined whether a commonly occurring G-T wobble mismatch, which is generated by the replicative DNA polymerase and efficiently corrected by mismatch repair28, accounts for this mutation. Inactivating mismatch repair increased the mutation rate of thyP3 by ~60 fold similar to other mutation assays18 and increased T→C substitutions at hotspots in the coding sequence by ~1000 fold (Extended Data Fig. 8f, g). Strikingly, we did not find any T-7→C-7 substitution upon screening ~1000 mismatch repair mutants, suggesting that T-7→C-7 is not generated via G-T mismatch.
After ruling out these known models of mutagenesis, we propose a new model that explains the frequent T-7→C-7 substitutions based on the structure of the bacterial promoter open complex where the −10 element is single-stranded25,29,30. Specifically, during transcription initiation, T-7 on the non-template strand is buried in a sigma factor pocket, and its complementary base on the template strand (A-7) is unpaired and vulnerable to spontaneous deamination to hypoxanthine27 (Fig. 4d). Hypoxanthine can base pair with cytosine during replication, leading to the T-7→C-7 mutation. This model is further supported by our data that treating cells with nitrous acid, an inducer of base deamination, leads to increased frequency of T-7→C-7 mutation, which is more pronounced in the hypoxanthine-DNA glycosylase mutant (Fig. 4e), supporting hypoxanthine as the premutagenic intermediate. The cellular adenine deaminase is not a major factor responsible for T-7→C-7 mutation (Extended Data Fig. 8h), indicating that the A-7 is spontaneously deaminated while sequestered within the transcription initiation complex. It is likely that other bases within the promoter open complex can also be mutated via deamination, although those mutations do not completely abolish gene expression thus cannot be identified by our assay. Our work thus uncovers a mechanism that implicates in general the greater susceptibility of promoters to mutations.
Our proposed mechanism represents a novel mutagenesis pathway that is distinct from TAM10, which introduces substitutions within the transcribed sequence via deamination on the nontemplate strand, while the template strand of the coding sequence is protected by base pairing with nascent RNA (i.e. RNA-DNA hybrid). In contrast, the promoter is upstream of the transcription start site, thus is not protected by RNA-DNA hybrid and vulnerable to deamination or other premutagenic DNA damage upon open complex formation (Fig. 4d). We propose a model that head-on replication interferes with RNA polymerase escape from the promoter, rendering the promoter open complex more susceptible to premutagenic DNA damage, subsequently leading to mutations.
Our work reveals two types of collision-induced mutations, indels and promoter substitutions, which are generated by distinct mechanistic pathways likely resulting from mutual antagonism between replication and transcription upon collision. Our work supports the hypothesis that collision-induced mutagenesis contributes to the evolution of the strong co-directional bias of essential genes5 and reveals orientation-biased promoter mutation underlying this conserved aspect of genome organization. We suspect that these mutation signatures have important implications not only in fitness and evolution of bacteria but also in higher organisms including humans. Indels can lead to copy number variation, a significant cause of genetic diseases. Mutations in cis-regulatory elements lead to misregulation of gene expression, and cis-regulatory elements are found to be more susceptible to mutagenesis than coding regions in eukaryotic genomes17. Thus, harmonizing replication with transcription is a key factor in fitness and genome evolution across domains of life.
Methods
Media and growth conditions
Unless otherwise indicated, cells were grown in S7 defined medium31 containing 50 mM MOPS and supplemented with 1% glucose, 0.1% glutamate, 40 μg/ml tryptophan, and 20 μg/ml thymine (Sigma-Aldrich) at 37 °C with vigorous shaking, and plated on solid medium (Spizizen’s medium), supplemented with 1% glucose, 0.1% glutamate, 40 μg/ml tryptophan, and 20 μg/ml thymine. Trimethoprim (RPI Research Products International Corp.,) was added to plates at a final concentration of 5 μg/ml for selecting loss-of-function mutations in thyP3 gene. To induce expression of thyP3, isopropyl β-D-1-thiogalactopyranoside (IPTG) was added to the medium at a final concentration of 1 mM.
Strain construction
Strains used are derivatives of the wild-type strain B. subtilis 168 (JDW437) unless otherwise stated and are listed in Extended Data Table 1. The plasmids and PCR primers are listed in Extended Data Tables 1 and 2 respectively. The thyP3 strains were created in the ΔthyA (JDW1543) background. thyA was deleted using the markerless deletion method32 with plasmid pJW395. The head-on thyP3 strain JDW1544 was generated by transforming JDW1543 with linearized plasmid pJW396. The co-directional thyP3 strain JDW1563 was generated by transforming JDW1543 with linearized plasmid pJW397. Swapped head-on and co-directional thyP3 strains JDW1900 and JDW1901 were created by transforming JDW1543 with linearized plasmid pJW430 and pJW431, respectively. The head-on thyP3 strain (JDW1176) in ΔthyA ΔthyB background was created by transforming JDW942 with linearized plasmid pJW331. The lacZ reporter strains used in competition assays were created by transforming the respective thyP3 wild-type or mutant strains with linearized plasmid pJW417.
Plasmid pJW395 was constructed to create a markerless deletion of thyA, by inserting thyA upstream homologous sequence (PCR amplified by primers oJW1052/oJW1053) and downstream homologous sequence (PCR amplified by primers oJW1054/oJW1055) between the EcoRI and BamHI sites of pJW299. Plasmid pJW331 was constructed by inserting thyP3 gene between SalI and SphI sites of pDR90. The thyP3 gene sequence, including its promoter, was amplified from genomic DNA of JDW941 using oJW760/oJW761. Plasmid pJW396 was constructed by inserting the thyP3 gene between SalI and SphI sites of pDR110. Plasmid pJW397 was constructed by excising out the Pspank-thyP3 region from pJW396 by double restriction digest with EcoRI and SphI and replacing it with Pspank-thyP3 sequence in the inverse orientation between the EcoRI and SphI sites. The Pspank-thyP3 sequence for inversion was amplified from pJW396 using primers oJW785 and oJW1137.
Plasmid pJW430 was created by Gibson assembly33 of a DNA fragment containing the lacI-Pspank-thyP3-spec sequences and the portion of the pDR110 plasmid backbone containing the plasmid replication origin, ampR, and amyE front (5′) and back (3′) homology sequences. The DNA fragment with lacI-Pspank-thyP3-spec sequences was amplified from pJW397 using oJW1336/oJW1339. The pDR110 backbone fragment was amplified from pDR110 using oJW1337/oJW1338. Plasmid pJW431 was created in the same way as plasmid pJW430, except the DNA fragment with lacI-Pspank-thyP3-spec sequences was amplified from pJW396, instead of pJW397, using the same primers. Plasmid pJW417 was created by Gibson assembly33 of a DNA fragment containing the spoVG-lacZ sequences and a portion of pDR110 plasmid containing the Ppen promoter and lacA locus 5′ and 3′ homology sequences for integration. The DNA fragment containing the spoVG-lacZ sequence and plasmid backbone were amplified from pEX44 using oJW1200/oJW1201 and oJW1213/oJW1214 respectively. The Ppen promoter was amplified from pDR110 using oJW1202/oJW1203. The lacA 5′ and 3′ homology regions were amplified from the chromosomal DNA of B. subtilis 168 using oJW1215/oJW1199 and oJW1204/oJW1216 respectively.
Deletion mutants of yqjH gene encoding PolIV (JDW2266), adeC encoding adenine deaminase (JDW2501), recA encoding the recombinase RecA (JDW2288) and yxlJ encoding hypoxanthine-DNA glycosylase (JDW2284) were obtained from the Bacillus genetic stock center (BGSC). Co-directional (JDW1563) and head-on thyP3 (JDW1544) strains were transformed with the genomic DNA of each mutant and were selected on erythromycin plates at 37 °C. Deletion of each gene was confirmed by PCR (yqjH-oJW1900/1901; adeC-oJW1904/1905; recA-oJW2008/2009; yxlJ-oJW1906/1907) and recA mutant was also tested for UV sensitivity. Deletion of mismatch repair genes mutS and mutL was created by transforming the genomic DNA of JDW1297 into co-directional (JDW1563) and head-on thyP3 (JDW1544) strains and were selected on kanamycin plates at 37 °C. The kanamycin gene insertion inactivated both mismatch repair genes and insertion was confirmed by PCR (oJW1902/1903).
Forward mutation fluctuation tests
Fluctuation tests were performed to measure the forward mutation rate. All the thyP3 strains were in the background ΔthyA thyB+. For each biological repeat, at least 30 parallel cultures of 0.1 ml in 96-well plates were set up for each strain at a dilution of 1×10⁻⁵ and grown at 37 °C to OD600 = 0.4–0.6 in S7 minimal medium with 20 μg/ml thymine and with 1 mM IPTG (induced transcription) or without IPTG (un-induced transcription). Loss-of-function mutations in thyP3 genes confer resistance to trimethoprim (TMP). For selection of mutants, 0.1 ml of culture was plated on Spizizen’s minimal medium containing 20 μg/ml thymine, 1 mM IPTG and 5 μg/ml trimethoprim. Plates were incubated at 45 °C, and the number of trimethoprim resistant colonies were counted at 48 h (day 2) and 72 h (day 3) of incubation. Serial dilutions of at least 3 cultures were plated on non-selective medium to determine the average colony forming units (CFU). The number of mutations per culture (m) was estimated using the MSS-Maximum Likelihood Estimator (MSS-MLE) method through the Fluctuation AnaLysis CalculatOR (FALCOR) web tool34, and the mutation rate per cell per generation was calculated by m/(2*Nt), where Nt is the average number of cells across cultures in a fluctuation test21. Fluctuation tests of the deletion mutants were performed as described for the wild-type strains above except for recA and mutSL deletion strains. Since recA mutant showed increased sensitivity to trimethoprim, selection of thyP3 mutants was done at 1 μg/ml concentration of trimethoprim and mutant colonies were obtained from day 4 and day 5 after incubation. Fluctuation tests with mutSL mutants were performed identical to wild-type, except that the cultures were diluted 1:20 for selection on trimethoprim plates, since inactivation of mismatch repair increases the mutation rate. The mean of mutation rates from n≥3 independent experiments was plotted with error bars representing standard error. Statistical significance was calculated by paired Student’s t-test of ln(m) values21. We employed a mutation assay for nalidixic acid resistance, which is conferred by mutations in gyrA gene encoding DNA gyrase, to examine whether mutation rate is different outside thyP3 locus between the co-directional and head-on thyP3 strains. For measurement of the mutation rate for nalidixic acid resistance (NalR), at least 30 parallel 1 ml were grown in test tubes to OD600 = 0.4–0.6 and entire cultures were plated on minimal medium containing 20 μg/ml thymine, 1 mM IPTG, and 50 μg/ml nalidixic acid (Sigma-Aldrich). Plates were incubated at 45 °C for 48 h, and the number of plates with no NalR colonies was counted. Serial dilutions were plated on non-selective medium to count the number of CFU. The number of NalR mutations per culture (m) was estimated using the P0 method and the mutation rate was calculated by m/(2*Nt)21. Error bars represent the standard error from at least 3 independent experiments.
Mutation spectra and rates of different mutations
To obtain the mutation spectrum, genomic DNA from one colony per selective plate was extracted by using the prepGEM Bacteria kit (Zygem Corp., New Zealand) and thyP3 was PCR amplified and sequenced using primers oJW1013 and oJW1335. The rate of individual mutation was determined by multiplying the total mutation rate by the proportion of different mutations in the mutation spectra as described35. Statistical significance of differences between co-directional and head-on strains for different mutation types was obtained using Student’s t-test.
Real Time Quantitative Reverse Transcription PCR (qRT-PCR)
Measurement of thyP3 transcription levels was performed by qRT-PCR. Cultures were grown in minimal media with 20 μg/ml thymine, with or without 1 mM IPTG, to OD600 0.4 – 0.6. RNA was isolated using the Qiagen RNeasy kit and reverse-transcribed using SuperScript III reverse transcriptase (Life Technologies). Real-time PCR was performed using SYBR green master mix (Applied Biosystems) with primers oJW1217/oJW1218 for amplifying the beginning of thyP3. The accA gene transcript amplified with primers oJW1221/oJW1222 was used as an internal control36.
Competition assay
Competition experiments were performed between strains carrying the wild-type and mutant thyP3. Strains were grown in S7 minimal medium supplemented with 1% glucose, 0.1% glutamate, 40 μg/ml tryptophan and 1 mM IPTG. Strains in competition were distinguished by integrating a lacZ reporter gene at the lacA locus in the chromosome, enabling the competitors to be distinguished on X-gal indicator plates in which LacZ− and LacZ+ form white and blue colonies respectively. The lacZ marker was swapped between the competing strains to negate any growth effect from the lacZ marker. Strains were preconditioned in the growth medium to saturation. Cultures were then mixed in 1:1 ratio, and serial passage was performed with 1:1000 dilutions (~10 generations per cycle) every 12 h until 70 generations. The ratio of mutant over wild-type at each cycle was estimated by plating the serially diluted cultures on SPII minimal plates supplemented with 40 μg/ml tryptophan, 20 μg/ml thymine and 40 μg/ml X-gal (5-bromo-4-chloro-3-indolyl-β-d-galactopyranoside) at 37 °C. Growth rate was calculated using the initial and final cell densities for each strain in the pair, and the relative fitness was calculated as the ratio of growth rates of mutant over wild-type cells7. Assays were performed with three independent replicates of the mutant tagged with lacZ and another three in which the wild-type was tagged with lacZ. Relative fitness was then expressed as the mean±SD of replicates with and without the marker. In order to rule out reversion of the mutant thyP3 strain during competition growth, strains were plated at the end of 70 generations on X-gal indicator plates with and without thymine at 45 °C and also on trimethoprim plates; only the wild-type formed colonies on plates without thymine and the mutants formed colonies only on plates with thymine. As expected, wild-type did not form colonies on trimethoprim, while the mutants formed colonies. These indicate that the mutants did not revert during competitive growth nor did the wild-type acquired a thyP3 mutation.
Restriction digest screen of promoter mutation
To screen for T-7→C-7 mutation in the promoter, the first half of the thyP3 fragment including the promoter region was PCR amplified with primers oJW1335 and oJW1011 from mutant DNA. The PCR fragment was digested with AflIII enzyme (NEB) and digested products were analyzed in 1.5% agarose gel. PCR fragments containing the T-7→C-7 mutation are digested by AflIII, whereas wild-type fragments are not digested (Extended Data Fig. 8e).
Sequence logo of the −10 element of SigA dependent promoters
We obtained the sequences of the −10 element of all experimentally validated SigA-dependent promoters (n=358) available at the DBTBS database37 and used the WebLogo tool38 to generate the consensus motif with the default parameters to show the genome-wide conservation of the −10 element.
Comparative genomic and molecular evolutionary analyses
For comparative genomic and evolutionary analyses, we used the completed genomes of 8 strains of B. subtilis and one B. amyloliquefaciens strain, a close relative of B. subtilis. The analyzed genomes are listed in Extended Data Table 2. Complete genomes, amino acid and nucleotide sequences of genes and intergenic sequences, and gene annotation information were downloaded from the Integrated Microbial Genomes (IMG) database39. Core genes from B. subtilis and B. amyloliquefaciens were identified by standard all-against-all reciprocal best-hit method using BLASTP. Best bi-directional hits were considered when the alignment had >85% identity with 85% coverage length at an E-value cut-off of 10−20. We eliminated any gene annotated as pseudogene and containing ambiguous nucleotides from the analysis.
To assign genes to leading and lagging strand, we obtained the sequence coordinates of oriC and dif sites from the DoriC database40 for each genome, and using these coordinates in combination with transcript orientation information from the genome annotation files (plus or minus strand), genes were assigned to leading and lagging strands. All genes analyzed were present on the same strand (either leading or lagging) in all the genomes analyzed.
To extract promoter sequences, experimentally validated promoter annotations were obtained for the core genes of B. subtilis strain 168 from the DBTBS database37. Sequence encompassing the transcription start site (+1), the −10 and −35 elements of the promoter was obtained. Using these promoter sequences as references, homologous promoters from the other genomes of B. subtilis and B. amyloliquefaciens were obtained using the blastn-short algorithm of BLASTN employing the 75% identity over 80% alignment coverage with e-value less than 10−5. We obtained 179 promoters (147 and 32 for leading and lagging strand genes, respectively).
The amino acid sequences and the corresponding nucleotide sequences of protein-coding core genes were aligned using the G-INS-i algorithm of the MAFFT alignment program (v7.012b)41. Further, to produce high quality alignments, we used the PAL2NAL program (v12.1)42, which produces codon-based alignments from aligned protein sequences and the corresponding DNA sequences. Additionally, PAL2NAL reports whether the protein and nucleotide sequences have mismatches or in-frame stop codons. The codon-based alignments of the core genes generated by PAL2NAL did not contain any mismatches or in-frame stop codons, which ensured the high quality of the alignments.
For aligning the promoters, we used the E-INS-i algorithm of the MAFFT alignment program, which is optimized for aligning highly conserved motifs interspaced between weakly conserved regions. The alignments of the experimentally validated promoters were manually inspected for any misalignments.
Estimation of nucleotide substitutions in promoters
To estimate nucleotide substitutions in promoters, we first constructed phylogeny using the concatenated sequence of the core genome genes, i.e., genes present in all the analyzed genomes. The aligned nucleotide sequences were concatenated to create a single sequence for each analyzed strain. Phylogeny was constructed using PhyML program43 with 500 bootstrap replicates. The substitution model used was General Time Reversible model (GTR) with discrete gamma model, and gamma parameter was estimated.
For each promoter, substitutions were estimated by pairwise comparison of the different strains using the baseml program of PAML package44. Baseml program uses a maximum likelihood approach to estimate nucleotide substitutions, based on an input phylogenetic tree. We used the maximum likelihood phylogenetic tree generated earlier and the substitution model was GTR. The rest of the parameters were default. Then for each promoter, mean substitutions per site were calculated and the distribution of mean pairwise substitution rates was compared between leading and lagging strand promoters. Mann-Whitney U test was used to determine statistical significance.
For comparing the mutation rates between promoters with and without transcription factor binding, we used the population genetic parameter Watterson’s estimator of Theta (θW). Since theta (θW) is a population genetic parameter, it is well suited for analyzing within species sequence polymorphism and thus θW serves as a proxy for mutation rate of a given promoter. We calculated θW for the total number of mutations in the high quality sequence alignment for each promoter across the 8 strains of Bacillus subtilis (Extended Data Table 2) using the DnaSP software (v5)45. Promoters with experimentally validated transcription factor binding were obtained from the DBTBS database37. Sequence covering the +1 site, −10 and −35 elements that includes the transcription factor-binding site were used for constructing the alignment as described above. A total of 33 different transcription factors that are experimentally validated in B. subtilis were used (Extended Data Table 2). Mann-Whitney U test was used to determine statistical significance.
Nitrous acid mutagenesis
Nitrous acid is known to strongly deaminate purines and pyrimidines in DNA. Adenine is deaminated to hypoxanthine46 that produces A:T to G:C transition. We subjected the wild-type and yxlJ (encoding hypoxanthine-DNA glycosylase)47 mutant strains carrying the head-on thyP3 reporter under induced transcription to nitrous acid treatment following the protocol reported before48. Briefly, cells were grown in 5 mL of S7 minimal medium with 20 μg/ml thymine, 40 μg/ml tryptophan and with 1 mM IPTG for 12 hours to saturation. To the saturated cultures 1 mL of 8.7 M NaNO2 (nitrous acid dissolved in sodium acetate buffer pH 4.6) (Sigma-Aldrich) was added and incubated at room temperature for 60 minutes. As a control, cells were treated with the sodium acetate buffer in parallel. Cells were then spun down, washed and re-suspended in the growth medium and 1 mL of culture was used for determining the CFU and the rest of the culture were plated on minimal plates supplemented with 20 μg/ml thymine, 40 μg/ml tryptophan, 1 mM IPTG and 5 μg/ml trimethoprim for selecting trimethoprim resistance mutants. The same was performed for buffer treated cells except that 0.1 mL of culture was used to determine CFU and 0.1 mL was plated for selecting trimethoprim resistant colonies. After 2 days of incubation, trimethoprim resistance colonies appeared, and as described before the thyP3 gene was PCR amplified and screened for T-7→C-7 mutation. Mutation frequency was calculated by dividing the number of trimethoprim resistant colonies by number of colonies on nonselective plate. Experiment was done in triplicate and error bars represent s.e.m. Statistical significance was obtained using Student’s t-test.
Extended Data
Extended Data Figure 1. Development of a forward mutation assay that detects loss-of-function mutations in B. subtilis.
a, Simplified diagram of thymidine monophosphate (dTMP) synthesis. The phage-encoded thyP3 encodes thymidylate synthetase, which synthesizes dTMP and dihydrofolate (DHF) from dUMP and tetrahydrofolate (THF). DHF is recycled back to THF by dihydrofolate reductase (DHFR). Trimethoprim inhibits DHFR, thus blocking recycling of the essential cofactor THF and available THF is depleted by active thymidylate synthetase and cell growth is inhibited. Because cells with active thymidylate synthetase rely solely on endogenous dTMP synthesis, thyP3+ cells are sensitive to trimethoprim and loss-of-function mutations in thyP3 lead to trimethoprim resistance, which is the basis for the forward mutation assay. Viabilities of wild-type (thyA+ thyBts), thyP3+ (ΔthyA thyBts thyP3+) and thyP3− (ΔthyA thyBts thyP3−) cells are shown in the table and representative colonies (at 45 °C) are shown on the right. b, Competition between strains carrying wild-type (wt) and mutant thyP3 in ΔthyA thyBts background to determine if there is any selective pressure on different mutants during growth phase at permissive temperature (37 °C). Relative fitness (mean±s.d) of six replicates is shown. c, Shifting the temperature to 45 °C does not affect plating efficiency during selection for trimethoprim resistance. Wild type and mutant thyP3 cells were grown at 37 °C and plated on solid medium supplemented with IPTG+thymine at 37 °C and 45 °C, and CFU/mL/OD was determined. Mean±s.d of 3 replicates is shown. d, thyP3 mutants have growth defects without thyBts. The doubling times of thyP3 mutant (a deletion and a frame-shift mutant) in the ΔthyA ΔthyB background at 37 °C are longer, indicative of growth defects in the absence of the backup gene thyB. Mean±s.d of 3 replicates is shown. For b and d, the mutant strains are listed in Extended Data Table 1.
Extended Data Figure 2. Expression level and mutation rate of thyP3.
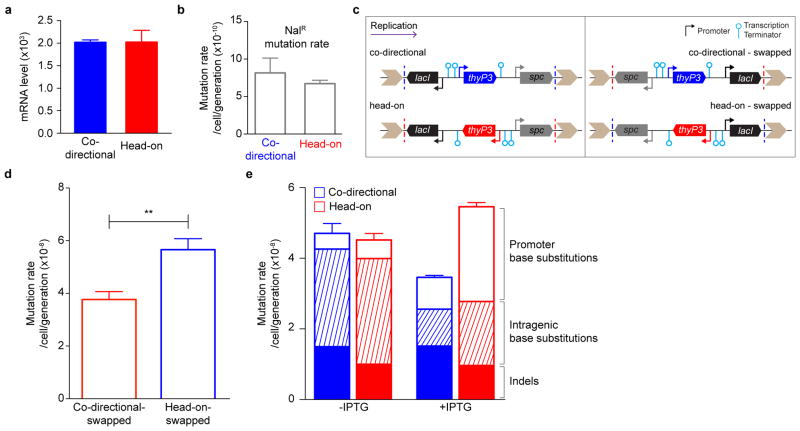
a, thyP3 expression in co-directional and head-on orientations. Using real-time quantitative PCR, mRNA level of thyP3 in the co-directional and head-on strains under induced (+IPTG) condition was measured and normalized to the reference gene accA. Since level of expression is similar between the strains, the observed difference in thyP3 mutation rate between co-directional and head-on orientations (Fig. 1d) is not caused by intrinsic differences in the expression level of thyP3. b, The orientation-specific difference in thyP3 mutation rate is not due to global increase of mutagenesis in the head-on strain. As a control to show that the increase in mutation rate is local to thyP3 reporter, we measured the mutation rate for resistance to nalidixic acid (NalR, conferred by mutations in gyrA gene) in co-directional and head-on strains. Since the NalR mutation rates in the two strains were similar, we conclude that the observed increase in head-on mutation rate is specific to thyP3 gene. c, Schematics of the co-directional and head-on thyP3 constructs (left) and an additional control to examine the effect of the genomic context on thyP3 mutagenesis, the neighboring genes were swapped (right). In each construct, the thyP3 gene is flanked by the lacI gene and the spectinomycin-resistance gene. The reporter constructs were integrated into the chromosome at the amyE locus by double crossover. The direction of replication is shown at the top. The co-directional-swapped strain was created by inverting the lacI-thyP3-spc from the head-on strain and the head-on-swapped construct was created by inverting the same from co-directional strain. Thus the swapped constructs switch the neighboring transcription units. The dotted lines in each construct show the swapping boundary. d, The mutation rate of swapped head-on strain is still higher than swapped co-directional strain when transcription is induced (+IPTG), indicating that the difference in mutation rate between reporter strains is not due to the direction of thyP3 relative to its neighboring genes. e, Mutation rate of co-directional and head-on thyP3 under uninduced (−IPTG) and induced (+IPTG) transcription. The rate of each class of mutations obtained under each condition is also depicted within each bar. For b, d and e mean±s.e.m of n≥3 independent experiments is shown. (**P<0.01, Student’s t-test).
Extended Data Figure 3. Mutation spectra of thyP3 under induced transcription.
Illustrations of the mutation spectra of the thyP3 mutants obtained from fluctuation tests of: a, co-directional (n=214) and b, head-on (n=232) strains when transcription is induced (+IPTG). The thyP3 coding sequence with its promoter is shown. Sequence coordinates are indicated with reference to +1 transcription start site. The symbols used to represent different mutations are shown at the bottom, and base substitutions are shown in blue color above the sequence. The numbers marked in orange next to a mutation denote the frequency. The promoter elements, Shine-Dalgarno (SD) sequence, and start and stop codons are highlighted in each spectrum.
Extended Data Figure 4. Mutation spectra of thyP3 under un-induced transcription.
Illustrations of the mutation spectra of the thyP3 mutants obtained from fluctuation tests of: a, co-directional (n=163) and b, head-on (n=178) strains when transcription is not induced (−IPTG). The thyP3 coding sequence with its promoter is shown. Sequence coordinates are indicated with reference to +1 transcription start site. The symbols used to represent different mutations are shown at the bottom, and base substitutions are shown in blue color above the sequence. The numbers marked in orange next to a mutation denote the frequency. The promoter elements, Shine-Dalgarno (SD) sequence, and start and stop codons are highlighted in each spectrum.
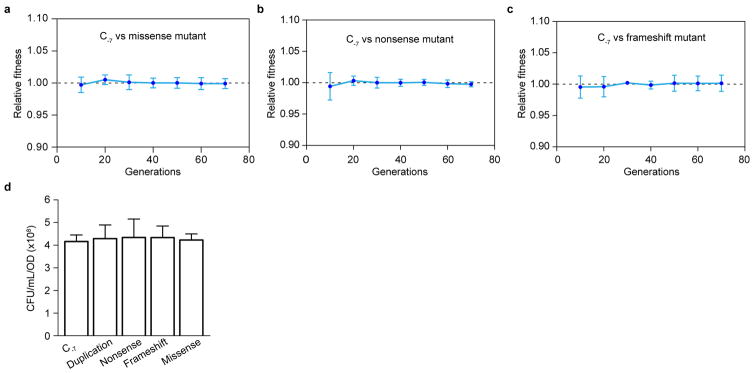
Extended Data Figure 5. Absence of selection bias in thyP3 forward mutation assay.
Growth competition experiments were performed between the C-7 promoter mutant against the following mutants: a, missense mutant, b, nonsense mutant and c, frameshift mutant. Each mutant was competed against the C-7 promoter mutant to check if there is a competitive disadvantage for a mutant that has a mutation within the coding sequence, which may explain the high frequency of C-7 mutation compared to other mutations. The results show no fitness disadvantage for any of the mutants tested suggesting that the high frequency of C-7 promoter mutation is not due to a selection bias. For a–c mean±s.d of six replicates is shown and mutants competed are indicated within the plot. d, Plating efficiency of different thyP3 mutants. Plating efficiency was determined to check whether different classes of thyP3 mutants have differences in their plating efficiency on trimethoprim selection plates at 45 °C, which may explain the variation in the mutation rates and spectrum. The result shows similar plating efficiency among the different mutants, suggesting that plating efficiency does not underlie the variation in the observed mutation rates. The different mutants tested are indicated on the X-axis. Mean±s.d of 3 replicates is shown. The mutant strains are listed in the Extended Data Table 1.
Extended Data Figure 6. Mechanism of indel generation.
a, Representative deletion and duplication events in thyP3. A high frequency deletion and duplication event observed in thyP3 gene in co-directional and head-on strains. The sequence coordinates are denoted and repeat sequence is underlined. b, Table showing the mutation rate of indels (≥3 bp) in intragenic region and promoter normalized by the length of the region suggests that the localized rate of indels is higher in the promoter than the intragenic region. c, First encounter between replication and transcription machineries generates indels. Model describing the first-encounter hypothesis proposed based on results presented in Fig. 2a–f. In co-directional orientation under induced transcription (+IPTG), when an array of RNA polymerase (RNAP) transcribe the gene the replisome is likely to collide with the first transcription complex at the promoter or promoter-proximal regions. On the contrary, when transcription is induced in head-on orientation, the replisome encounters the first transcription complex from the 3′ end. In support of this first encounter model, when transcription is not induced (basal level) the density of RNAP is sparse along the gene, hence the site of collisions are altered. In addition, it is possible that under basal transcription, collision can occur between replisome and RNAP complex arrested at the promoter or with the Lac repressor, which may explain the relatively high frequency of deletion at the promoter. Thus the “first-encounter” model of replication-transcription collisions supports that collisions stall replisome progression triggering indel mutations. d, Mutation rate of insertions and deletions (≥3 bp) within the intragenic region plotted individually. Frequency of insertions is increased by transcription in both co-directional and head-on orientations, whereas deletion frequency is specifically increased in head-on orientation. Mean±s.e.m of n≥3 experiments is shown. e, Models illustrating the different pathways that can lead to generation of indels following head-on collision-induced replication stalling: slippage, fork-reversal or template switching. f, Illustration of a complex mutation observed in thyP3 that is likely generated via Microhomology-Mediated Break Induced Replication (MMBIR). The complex mutation encompassing a deletion and insertion of an inverted region was observed under induced transcription in head-on orientation. The sequence coordinates are marked on the top with reference to the transcription start site (+1).
Extended Data Figure 7. Role of recombination protein RecA in collision-induced mutations.
a, Mutation rates of co-directional and head-on thyP3 strains for trimethoprim resistance in ΔrecA background. Similar to wild-type the mutation rate of head-on is higher than the co-directional strain, although the total rate of mutation is decreased in ΔrecA background. b, Rate of ≥3 bp indels at the promoter in co-directional orientation is strongly decreased in ΔrecA cells suggesting that indels at the promoter are mostly RecA-dependent. c, Intragenic distribution of ≥3 bp indels in ΔrecA is similar to the distribution observed for wild-type (Fig. 2f), thus suggesting that RecA is not necessary for the collision-induced indels within coding region. d, Mutation rate of base substitutions in ΔrecA cells is higher in head-on than co-directional orientation. e, The rate of T-7→C-7 mutation is higher in head-on relative to co-directional orientation in ΔrecA cells, thus promoter substitutions can occur at a higher rate independent of recombination-mediated repair. All the fluctuation tests in ΔrecA background were performed under inducing conditions (+IPTG). For a–e mean±s.e.m of n≥3 experiments is shown. (**P<0.01; ***P<0.001; Student’s t-test)
Extended Data Figure 8. Base substitutions and the role of mismatch repair and enzymatic adenine deamination.
a, IPTG-induction does not affect the base substitution rate in coding region of thyP3 when considering identical target sites, indicating that collisions may not be a major source of these mutations. In yeast, it was shown that transcription-associated mutagenesis is proportional to level of transcription10. In B. subtilis, the total rate of base substitutions in the coding region significantly decreases upon IPTG induction, which could be due to an unidentified transcription dependent mutation-correction mechanism, or due to increase of target size of base substitutions in the coding sequence in un-induced (basal) transcription. b, Table showing the rates of base substitutions in coding region and promoter of thyP3 normalized by length of the region. Localized substitution rates are higher in the promoter than coding sequence, thus suggesting that collision has more drastic effect on promoter substitutions. c, Comparative genomic analysis of mutation rates of promoters with and without repressor binding. Nucleotide diversity per site (Theta) was calculated for each promoter across different strains of Bacillus subtilis. The comparison shows no significant difference in nucleotide diversity between repressor-bound promoters and rest of the promoters, indicating that repressor binding may not affect the substitution rate of a promoter. Whole genomes and the repressors analyzed are listed in Extended Data Table 2. (ns-not significant P>0.05; Mann-Whitney U test). d, The mutation frequency of T-7→C-7 mutation is higher in head-on than co-directional orientation in E. coli. The mutation frequency was calculated here from the plasmid-based forward mutation assay data reported by Yoshiyama et al., (2001)26. e, The restriction digestion-based assay to screen for T-7→C-7 mutation. Wild-type promoter sequence does not have an AflIII restriction site, whereas the promoter T-7→C-7 mutation will be digested by AflIII, which is illustrated by a representative agarose gel. f, Mismatch repair mutant (mutSL::kan) shows an expected increase (~60-fold) in total mutation rate of thyP3 in both co-directional and head-on orientation compared to wild-type. The mutation rates of the wild-type strains are presented before in Fig. 1d. g, Mismatch repair mutant shows a drastic ~1000 fold increase in mutation rate of T→C substitution hotspots within the coding sequence of head-on thyP3, indicating that mismatch repair corrects T→C substitution within coding sequence. h, Deletion of adeC gene encoding adenine deaminase modestly reduces the mutation rate of T-7→C-7 substitution in both co-directional and head-on orientation compared to wild-type. For f–h mean±s.e.m of n≥3 experiments is shown. (*P<0.05; ***P<0.001; Student’s t-test).
Extended Data Table 1.
Strains and plasmids used in this study. a,Bacterial strains used in this study. b, Plasmids used in this study. BGSC - Bacillus Genetic Stock Center (http://www.bgsc.org)
| a
| ||
|---|---|---|
| Name | Genotype | Source |
| JDW437 | (wild-type 168) trpC2 | Lab stock |
| JDW941 | 151 phi3T | Ronald Yasbin |
| JDW942 | 168 thyA− thyB− | Ronald Yasbin |
| JDW1297 | PY79 mutSL::kan | Lyle Simmons |
| JDW1543 | 168 ΔthyA | This work |
| JDW1544 | 168 ΔthyA amyE::Pspank-thyP3 (head-on) spc | This work |
| JDW1563 | 168 ΔthyA amyE::Pspank-thyP3 (co-directional) spc | This work |
| JDW1711 | 168 ΔthyA amyE::Pspank-thyP3 (head-on) spc, lacA::Ppen-spoVG-lacZ | This work |
| JDW1814 | 168 ΔthyA amyE::Pspank-thyP3 (head-on) spc, mutSL::kan | This work |
| JDW1900 | 168 ΔthyA amyE::spc-Pspank-thyP3 (head-on) lacI | This work |
| JDW1901 | 168 ΔthyA amyE::spc-Pspank-thyP3 (co-directional) lacI | This work |
| JDW2054 | 168 ΔthyA amyE::Pspank-thyP3 (head-on) G+473→A+473 spc | This work |
| JDW2057 | 168 ΔthyA amyE::Pspank-thyP3 (head-on) T−7→C−7 spc | This work |
| JDW2185 | 168 ΔthyA amyE::Pspank-thyP3 (head-on) T+331→C+331 spc | This work |
| JDW2190 | 168 ΔthyA amyE::Pspank-thyP3 (head-on) G+473→A+473 spc, lacA::Ppen-spoVG-lacZ | This work |
| JDW2192 | 168 ΔthyA amyE::Pspank-thyP3 (head-on) T−7→C−7 spc, lacA::Ppen-spoVG-lacZ | This work |
| JDW2266 | 168 ΔyqjH | BGSC |
| JDW2284 | 168 ΔyxlJ | BGSC |
| JDW2288 | 168 ΔrecA | BGSC |
| JDW2491 | 168 thyA− thyB− amyE::Pspac(hy)-thyP3 Δ+102-145 deletion spc | This work |
| JDW2492 | 168 thyA− thyB− amyE::Pspac(hy)-thyP3 TT+124 insertion spc | This work |
| JDW2501 | 168 ΔadeC | BGSC |
| JDW2529 | 168 ΔthyA amyE::Pspank-thyP3 (head-on) spc, ΔyqjH | This work |
| JDW2530 | 168 ΔthyA amyE::Pspank-thyP3 (co-directional) spc, ΔyqjH | This work |
| JDW2547 | 168 ΔthyA amyE::Pspank-thyP3 (head-on) spc, ΔadeC | This work |
| JDW2548 | 168 ΔthyA amyE::Pspank-thyP3 (co-directional) spc, ΔadeC | This work |
| JDW2598 | 168 ΔthyA amyE::Pspank-thyP3 (head-on) spc ΔrecA, | This work |
| JDW2612 | 168 ΔthyA amyE::Pspank-thyP3 (co-directional) spc, ΔrecA | This work |
| JDW2697 | 168 ΔthyA amyE::Pspank-thyP3 (head-on) spc, ΔyxlJ | This work |
| JDW2746 | 168 ΔthyA amyE::Pspank-thyP3 (head-on) G+332→A+332 spc | This work |
| JDW2747 | 168 ΔthyA amyE::Pspank-thyP3 (head-on) G+332→A+332 spc, lacA::Ppen-spoVG-lacZ | This work |
| JDW2748 | 168 ΔthyA amyE::Pspank-thyP3 (head-on) +1G+335 spc | This work |
| JDW2749 | 168 ΔthyA amyE::Pspank-thyP3 (head-on) +1G+335 spc, lacA::Ppen-spoVG-lacZ | This work |
| b
| ||
|---|---|---|
| Name | Genotype | Source |
| pDR90 | amyE::Pspac(hy) amp spc | David Rudner |
| pDR110 | amyE::Pspank amp spc | David Rudner |
| pJW299 | pEX44/I-SceI site amp cat | Lab stock |
| pJW331 | pDR90/amyE::Pspac(hy)-thyP3(head-on) amp spc | This work |
| pJW395 | pJW299/ΔthyA I-SceI site amp cat | This work |
| pJW396 | pDR110/amyE::Pspank-thyP3 (head-on) amp spc | This work |
| pJW397 | pDR110/amyE::Pspank-thyP3 (co-directional) amp spc | This work |
| pJW417 | pEX44/lacA::Ppen-spoVG-lacZ amp cat | This work |
| pJW430 | pDR110/amyE::spc-Pspank-thyP3 (head-on) lacI amp | This work |
| pJW431 | pDR110/amyE::spc-Pspank-thyP3 (co-directional) lacI amp | This work |
Extended Data Table 2.
Primers, whole genome sequences and transcriptional regulators used in this study. a,Primers used in this study. b, Whole genome sequences used in this study. c, Transcriptional regulators analyzed in this study
| a
| |
|---|---|
| Name | Sequence 5′ →3′ |
| oJW760 | GGTGTCGACATGACTCAATTCGATAAACAA |
| oJW761 | AATGGCATGCCAATATTTCACCAATTTCAT |
| oJW785 | GTATGAATTCCAATATTTCACCAATTTCAT |
| oJW1011 | GCGGATAACAATTTCACACAGGGTCTTCTTGTTTCCACTGAT |
| oJW1013 | GCGGATAACAATTTCACACAGG CAATATTTCACCAATTTCAT |
| oJW1052 | GGTAGAATTCACGTTATGGTTAAGATTCAA |
| oJW1053 | AATGCTCGAGTATCCTTCTTTCATTTTCAG |
| oJW1054 | GGTACTCGAGTAGCAGGTATCCTAATTTCA |
| oJW1055 | AATGGGATCCCAGTCCAAATGACAATCTAT |
| oJW1137 | ATTGGCATGCTCGACTCTCTAGCTTGAG |
| oJW1199 | TGGTGTCAAAAATAACTCGACCTTCGATATGGGCGGATTCTT |
| oJW1200 | GAATCCGCCCATATCGAAGGTCGAGTTATTTTTGACACCA |
| oJW1201 | TGATGTTTGAGTCGGCTGATAGGGAAAAGGTGGTGAACTAC |
| oJW1202 | GTAGTTCACCACCTTTTCCCTATCAGCCGACTCAAACATCAAA |
| oJW1203 | GGCTAAGAGAACAAGGAGGAGACGGTGGAAACGAGGTCATCATTT |
| oJW1204 | ATGACCTCGTTTCCACCGTCTCCTCCTTGTTCTCTTAGCC |
| oJW1213 | CATAAAGGCTAGGGATAACAGGGTAATCCGCTCACAATTCCACACAAC |
| oJW1214 | GCAGACGTTGCCATATCCAATTCAAGCTGGGGATCCTAGAAGCT |
| oJW1215 | CTTCTAGGATCCCCAGCTTGAATTGGATATGGCAACGTCTGCCC |
| oJW1217 | CAGAGGTTCCGATTTTAAC |
| oJW1218 | TCAATTCAGTAACATCGTTC |
| oJW1221 | GCTTCAGGATGATATTTACAA |
| oJW1222 | CAGGTGTTCGATATAATCAAG |
| oJW1335 | GTAAAACGACGGCCAGTGCGTTTCGGTGATGAAGAT |
| oJW1336 | ATTAAAAACTGGTCTGATCGCTATGCAAGGGTTTATTGTT |
| oJW1337 | AACAATAAACCCTTGCATAGCGATCAGACCAGTTTTTAAT |
| oJW1338 | AGGAAATCCATTATGTACTATTTAGTACGCCTCTTTTCTTTTC |
| oJW1339 | GAAAAGAAAAGAGGCGTACTAAATAGTACATAATGGATTTCCT |
| oJW1902 | CCTGACTGGGAAGAGGATGACG |
| oJW1903 | TCAGCTTTCATGGCTATCATTGAAC |
| oJW1904 | CTGGCTGGAAATACGCTTCTCG |
| oJW1905 | GATCAACGACGCTCAAGAGCTCA |
| oJW1906 | GGACTGTCCGCGTCGTTACGT |
| oJW1907 | GCTTCCTCGCTCCCTTGGG |
| oJW2008 | GGCATGAGCCTGGGCATGTG |
| oJW2009 | CTCCGTCTGCGTTTCGCAGTTC |
| b
| |
|---|---|
| Bacillus genomes | NCBI_accession |
| Bacillus subtilis subtilis 168 | NC_000964.3 |
| Bacillus subtilis subtilis BSP1 | CP003695 |
| Bacillus subtilis QB928 | CP003783.1 |
| Bacillus subtilis 6051HGW | CP003329 |
| Bacillus subtilis spizizenii W23 | NC_014479.1 |
| Bacillus subtilis subtilis RO-NN-1 | CP002906 |
| Bacillus subtilis spizizenii TU-B-10 | NC_016047 |
| Bacillus subtilis BSn5 | NC_014976.1 |
| Bacillus amyloliquefaciens FZB42 | NC_009725.1 |
| c
| |
|---|---|
| Regulator name | Function |
| AbrB | transcriptional regulator for transition state genes |
| AhrC | arginine repressor |
| AraR | transcriptional repressor of the ara regulon (LacI family) |
| BkdR | transcriptional regulator |
| CcpA | transcriptional regulator (LacI family) |
| CodY | transcriptional repressor CodY |
| ComA | two-component response regulator |
| ComK | competence transcription factor (CTF) |
| CtsR | transcriptional regulator |
| DegU | two-component response regulator |
| Fnr | transcriptional regulator (FNR/CAP family) |
| Fur | transcriptional regulator for iron transport and metabolism |
| GInR | transcriptional regulator (nitrogen metabolism) |
| GItC | transcriptional regulator (LysR family) |
| GItR | transcriptional regulator (LysR family) |
| Hpr | transcriptional regulator Hpr |
| HrcA | heat-inducible transcription repressor |
| IoIR | transcriptional regulator (DeoR family) |
| LevR | transcriptional regulator (NifA/NtrC family) |
| LexA | transcriptional repressor of the SOS regulon |
| MntR | manganese transport transcriptional regulator |
| Mta | transcriptional regulator (MerR family) |
| PerR | transcriptional regulator (Fur family) |
| PucR | transcriptional regulator of the purine degradation operon |
| PurR | pur operon repressor |
| ResD | two-component response regulator |
| RocR | transcriptional regulator (NtrC/NifA family) |
| SinR | transcriptional regulator for post-exponenetial-phase-response |
| Spo0A | master regulator of sporulation |
| SpoIIID | transcriptional regulator of mother cell gene expression |
| TnrA | nitrogen sensing transcriptional regulator |
| Xre | Phage PBSX transcriptional regulator |
| Zur | transcriptional regulator (Fur family) |
Acknowledgments
We thank E. Robleto, R. Yasbin and L. Simmons for strains, M. Cox, R. Gourse, C. Hittinger, R. Landick, K. Wasserman, C. Gross, M. Laub, S. Rosenberg, L. Simmons and the Wang lab for discussions and comments on the manuscript. This work was supported by NIH Director’s New Innovator Award DP2OD004433 to JDW.
Footnotes
Author Contributions:
J.D.W. conceptualized the study. T.S.S., B.D.W. and J.D.W. designed the experiments. T.S.S. performed thyP3 fluctuation tests and sequencing of recA, yqjH, mutSL, adeC mutants, comparative genomic analyses, nitrous acid mutagenesis, competition assays and plating efficiency of mutants. B.D.W. developed the forward mutation assay, fluctuation tests and sequencing of wild-type strains, qRT-PCR, nalidixic acid fluctuation test, doubling time measurements and developed the restriction digest screening. Y.D. assisted the competition assay, plating efficiency and mutSL fluctuation tests. S.A.L. performed thyP3 fluctuation tests with B.D.W. T.S.S., B.D.W. and J.D.W. analyzed the data and wrote the manuscript.
The authors declare no competing financial interests.
Readers are welcome to comment on the online version of this article at www.nature.com/nature.
References
- 1.French S. Consequences of replication fork movement through transcription units in vivo. Science. 1992;258:1362–5. doi: 10.1126/science.1455232. [DOI] [PubMed] [Google Scholar]
- 2.Liu B, Alberts BM. Head-on collision between a DNA replication apparatus and RNA polymerase transcription complex. Science. 1995;267:1131–7. doi: 10.1126/science.7855590. [DOI] [PubMed] [Google Scholar]
- 3.Vilette D, Ehrlich SD, Michel B. Transcription-induced deletions in Escherichia coli plasmids. Mol Microbiol. 1995;17:493–504. doi: 10.1111/j.1365-2958.1995.mmi_17030493.x. [DOI] [PubMed] [Google Scholar]
- 4.Prado F, Aguilera A. Impairment of replication fork progression mediates RNA polII transcription-associated recombination. EMBO J. 2005;24:1267–76. doi: 10.1038/sj.emboj.7600602. [DOI] [PMC free article] [PubMed] [Google Scholar]
- 5.Mirkin EV, Mirkin SM. Mechanisms of transcription-replication collisions in bacteria. Mol Cell Biol. 2005;25:888–895. doi: 10.1128/MCB.25.3.888-895.2005. [DOI] [PMC free article] [PubMed] [Google Scholar]
- 6.Pomerantz RT, O’Donnell M. The replisome uses mRNA as a primer after colliding with RNA polymerase. Nature. 2008;456:762–6. doi: 10.1038/nature07527. [DOI] [PMC free article] [PubMed] [Google Scholar]
- 7.Srivatsan A, Tehranchi A, MacAlpine DM, Wang JD. Co-orientation of replication and transcription preserves genome integrity. PLoS Genet. 2010;6:e1000810. doi: 10.1371/journal.pgen.1000810. [DOI] [PMC free article] [PubMed] [Google Scholar]
- 8.Dutta D, Shatalin K, Epshtein V, Gottesman ME, Nudler E. Linking RNA polymerase backtracking to genome instability in E. coli. Cell. 2011;146:533–43. doi: 10.1016/j.cell.2011.07.034. [DOI] [PMC free article] [PubMed] [Google Scholar]
- 9.Merrikh H, Machón C, Grainger WH, Grossman AD, Soultanas P. Co-directional replication-transcription conflicts lead to replication restart. Nature. 2011;470:554–7. doi: 10.1038/nature09758. [DOI] [PMC free article] [PubMed] [Google Scholar]
- 10.Kim N, Jinks-Robertson S. Transcription as a source of genome instability. Nat Rev Genet. 2012;13:204–214. doi: 10.1038/nrg3152. [DOI] [PMC free article] [PubMed] [Google Scholar]
- 11.Paul S, Million-Weaver S, Chattopadhyay S, Sokurenko E, Merrikh H. Accelerated gene evolution through replication-transcription conflicts. Nature. 2013;495:512–5. doi: 10.1038/nature11989. [DOI] [PMC free article] [PubMed] [Google Scholar]
- 12.Fijalkowska IJ, Jonczyk P, Tkaczyk MM, Bialoskorska M, Schaaper RM. Unequal fidelity of leading strand and lagging strand DNA replication on the Escherichia coli chromosome. Proc Natl Acad Sci U S A. 1998;95:10020–10025. doi: 10.1073/pnas.95.17.10020. [DOI] [PMC free article] [PubMed] [Google Scholar]
- 13.Bruand C, Bidnenko V, Ehrlich SD. Replication mutations differentially enhance RecA-dependent and RecA-independent recombination between tandem repeats in Bacillus subtilis. Mol Microbiol. 2001;39:1248–58. doi: 10.1111/j.1365-2958.2001.02312.x. [DOI] [PubMed] [Google Scholar]
- 14.Hastings PJ, Lupski JR, Rosenberg SM, Ira G. Mechanisms of change in gene copy number. Nat Rev Genet. 2009;10:551–64. doi: 10.1038/nrg2593. [DOI] [PMC free article] [PubMed] [Google Scholar]
- 15.Kunkel TA. Evolving views of DNA replication (in)fidelity. Cold Spring Harb Symp Quant Biol. 2009;74:91–101. doi: 10.1101/sqb.2009.74.027. [DOI] [PMC free article] [PubMed] [Google Scholar]
- 16.Rocha EPC, Danchin A. Essentiality, not expressiveness, drives gene-strand bias in bacteria. Nat Genet. 2003;34:377–378. doi: 10.1038/ng1209. [DOI] [PubMed] [Google Scholar]
- 17.Reijns MAM, et al. Lagging-strand replication shapes the mutational landscape of the genome. Nature. 2015;518:502–6. doi: 10.1038/nature14183. [DOI] [PMC free article] [PubMed] [Google Scholar]
- 18.Schroeder JW, Hirst WG, Szewczyk GA, Simmons LA. The Effect of Local Sequence Context on Mutational Bias of Genes Encoded on the Leading and Lagging Strands. Curr Biol. 2016;26:692–7. doi: 10.1016/j.cub.2016.01.016. [DOI] [PMC free article] [PubMed] [Google Scholar]
- 19.Million-Weaver S, et al. An underlying mechanism for the increased mutagenesis of lagging-strand genes in Bacillus subtilis. Proc Natl Acad Sci U S A. 2015 doi: 10.1073/pnas.1416651112. [DOI] [PMC free article] [PubMed] [Google Scholar]
- 20.Luria SE, Delbrück M. Mutations of Bacteria from Virus Sensitivity to Virus Resistance. Genetics. 1943;28:491–511. doi: 10.1093/genetics/28.6.491. [DOI] [PMC free article] [PubMed] [Google Scholar]
- 21.Rosche WA, Foster PL. Determining mutation rates in bacterial populations. Methods. 2000;20:4–17. doi: 10.1006/meth.1999.0901. [DOI] [PMC free article] [PubMed] [Google Scholar]
- 22.Mirkin EV, Castro Roa D, Nudler E, Mirkin SM. Transcription regulatory elements are punctuation marks for DNA replication. Proc Natl Acad Sci U S A. 2006;103:7276–81. doi: 10.1073/pnas.0601127103. [DOI] [PMC free article] [PubMed] [Google Scholar]
- 23.Vilette D, Uzest M, Ehrlich SD, Michel B. DNA transcription and repressor binding affect deletion formation in Escherichia coli plasmids. EMBO J. 1992;11:3629–34. doi: 10.1002/j.1460-2075.1992.tb05447.x. [DOI] [PMC free article] [PubMed] [Google Scholar]
- 24.Tehranchi AK, et al. The transcription factor DksA prevents conflicts between DNA replication and transcription machinery. Cell. 2010;141:595–605. doi: 10.1016/j.cell.2010.03.036. [DOI] [PMC free article] [PubMed] [Google Scholar]
- 25.Feklistov A, Darst Sa. Structural basis for promoter-10 element recognition by the bacterial RNA polymerase σ subunit. Cell. 2011;147:1257–69. doi: 10.1016/j.cell.2011.10.041. [DOI] [PMC free article] [PubMed] [Google Scholar]
- 26.Yoshiyama K, Higuchi K, Matsumura H, Maki H. Directionality of DNA replication fork movement strongly affects the generation of spontaneous mutations in Escherichia coli. J Mol Biol. 2001;307:1195–1206. doi: 10.1006/jmbi.2001.4557. [DOI] [PubMed] [Google Scholar]
- 27.Schaaper RM, Danforth BN, Glickman BW. Mechanisms of spontaneous mutagenesis: an analysis of the spectrum of spontaneous mutation in the Escherichia coli lacI gene. J Mol Biol. 1986;189:273–84. doi: 10.1016/0022-2836(86)90509-7. [DOI] [PubMed] [Google Scholar]
- 28.Lu AL, Clark S, Modrich P. Methyl-directed repair of DNA base-pair mismatches in vitro. Proc Natl Acad Sci U S A. 1983;80:4639–43. doi: 10.1073/pnas.80.15.4639. [DOI] [PMC free article] [PubMed] [Google Scholar]
- 29.Zhang Y, et al. Structural basis of transcription initiation. Science. 2012;338:1076–80. doi: 10.1126/science.1227786. [DOI] [PMC free article] [PubMed] [Google Scholar]
- 30.Zuo Y, Steitz TA. Crystal Structures of the E. coli Transcription Initiation Complexes with a Complete Bubble. Mol Cell. 2015;58:534–40. doi: 10.1016/j.molcel.2015.03.010. [DOI] [PMC free article] [PubMed] [Google Scholar]
- 31.Vasantha N, Freese E. Enzyme changes during Bacillus subtilis sporulation caused by deprivation of guanine nucleotides. J Bacteriol. 1980;144:1119–1125. doi: 10.1128/jb.144.3.1119-1125.1980. [DOI] [PMC free article] [PubMed] [Google Scholar]
- 32.Janes BK, Stibitz S. Routine Markerless Gene Replacement in Bacillus anthracis. 2006;74:1949–1953. doi: 10.1128/IAI.74.3.1949-1953.2006. [DOI] [PMC free article] [PubMed] [Google Scholar]
- 33.Gibson DG, et al. Enzymatic assembly of DNA molecules up to several hundred kilobases. Nat Methods. 2009;6:343–5. doi: 10.1038/nmeth.1318. [DOI] [PubMed] [Google Scholar]
- 34.Hall BM, Ma CX, Liang P, Singh KK. Fluctuation analysis CalculatOR: a web tool for the determination of mutation rate using Luria-Delbruck fluctuation analysis. Bioinformatics. 2009;25:1564–5. doi: 10.1093/bioinformatics/btp253. [DOI] [PMC free article] [PubMed] [Google Scholar]
- 35.Lippert MJ, et al. Role for topoisomerase 1 in transcription-associated mutagenesis in yeast. Proc Natl Acad Sci U S A. 2011;108:698–703. doi: 10.1073/pnas.1012363108. [DOI] [PMC free article] [PubMed] [Google Scholar]
- 36.Ter Beek A, et al. Transcriptome analysis of sorbic acid-stressed Bacillus subtilis reveals a nutrient limitation response and indicates plasma membrane remodeling. J Bacteriol. 2008;190:1751–61. doi: 10.1128/JB.01516-07. [DOI] [PMC free article] [PubMed] [Google Scholar]
- 37.Sierro N, Makita Y, de Hoon M, Nakai K. DBTBS: a database of transcriptional regulation in Bacillus subtilis containing upstream intergenic conservation information. Nucleic Acids Res. 2008;36:D93–6. doi: 10.1093/nar/gkm910. [DOI] [PMC free article] [PubMed] [Google Scholar]
- 38.Crooks GE, Hon G, Chandonia JM, Brenner SE. WebLogo: a sequence logo generator. Genome Res. 2004;14:1188–90. doi: 10.1101/gr.849004. [DOI] [PMC free article] [PubMed] [Google Scholar]
- 39.Markowitz VM, et al. IMG: the Integrated Microbial Genomes database and comparative analysis system. Nucleic Acids Res. 2012;40:D115–22. doi: 10.1093/nar/gkr1044. [DOI] [PMC free article] [PubMed] [Google Scholar]
- 40.Gao F, Zhang CT. DoriC: a database of oriC regions in bacterial genomes. Bioinformatics. 2007;23:1866–7. doi: 10.1093/bioinformatics/btm255. [DOI] [PubMed] [Google Scholar]
- 41.Katoh K, Toh H. Parallelization of the MAFFT multiple sequence alignment program. Bioinformatics. 2010;26:1899–900. doi: 10.1093/bioinformatics/btq224. [DOI] [PMC free article] [PubMed] [Google Scholar]
- 42.Suyama M, Torrents D, Bork P. PAL2NAL: robust conversion of protein sequence alignments into the corresponding codon alignments. Nucleic Acids Res. 2006;34:W609–12. doi: 10.1093/nar/gkl315. [DOI] [PMC free article] [PubMed] [Google Scholar]
- 43.Guindon S, et al. New algorithms and methods to estimate maximum-likelihood phylogenies: assessing the performance of PhyML 3.0. Syst Biol. 2010;59:307–21. doi: 10.1093/sysbio/syq010. [DOI] [PubMed] [Google Scholar]
- 44.Yang Z. PAML 4: phylogenetic analysis by maximum likelihood. Mol Biol Evol. 2007;24:1586–91. doi: 10.1093/molbev/msm088. [DOI] [PubMed] [Google Scholar]
- 45.Librado P, Rozas J. DnaSP v5: a software for comprehensive analysis of DNA polymorphism data. Bioinformatics. 2009;25:1451–2. doi: 10.1093/bioinformatics/btp187. [DOI] [PubMed] [Google Scholar]
- 46.Lindahl T. Instability and decay of the primary structure of DNA. Nature. 1993;362:709–15. doi: 10.1038/362709a0. [DOI] [PubMed] [Google Scholar]
- 47.Aamodt RM, Falnes PØ, Johansen RF, Seeberg E, Bjørås M. The Bacillus subtilis counterpart of the mammalian 3-methyladenine DNA glycosylase has hypoxanthine and 1,N6-ethenoadenine as preferred substrates. J Biol Chem. 2004;279:13601–6. doi: 10.1074/jbc.M314277200. [DOI] [PubMed] [Google Scholar]
- 48.ZAMENHOF S. Gene unstabilization induced by heat and by nitrous acid. J Bacteriol. 1961;81:111–7. doi: 10.1128/jb.81.1.111-117.1961. [DOI] [PMC free article] [PubMed] [Google Scholar]


