

Abstract
One difficult problem in the analysis of peptide modifications is quantifying isomeric modifications that differ by the position of the amino acid modified. HPLC separation using C18 reverse phase chromatography coupled with electron transfer dissociation (ETD) in tandem mass spectrometry has recently been shown to be able to relatively quantify how much of a given modification occurs at each amino acid position for isomeric mixtures; however, the resolution of reverse phase chromatography greatly complicates quantification of isomeric modifications by ETD due to the chromatographic separation of peptides with identical modifications at different sequence positions. Using peptide oxidation as a model system, we investigated the use of size exclusion chromatography coupled with ETD fragmentation to separate peptide sequences. This approach allows for the benefits of chromatographic separation of peptide sequences while ensuring co-elution of modification isomers for accurate relative quantification of modifications using standard data-dependent acquisitions. Using this method, the relative amount of modification at each amino acid can be accurately measured from single ETD MS/MS spectra in a standard data-dependent acquisition experiment.
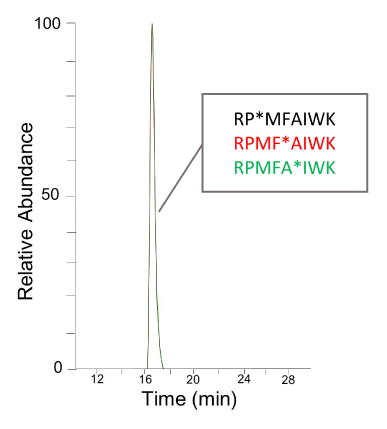
Graphical Abstract
Introduction
Proteins and peptides are susceptible to a variety of modifications that can affect their structure and biological functions. Mass spectrometry has been successfully used to identify even labile protein modifications, including protein phosphorylation1–2, and O-GlcNAc modifications3–4, as well as identifying chemical modifications including covalent labeling for protein surface mapping5–6, crosslinking7–8, deamidation of asparagine9–10, and protein oxidation11–12. In all of these systems, the amount of modification that occurs at each amino acid of a peptide or protein can have serious consequences to the interpretation of the data, whether for understanding chemical or enzymatic modification mechanisms and consequences13–16 or for interpreting data from covalent labeling or chemical cross-linking studies7, 17–20. However, when the same modification can occur on multiple amino acids in a peptide, quantifying what fraction of a given modification occurs at each potential modification site is a significant analytical challenge. In the absence of widespread internal fragmentation, only the modification sites farthest to the N- and/or C-termini will give unique product ions. Any internal modifications will, at best, change the ratio of modified to unmodified product ion21.
Previous methods used to identify and relatively quantify peptide isomers that differ solely by the site of modification involve using liquid chromatography (LC) to separate modification isomers, followed by tandem mass spectrometry (MS/MS) to identify the modification product in each MS/MS spectrum. The partial separation of modification isomers often obtained by C18 reverse phase (RP) chromatography results in complicated data interpretation for both identifying and quantifying sites of modification. When all isomers can be separated to baseline, quantification should be possible by integration of the selected ion chromatogram for each peak (although inaccuracies using this method have been reported for oxidized peptides in model systems)13, 17, 22–23. When isomers perfectly co-elute, relative quantification is possible by MS/MS fragmentation of the isomeric mixture of modification sites at any reasonable point during the elution, with quantification by analysis of the relative intensities of each modified and unmodified product ion in the MS/MS spectrum13, 24. The commonly used collision-induced dissociation (CID) fragmentation method has been shown to inaccurately measure the modification extent at residue level for several modification25–27, while electron transfer dissociation (ETD) has been shown to provide more accurate identification and quantification for several peptide modifications, including complex mixtures of peptide oxidation products13, 24, 28–29.
However, when modification isomers partially separate chromatographically, neither LC peak integration nor single spectrum ETD-based MS/MS accurately quantifies modification isomers. Large numbers of regular ETD MS/MS experiments must be scheduled to fully cover all chromatographic peaks of each modification isomer to obtain an accurate relative quantification, which requires both custom method development for each experimental system and considerable instrument time to be dedicated to each peptide. A method which allowed for the perfect co-elution of peptide modification isomers, while still separating different peptide sequences, would allow for a simpler and more efficient quantification and identification of peptide modifications by ETD. Size exclusion chromatography (SEC) is a separation method separates molecules based on their size rather than their hydrophobicity. Due to the inherent characteristic of isomers that they all share the same molecular weight, it is possible to use the SEC to achieve co-elution of the peptide isomers, at least for small amino acid modifications. If ideal co-elution of all modification isomers is achieved, relative quantification of the amount of modification at each amino acid position should be possibly using a singly quality ETD spectrum taken at any point in the chromatographic peak as obtained in standard data-dependent experiment methods.
In order to test the ability of SEC-ETD MS/MS to accurately quantify amino acid modifications, we examined peptides and proteins modified by hydroxyl radicals in a hydroxyl radical protein footprinting (HRPF) experiment. Hydroxyl radicals are capable of generating isomeric modifications at a wide variety of amino acids simultaneously13, 30, and therefore represent one of the more challenging problems in quantification of modification isomers currently experienced in mass spectrometry. We tested two sets of synthetic, isomeric modified peptides, one of which has been previously reported21, 31, as well as a more complex lysozyme sample modified in a HRPF experiment to determine if SEC coupled with ETD MS/MS was capable of identifying and quantifying sites of oxidation both accurately and robustly. SEC-ETD MS/MS yielded accurate relative quantification results in synthetic mixtures, as well as results on oxidized lysozyme that were consistent with thorough RP-ETD MS/MS results, while requiring a small fraction of the instrument time and using a general ETD LC-MS/MS method.
Experimental
Catalase, formic acid, L-glutamine, hen-egg lysozyme and ammonium bicarbonate were obtained from Sigma-Aldrich (St. Louis, MO, USA). Hydrogen peroxide was obtained from J.T. Baker (Philipsburg, NJ). Dithiothreitol (DTT), HPLC-grade acetonitrile (ACN) and sequencing-grade trypsin was purchased from Fisher Scientific (Fair Lawn, NJ). Methionine amide was purchased from Bachem (Torrace, CA). Purified water (18 MΩ) was obtained from an in-house Milli-Q Synthesis system (Millipore, Billerica, MA, USA). The oxidized isomers of standard peptides RPMFAIWK and FESNFNTQATNR (lysozyme tryptic peptide 45–56): RP*MFAIWK (Pro2→hyp2), RPMF*AIWK (Phe4→Tyr4), RPMFA*IWK (Ala5→Ser5), F*ESNFNTQATNR (Phe1→Tyr1), FESNF*NTQATNR (Phe5→Tyr5), and FESNFNTQA*TNR (Ala9→Ser9) were synthesized by GenScript USA Inc. (Piscataway, NJ, USA).
The working stocks of the six synthetic peptides were prepared by diluting solutions using the starting mobile phase (4% ACN for RP, and 45% ACN for SEC) and mix isomeric peptides in the following volume ratios, 1:1:1, 1:2:3, 3:2:1, 1:1:6, 1:6:1, and 6:1:1 for each peptide isomer set and 1:1:1:1:1:1, 1:1:2:1:1:2, 1:2:1:1:2:1, and 2:1:1:2:1:1 for mix of all isomeric peptide isomers. 1μg of each mixture was injected for LC-MS analysis. HRPF and tryptic digestion of hen-egg lysozyme was performed using FPOP as previously described and summarized in Supplementary Information.
All analyses were performed using a Thermo Orbitrap Elite (Thermo Fisher Scientific, Waltham, MA, USA) coupled to an Ultimate 3000 Nano LC system (Dionex, Sunnyvale, CA, USA). RP separation was conducted in a 150 × 0.075 mm PepMap 100 C18 analytical column with 3 μm particle size and a 20 × 0.075 mm PepMap 100 C18 trap column with 3 μm particle size respectively (Thermo Fisher Scientific, Waltham, MA, USA). The gradient elution was performed from 4% to 40% acetonitrile in 0.1% formic acid over 22 min at a flow rate of 0.3 μL/min, and then increased to 90% acetonitrile in 0.1% formic acid for 2 min followed by a 15 min re-equilibration step for RP C18 analytical column. For trap column separation, the gradient elution was performed from 4% to 60% acetonitrile in 0.1% formic acid over 7 min at a flow rate of 0.5 μL/min, and then increased to 90% acetonitrile in 0.1% formic acid for 2 min followed by a 15 min re-equilibration step. SEC was performed using a 7.8 × 300 mm TSKgel G2000SWXL column with 5μm particle size (TOSHO Bioscience, King of Prussia, PA, USA). Mobile phase used was 45% ACN with 0.1% formic acid at a flow rate of 400 μL/min. The product ion intensities from ETD are used for the calculation of oxidation rate at specific residue site using a similar approach reported previously and are described in detail in Supplementary Information13, 28.
Results and Discussion
Co-elution and relative quantification of modified peptide isomers using SEC-ETD method
In order to achieve co-elution of the oxidized peptide isomers, synthetic peptides RPMFAIWK (where Pro2, Phe4, or Ala5 is replaced with hydroxyproline, tyrosine, or serine respectively) and FESNFNTQATNR (where Phe1, Phe5, or Ala9 is replaced with tyrosine or serine) were used to test two different LC methods. Each peptide isomer set was mixed in 1:1:1 volume ratio. Most of the isomers from each peptide isomer set were baseline separated using the RP C18 analytical column with the exception being the partially co-eluting – Pro2 and Ala5 peptides (Figure 1a). None of the various gradient conditions we attempted allowed for the separation of the two peptide sequences with co-elution of the oxidation isomers using the PepMap C18 column (data not shown). To test if we could achieve a co-elution of these isomers by RP chromatography using a shorter column, separation using only a RP C18 trap column with a steep elution gradient was also tested. The chromatography using only trap column shows separation of the two different peptide sequences, but a single peak for each peptide isomer set was observed with a retention time of 6.33 min for all the isomers of RPMFAIWK, and 5.71 min for all isomers of FESNFNTQATNR (Figure S1).
Figure 1.
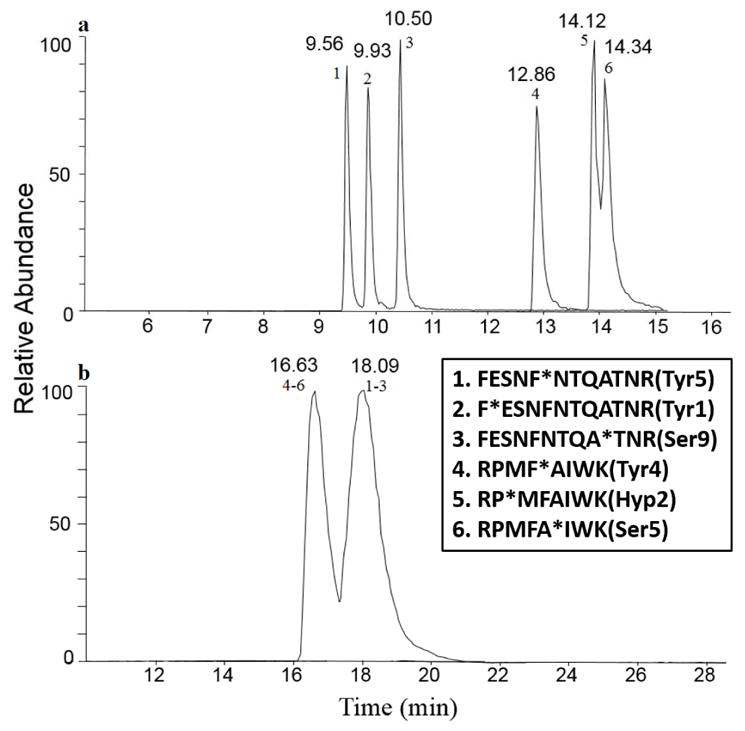
Chromatography for peptide isomer sets using two different LC methods. (a) C18 RP, most isomers were baseline separated; and (b) TSKgel SEC, peptide sequences were separated, while oxidation isomers co-eluted.
SEC was also tested for its ability to separate the different peptide sequences while allowing modification isomers to co-elute (Figure 1b). All three isomers from each peptide isomer set co-eluted in a single peak, whereas, the two different peptide sequences were separated because of their difference in size (16.63 min for all isomers of RPMFAIWK, and 18 min for all isomers of FESNFNTQATNR).
The measured oxidation at each modified residue site was measured at various retention times for both trap column RP and SEC. The 1:1:1 ratio samples should give 33.3% for each isomer from the mixture through the whole chromatographic peak area if all three isomers co-eluted ideally. A partial separation of modified isomers in an unresolved peak would give inaccurate modification percentages that changes across the whole peak width. Multiple retention times were selected for each eluted peak to determine if the elution time of measurement effected the composition reported by ETD. As expected, the ETD-based relative quantification correctly identified the modified residues as the only modified residue when baseline resolution was achieved using the PepMap C18 column, while identifying both components when co-elution occurred (Figure S2 a–b). For chromatography using RP C18 trap column, even though a single peak was shown for all the isomers in each different peptide sequence, the calculated modification percentage clearly indicated partial separation within the observed single peak (Figure S2 c–d). For peptide sequence RPMFAIWK, Try4 eluted at the leading edge of the peak, followed by elution of Hyp2 and followed closely by Ser5. For peptide sequence FESNFNTQATNR, Tyr5 with small amount of Tyr1 started to elute at around 20% leading edge of the peak. Ser9 appeared at 100% peak height, with the different isomers trailing at different rates at the tail of the peak. The result of both C18 RP measurement is that the relative quantification of the amount of modification of each amino acid residue depends entirely upon where in the chromatographic peak the ETD spectrum is obtained, and ETD spectra must be obtained and average across the entire elution time to achieve reasonably accurate results. No conditions could be found for either the PepMap column or the C18 trap column that allowed for ideal co-elution of the modification isomers.
As shown in Figure 2, the SEC-ETD method gave similar relative quantification results across the entire elution window for both peptide sequence sets (7 time points were selected, which were 20%, 50% and 80% peak height at leading edge, 100% peak height, and 20%, 50% and 80% peak height at tailing edge). Visual inspection of product ions specific for terminal oxidation isomers indicate a thorough overlap of the terminal oxidized isomer (P2→Hyp or A9→Ser) with isomers modified elsewhere in the sequence. Also, the calculated value from each single ETD spectra has the similar value as the one calculated from averaged ETD spectra, which is 37.7% for Hyp2, 32.1% for Tyr4, and 30.2% for Ser9 for peptide sequence RPMFAIWK; 30.9% for Tyr1, 30% for Tyr5, and 39.1% for Ala9 for peptide sequence FESNFNTQATNR. These results are comparable in accuracy to previously reported results from direct infusion as well as ETD averaging across all chromatographic peaks13, 24, indicating that SEC could be used to achieve the co-elution of peptide modification isomers.
Figure 2.

Measured oxidation of two different synthetic peptide isomer sets (a) RPMFAIWK, and (b) FESNFNTQATNR calculated using ETD spectra at various retention times from SEC method. Black trace: MS extracted ion chromatogram (EIC) of the precursor; green trace: MS/MS EIC of unoxidized ETD product ions; red trace: MS/MS EIC of oxidized ETD product ions. Product ions traced for RPMFAIWK and FESNFNTQATNR peptide sets are the c2 ions (specific for oxidation of P2) and the z4 ions (specific for oxidation of A9), respectively. All three traces are thoroughly overlapping for each peptide, indicating coelution of the oxidation isomers.
The robustness of the SEC-ETD approach was also tested. The isomers from each isomer set were mixed in 6 different ratios, and the measured oxidation percentages calculated from single ETD spectra at different retention times are plotted against the theoretical percentage of oxidization in the isomeric mixture (Figure S3). The measured oxidation percentage correlates well to the theoretical values for both of the isomeric peptide sets tested in this experiment calculated using both 2+ and 3+ charge states. These two different isomeric peptide sets were then mixed together with 4 different ratios to test if the developed SEC-ETD method can be used to accurately quantify isomers from multiple analytes mixed together. The measured results compared favorably to the defined ratios of each isomer (with Pearson correlation coefficient of 0.927 for doubly charged states, and 0.928 for triply charged states), indicating that SEC-ETD can be used to accurately and reliably quantify peptide modification isomers, at least for peptide oxidation (Figure S4). A representative ETD spectrum of a mixture of peptide oxidation isomers is shown in Figure S5.
Relative quantification of oxidized peptide isomer mixtures by using RP-ETD method and SEC-ETD method in HRPF application
To test if the developed SEC-ETD method can be used in real applications for quantifying peptide isomer mixtures having multiple modification sites, oxidized lysozyme samples generated from an HRPF experiment were analyzed using both an RP-ETD method using scheduled MS/MS ETD fragmentation across all eluting isomer peaks; and the SEC-ETD method described here using single ETD spectra taken in a standard data-dependent MS/MS approach. The results from these two different methods were then compared with one another to determine if SEC-ETD yields comparable results to current methods.
Five oxidized tryptic peptides from lysozyme provide interpretable ETD spectra for oxidized products under the conditions used for these experiments. 23 residues were found oxidized using RP-ETD method, and 25 oxidized residues for SEC-ETD method. Figure 3 shows the plot between the calculated oxidation amounts at each oxidized residue by using averaged ETD spectra from RP-ETD method and from SEC-ETD method by using single ETD spectra. The plot shows very good correlation between these two methods with a Pearson correlation coefficient of 0.988, which indicates the general SEC-ETD provides relative quantification results comparable to the customized and much more instrument-intensive RP-ETD method.
Figure 3.
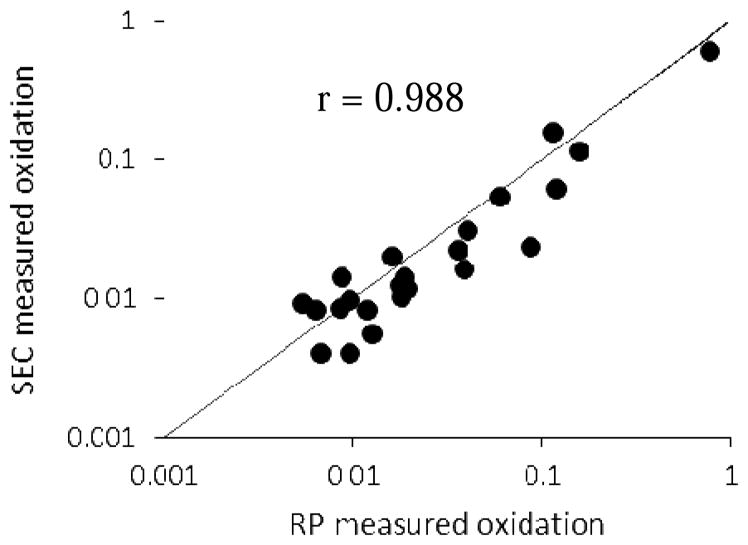
Relationship for lysozyme oxidized by FPOP between calculated oxidation percentages at each amino acid using RP-ETD method with multiple ETD measurements averaged across all oxidation isomer peaks and SEC-ETD using single spectrum data dependent ETD MS/MS measurements for quantification, based on FPOP of lysozyme. The line represents the ideal 1:1 relationship between RP-ETD and SEC-ETD methods, and r is the sample Pearson correlation coefficient. The SEC-based methods gave quantification results highly comparable to RP-based ETD.
The MS/MS scan collected from each method for a specific oxidized product was also compared. For peptide sequence 34–45, an obvious separation of the oxidized product isomers was observed by using RP-ETD method. Forty-one MS/MS scans were used to cover the whole chromatographic peak for this oxidized peptide, whereas, the SEC-ETD method only contains 5 ETD scans collected during data-dependent MS/MS. The five ETD scans gave average fractional oxidation values for each oxidized amino acid found in this peptide with low standard deviations between ETD measurements: 0.023 ± 0.0061 for F34, 0.021 ± 0.0031 for E35, 0.0074 ± 0.0039 for S36, 0.0074 ± 0.0059 for N37, 0.011 ± 0.0038 for F38, 0.016 ± 0.0044 for N39, 0.011 ± 0.0037 for A42, 0.014 ± 0.0015 for T43, and 0.012 ± 0.0022 for N44. Similar results were observed for all analyzed peptides (Table S1). Standard deviations were similar for all amino acids regardless of intensity of the oxidized fragment, consistent with error dominated by spectral noise as previously reported for ETD-based relative quantification13, 31. The deviation from the mean was not observed to vary as a function of elution time. The ability to quantify isomers from a single ETD spectrum using SEC-ETD introduces the possibility of using multiple ETD scans from the same sample to test the measurement precision (Table S1), which requires multiple injections for the current RP-ETD MS/MS method.
Conclusion
In this work, we have demonstrated that SEC coupled with ETD fragmentation provides near ideal co-elution of peptide modification isomers so that relative quantification of peptide modification isomers can be obtained from a single ETD spectrum obtained anywhere within the elution window. Using SEC-ETD, we can now apply a standard data dependent acquisition method to achieve accurate identification and relative quantification of modification isomers for modified peptides and proteins and achieve results of comparable accuracy to the current RP-ETD MS/MS method requiring repeated ETD MS/MS spectra from across the elution times of all isomers. The SEC-ETD method requires substantially fewer MS/MS scans to complete quantification, allowing for more efficient use of instrument time in each run without the need for developing custom MS/MS methods for each sample. The ability to make multiple measurements of modification frequency in a single run makes it possible to statistically measure the precision of your relative quantification from multiple ETD spectra acquired in one run. The improved efficiency and ease of use of SEC coupled to an ETD-based quantification method makes this approach a valuable tool for high-resolution peptide modification mapping, and greatly simplifies both method development and data analysis for relative quantification of small peptide and protein modifications.
Supplementary Material
Acknowledgments
This research is supported by the National Institute of General Medical Sciences (R01 GM096049). LC-MS instrumentation was provided and supported by the National Institute of General Medical Sciences-funded “Research Resource for Integrated Glycotechnology” (P41 GM103390). J.S.S. discloses a significant ownership share of Photochem Technologies, LLC, a small company that is active in the area of hydroxyl radical protein footprinting.
References
- 1.Garcia BA, Shabanowitz J, Hunt DF. Analysis of protein phosphorylation by mass spectrometry. Methods. 2005;35(3):256–64. doi: 10.1016/j.ymeth.2004.08.017. [DOI] [PubMed] [Google Scholar]
- 2.Mann M, Ong SE, Gronborg M, Steen H, Jensen ON, Pandey A. Analysis of protein phosphorylation using mass spectrometry: deciphering the phosphoproteome. Trends Biotechnol. 2002;20(6):261–8. doi: 10.1016/s0167-7799(02)01944-3. [DOI] [PubMed] [Google Scholar]
- 3.Nagel AK, Schilling M, Comte-Walters S, Berkaw MN, Ball LE. Identification of O-linked N-acetylglucosamine (O-GlcNAc)-modified osteoblast proteins by electron transfer dissociation tandem mass spectrometry reveals proteins critical for bone formation. Mol Cell Proteomics. 2013;12(4):945–55. doi: 10.1074/mcp.M112.026633. [DOI] [PMC free article] [PubMed] [Google Scholar]
- 4.Greis KD, Hayes BK, Comer FI, Kirk M, Barnes S, Lowary TL, Hart GW. Selective detection and site-analysis of O-GlcNAc-modified glycopeptides by beta-elimination and tandem electrospray mass spectrometry. Anal Biochem. 1996;234(1):38–49. doi: 10.1006/abio.1996.0047. [DOI] [PubMed] [Google Scholar]
- 5.Mendoza VL, Vachet RW. Protein surface mapping using diethylpyrocarbonate with mass spectrometric detection. Anal Chem. 2008;80(8):2895–904. doi: 10.1021/ac701999b. [DOI] [PMC free article] [PubMed] [Google Scholar]
- 6.Sharp JS, Becker JM, Hettich RL. Protein surface mapping by chemical oxidation: structural analysis by mass spectrometry. Anal Biochem. 2003;313(2):216–25. doi: 10.1016/s0003-2697(02)00612-7. [DOI] [PubMed] [Google Scholar]
- 7.Rappsilber J. The beginning of a beautiful friendship: cross-linking/mass spectrometry and modelling of proteins and multi-protein complexes. J Struct Biol. 2011;173(3):530–40. doi: 10.1016/j.jsb.2010.10.014. [DOI] [PMC free article] [PubMed] [Google Scholar]
- 8.Sinz A. Chemical cross-linking and mass spectrometry for mapping three-dimensional structures of proteins and protein complexes. J Mass Spectrom. 2003;38(12):1225–37. doi: 10.1002/jms.559. [DOI] [PubMed] [Google Scholar]
- 9.Yang H, Zubarev RA. Mass spectrometric analysis of asparagine deamidation and aspartate isomerization in polypeptides. Electrophoresis. 2010;31(11):1764–72. doi: 10.1002/elps.201000027. [DOI] [PMC free article] [PubMed] [Google Scholar]
- 10.Stevenson CL, Williams TD, Anderegg RJ, Borchardt RT. Identification and quantitation of tetrapeptide deamidation products by mass spectrometry. J Pharm Biomed Anal. 1992;10(8):567–75. doi: 10.1016/0731-7085(92)80082-x. [DOI] [PubMed] [Google Scholar]
- 11.Verrastro I, Pasha S, Jensen KT, Pitt AR, Spickett CM. Mass spectrometry-based methods for identifying oxidized proteins in disease: advances and challenges. Biomolecules. 2015;5(2):378–411. doi: 10.3390/biom5020378. [DOI] [PMC free article] [PubMed] [Google Scholar]
- 12.Houde D, Kauppinen P, Mhatre R, Lyubarskaya Y. Determination of protein oxidation by mass spectrometry and method transfer to quality control. J Chromatogr A. 2006;1123(2):189–98. doi: 10.1016/j.chroma.2006.04.046. [DOI] [PubMed] [Google Scholar]
- 13.Marondedze C, Turek I, Parrott B, Thomas L, Jankovic B, Lilley KS, Gehring C. Structural and functional characteristics of cGMP-dependent methionine oxidation in Arabidopsis thaliana proteins. Cell Commun Signal. 2013;11(1):1. doi: 10.1186/1478-811X-11-1. [DOI] [PMC free article] [PubMed] [Google Scholar]
- 14.Shacter E. Quantification and significance of protein oxidation in biological samples. Drug Metab Rev. 2000;32(3–4):307–26. doi: 10.1081/dmr-100102336. [DOI] [PubMed] [Google Scholar]
- 15.Stadtman ER, Berlett BS. Reactive oxygen-mediated protein oxidation in aging and disease. Drug Metab Rev. 1998;30(2):225–43. doi: 10.3109/03602539808996310. [DOI] [PubMed] [Google Scholar]
- 16.Shacter E, Williams JA, Levine RL. Oxidative modification of fibrinogen inhibits thrombin-catalyzed clot formation. Free Radic Biol Med. 1995;18(4):815–21. doi: 10.1016/0891-5849(95)93872-4. [DOI] [PubMed] [Google Scholar]
- 17.Charvatova O, Foley BL, Bern MW, Sharp JS, Orlando R, Woods RJ. Quantifying protein interface footprinting by hydroxyl radical oxidation and molecular dynamics simulation: application to galectin-1. J Am Soc Mass Spectrom. 2008;19(11):1692–705. doi: 10.1016/j.jasms.2008.07.013. [DOI] [PMC free article] [PubMed] [Google Scholar]
- 18.Xu GH, Chance MR. Hydroxyl radical-mediated modification of proteins as probes for structural proteomics. Chem Rev. 2007;107(8):3514–3543. doi: 10.1021/cr0682047. [DOI] [PubMed] [Google Scholar]
- 19.Sharp JS, Becker JM, Hettich RL. Analysis of protein solvent accessible surfaces by photochemical oxidation and mass spectrometry. Anal Chem. 2004;76(3):672–83. doi: 10.1021/ac0302004. [DOI] [PubMed] [Google Scholar]
- 20.Chance MR. Unfolding of apomyoglobin examined by synchrotron footprinting. Biochem Biophys Res Co. 2001;287(3):614–21. doi: 10.1006/bbrc.2001.5628. [DOI] [PubMed] [Google Scholar]
- 21.Li X, Li Z, Xie B, Sharp JS. Improved identification and relative quantification of sites of Peptide and protein oxidation for hydroxyl radical footprinting. J Am Soc Mass Spectrom. 2013;24(11):1767–76. doi: 10.1007/s13361-013-0719-5. [DOI] [PMC free article] [PubMed] [Google Scholar]
- 22.Gau B, Garai K, Frieden C, Gross ML. Mass spectrometry-based protein footprinting characterizes the structures of oligomeric apolipoprotein E2, E3, and E4. Biochemistry. 2011;50(38):8117–26. doi: 10.1021/bi200911c. [DOI] [PMC free article] [PubMed] [Google Scholar]
- 23.Yan Y, Chen G, Wei H, Huang RY, Mo J, Rempel DL, Tymiak AA, Gross ML. Fast photochemical oxidation of proteins (FPOP) maps the epitope of EGFR binding to adnectin. J Am Soc Mass Spectrom. 2014;25(12):2084–92. doi: 10.1007/s13361-014-0993-x. [DOI] [PMC free article] [PubMed] [Google Scholar]
- 24.Li Z, Moniz H, Wang S, Ramiah A, Zhang F, Moremen KW, Linhardt RJ, Sharp JS. High structural resolution hydroxyl radical protein footprinting reveals an extended Robo1-heparin binding interface. J Biol Chem. 2015 doi: 10.1074/jbc.M115.648410. [DOI] [PMC free article] [PubMed] [Google Scholar]
- 25.Aebersold R, Mann M. Mass spectrometry-based proteomics. Nature. 2003;422(6928):198–207. doi: 10.1038/nature01511. [DOI] [PubMed] [Google Scholar]
- 26.Frese CK, Altelaar AF, Hennrich ML, Nolting D, Zeller M, Griep-Raming J, Heck AJ, Mohammed S. Improved peptide identification by targeted fragmentation using CID, HCD and ETD on an LTQ-Orbitrap Velos. J Proteome Res. 2011;10(5):2377–88. doi: 10.1021/pr1011729. [DOI] [PubMed] [Google Scholar]
- 27.Zhao P, Viner R, Teo CF, Boons GJ, Horn D, Wells L. Combining high-energy C-trap dissociation and electron transfer dissociation for protein O-GlcNAc modification site assignment. J Proteome Res. 2011;10(9):4088–104. doi: 10.1021/pr2002726. [DOI] [PMC free article] [PubMed] [Google Scholar]
- 28.Jumper CC, Bomgarden R, Rogers J, Etienne C, Schriemer DC. High-resolution mapping of carbene-based protein footprints. Anal Chem. 2012;84(10):4411–8. doi: 10.1021/ac300120z. [DOI] [PubMed] [Google Scholar]
- 29.Viner RI, Zhang T, Second T, Zabrouskov V. Quantification of post-translationally modified peptides of bovine alpha-crystallin using tandem mass tags and electron transfer dissociation. J Proteomics. 2009;72(5):874–85. doi: 10.1016/j.jprot.2009.02.005. [DOI] [PubMed] [Google Scholar]
- 30.Hambly DM, Gross ML. Laser flash photolysis of hydrogen peroxide to oxidize protein solvent-accessible residues on the microsecond timescale. J Am Soc Mass Spectrom. 2005;16(12):2057–63. doi: 10.1016/j.jasms.2005.09.008. [DOI] [PubMed] [Google Scholar]
- 31.Li X, Li Z, Xie B, Sharp JS. Supercharging by m-NBA Improves ETD-Based Quantification of Hydroxyl Radical Protein Footprinting. J Am Soc Mass Spectrom. 2015;26(8):1424–7. doi: 10.1007/s13361-015-1129-7. [DOI] [PMC free article] [PubMed] [Google Scholar]
Associated Data
This section collects any data citations, data availability statements, or supplementary materials included in this article.