

Abstract
Critical race theory asserts that microaggressions, or low-level, covert acts of aggression, are commonplace in the lives of people of color. These theorists also assert a taxonomy of microaggressions, which includes “microassaults,” “microinsults,” and “microinvalidations.” The theory of microaggressions has been adopted by researchers of LGBTQ communities. This study investigated the three-factor taxonomy as it relates to a diverse sample of LGBTQ youth using the newly developed Sexual Orientation Microaggression Inventory (SOMI). Exploratory factor analysis was used to determine the number of factors that exist in SOMI in a sample of 206 LGBTQ-identifying youth. Follow up confirmatory factor analyses (CFAs) were conducted in order to compare single factor, unrestricted four factor, second order, and bi-factor models in a separate sample of 363 young men who have sex with men. The best fitting model was used to predict victimization, depressive symptoms, and depression diagnosis in order to test validity. The best fitting model was a bi-factor model utilizing 19 of the original 26 items with a general factor and four specific factors representing anti-gay attitudes (“microinsults”), denial of homosexuality, heterosexism (“microinvalidations”), and societal disapproval (“microassaults”). Reliability analyses found that the majority of reliable variance was accounted for by the general factor. The general factor was a significant predictor of victimization and depressive symptoms, as well as unrelated to social desirability, suggesting convergent, criterion-related, and discriminant validity. SOMI emerged as a scale with evidence of validity for assessing exposure to microaggressions in a diverse sample of LGBTQ youth.
Keywords: Microaggression, LGBTQ, Sexual Orientation, Discrimination, Victimization, Internalizing
Introduction
Despite recent advances in legal protection and social acceptance for lesbian, gay, bisexual, transgender, and other non-heterosexual (LGBTQ) individuals, prejudice against sexual minorities persists (Herek & McLemore, 2013). However, while a wide swath of LGBTQ individuals experience acts of violence based on sexual minority status, it may be that more covert acts of aggression toward LGBTQ individuals, which also impact LGBTQ health and wellness, are experienced more frequently than overt acts of violence or harassment (Burn, Kadlec, & Rexer, 2005; Huebner & Davis, 2007; McCabe, Dragowski, & Rubinson, 2013; Nadal et al., 2011). A measure for quantifying acts of covert aggression against LGBTQ individuals, or sexual minority “microaggressions,” would allow researchers to track this type of aggression, and better understand the relationship between these covert acts of aggression and mental health in the LGBTQ community.
The term “microaggression,” popularized by Sue, Bucceri, Lin, Nadal, and Torino (2007), initially emerged as a term for describing acts of subtle racism. Sue et al. described racial microaggressions as “brief and commonplace daily verbal, behavioral, or environmental indignities, whether intentional or unintentional, that communicate hostile, derogatory, or negative racial slights or insults” (p. 72). Rooted in critical race theory, and extended through primarily qualitative research, a taxonomy of microaggressions has been developed. This taxonomy delineates three primary forms of microaggression. The first is the “microassault,” or purposefully discriminatory verbal or non-verbal behavior. Most closely related to “old-fashioned” or “traditional” racism, microassaults could include a law enforcement officer stopping a person of color based solely on that person's perceived racial identity or someone using inappropriate or offensive terms to describe racial groups. The second form of microaggression is termed the “microinsult” and described as a “subtle snub” based on racial identity. For instance, a professor not calling on a student of color after posing a question to the class or a store clerk ignoring a person of color may be instances of a microinsult. Finally, the third act of microaggression is the “microinvalidation,” or engaging in communications that nullify the lived experiences of people of color. For instance, a person of color who talks about an experience of racism with a White friend may be told “Don't be so sensitive,” which has the effect of nullifying that person's reality.
While the microaggression literature originated in critical race theory, this framework has been adopted for the purposes of understanding the experience of sexual minorities and gender variant individuals (Nadal, 2013; Sue, 2010a; 2010b; Sue & Capodilupo, 2007; Sue et al., 2007). The literature on sexual orientation microaggressions typically follows the same general taxonomy as the racial microaggression literature (Nadal, Rivera, & Corpus, 2010; Sue, 2010a). For instance, hearing a friend use the term “that's so gay” in a derogatory way could be construed as a sexual orientation microassault, while being exposed to media that solely portrays heterosexual couples in traditional gender roles could be considered a microinsult. Inferences made about a person's general interests (i.e., hobbies or sports) as a result of their gender expression might be considered a microinvalidation (Nadal et al., 2010).
A key feature of microaggressions, and particularly microinvalidations, is that they are frequently non-deliberate and unconscious on the part of the actor. Whatever the intentions of the actor, however, these subtle forms of discrimination can seriously impact the mental and physical well being of the individuals who experience the discrimination or invalidation. A recent meta-analysis, for instance, examined the effect of perceived discrimination on measures of physical and mental health (Pascoe & Smart Richman, 2009). This study found that perceived discrimination across a variety of identity categories (e.g., race, gender, sexual orientation) was related to symptoms of psychopathology and emotional distress, as well as markers of poor physical health. Moreover, a recent study by Robinson (2014) measured more covert forms of microaggression (rather than overt discrimination) and found a robust relationship between sexual orientation microaggressions and symptoms of posttraumatic stress disorder. Finally, a recent LGB-specific study found that simple exposure to the phrase “That's so gay” used in a derogatory fashion increased feelings of isolation in LGB college students (Woodford, Howell, Silverschanz, & Yu, 2012). Students who reported hearing this term more frequently also reported more frequent headaches and reduced appetite.
In addition to impacting global indicators of physical and mental health, microaggressions appear to specifically contribute to depressive symptoms. For instance, a study of Black undergraduate women asked participants about perceived racial microaggressions and macroaggressions (e.g., victimization, such as blatantly racist acts such as being called a racist name), and found that both were linked to symptoms of depression (Donovan, Galban, Grace, Bennett, & Felicie, 2013). Further, while not working from a framework of microaggressions, a study of perceived discrimination by LGBTQ high-school students indicated that perceived discrimination contributed to depression and self-harm in this population (Almeida, Johnson, Corliss, Molnar, & Azrael, 2009). While perceived discrimination against LGBTQ individuals has been measured in a variety of ways, we are not aware of any measure that assesses more covert forms of discrimination (i.e., microaggressions) that has been developed specifically for use with racially and socioeconomically diverse samples of LGBTQ youth. While there is one scale that aims to assess microaggressions in the LGBTQ community (Wright & Wegner, 2012), this scale was normed using primarily White adults (mean age of 27 years), with a median income of $60,000. These individuals may have very different experiences with microaggressions, and very different resources for dealing with microaggressions, than LGBTQ youth with multiple minority status. In fact, several key items in this scale are likely not applicable to the microaggression experiences of many racially diverse LGBTQ youth because they may be differentially experienced by socioeconomic groups (e.g., “How often have people assumed you knew a lot about stereotypical LGB interests, like wine?”) or racial/ethnic groups (e.g., “How often have people avoided proximity, like crossing the street to walk or waiting for the next elevator?”; which is just as likely to tap into experiences of racial microaggressions as it is LGBTQ-based microaggression experiences for people who also identify as ethnic or racial minorities).
A scale that measures combined minority stress in LGBTQ people of color, the LGBT People of Color Microaggressions Scale, was recently developed and validated in a large sample of middle-class (mean income $60-79,000) adults (mean age of 33 years) of color (Balsam, Molina, Beadnell, Simoni, & Walters, 2011). This measure has a three-factor structure, which includes LGBT Racism, POC Heterosexism, and LGBT Relationship Racism. While this scale is an important measure of additive (or, indeed, multiplicative) forms of minority stress, developing and constructing a data-driven measure for capturing LGBTQ microaggressions alone, but that is valid for use in economically, racially, and ethnically diverse populations, may prove extremely important. Microaggressions based on an LGBTQ identity may stand in contrast to microaggressions based on a racial or ethnic identity. For example, the same teen may be assumed to be a violent criminal because he is Black or assumed to be effeminate and incapable of violence because he is gay. Additionally, while the experience of racism and the experience of heterosexism are both functions of systemic oppression, these experiences are not the same. There may be forms of microaggression that are unique to the LGBTQ community, just as there may be forms of microaggression that are unique to heterosexual Asian American men or lesbian Latinas.
Current Study
The aim of the present study was to develop a quantitative tool for measuring LGBTQ-specific microaggressions that would allow researchers to delineate the factor structure of microaggressions in LGBTQ communities and better understand the health risk associated with each type of LGBTQ-specific microaggression. We intend to identify the best fitting factor structure for an LGBTQ microaggression inventory with items based on the work of Nadal et al. (2010) and Sue et al. (2007), as well as explore the possibility of a higher-order factor structure encapsulating overall microaggression experiences. Reliability and validity were tested using measures of social desirability, as well as concurrent and longitudinal measures of victimization and internalizing. We also took a quantitative approach that allowed for the potential for identifying factors that were unique to the LGBTQ community and were not present in Sue et al.'s racially-based three factor taxonomy. Finally, we utilized the microaggression measure to explore the relationship between covert acts of aggression and overt acts of victimization based on LGBTQ identity, and tested the unique contributions of LGBTQ microaggressions to internalizing symptoms.
Method
We utilized data from two samples to conduct the present analyses. Project Q2 is a longitudinal community-based sample of 248 youths recruited in the Chicago area between the ages of 16 to 20 years at baseline. Recruitment and inclusion criteria have been detailed in previous publications (Mustanski, Garofalo, & Emerson, 2010). Data for the current study were taken from Time 7 (at 42 month follow up, N = 204) and Time 8 (at 48 month follow up, N = 206). Crew 450 is a longitudinal sample of 450 gay, bisexual, and questioning men between the ages of 16 and 20 years that, like Project Q2, is community-based and recruited from the Chicago area (details of recruitment and inclusion can be found in Kuhns et al. (2015). The current study used data taken from Time 3 (at 12 month follow up, N = 363) and Time 4 (at 18 month follow up, N = 340).
Participants
Project Q2
Of participants included in Time 7, 44.1% (N = 90) reported their birth sex as male. The racial breakdown for the sample was primarily Black (57.8%), with 13.2% reporting their ethnicity as White, 11.8% multiracial, 10.8% Hispanic or Latino/a, 1.5% Asian or Pacific Islander, 1.0% Native American, and 3.9% reporting “other.” In terms of self-identified sexual orientation, of participants born female, 55.3% reported their orientation as “gay” or “lesbian,” 35.1% as “bisexual,” 2.6% as “heterosexual,” and 2.6% as “questioning/unsure,” of participants born male, 68.9% identified as “gay,” 15.6% as “bisexual,” 5.6% as “heterosexual,” and 4.4% as “questioning/unsure.”
Crew 450
Participants in Crew 450 were born and identified as male as a requirement of the study. The sample was primarily Black (53.3%), followed by 20.0% Hispanic/Latino, 18.0% White, 5.3% “other,” 1.8% Asian, and 1.6% Native American. Among participants, 62.2% identified as “only gay,” 17.1% “mostly gay,” 14.6% “bisexual,” 1.1% “mostly heterosexual,” 0.3% as “only heterosexual,” and 4.7% as “other.”
Measures
Sexual Orientation Microaggressions
The Sexual Orientation Microaggression Inventory (SOMI) consists of 26 investigator-created items developed based on themes detailed by Nadal et al. (2010). It was administered at Time 7 in the Q2 sample and Time 3 in the Crew 450 sample. The themes incorporated into the microaggression scale were: heterosexist terminology, endorsement of heteronormative behaviors, assumption of universal LGBT experience, discomfort/disapproval of LGBTQ experiences, denial of societal heterosexism, assumption of abnormality, denial of individual heterosexism, and environmental macroaggressions. Each item was administered using a 5-point scale with options ranging from “not at all” to “about every day.”
Social Desirability
The nine-item short form of the Marlowe-Crowne Social Desirability Scale was administered at Time 7 in the Project Q2 sample (Crowne & Marlowe, 1960). Items on the scale all had “yes” or “no” response options. One item, “I am always good,” was dropped from the scale because Cronbach's alpha was higher without it. The remaining eight items were used to form a mean composite (α = .79).
Victimization
LGBT victimization was measured at Times 7 and 8 in the Project Q2 sample using a 10-item composite first used by D'Augelli, Hershberger, and Pilkington (1998). Items of overt victimization ranged from less severe (e.g., “Have you been verbally insulted (yelled at, criticized), because you are, or were thought to be gay, lesbian, bisexual, or transgender?”) to more extreme victimization (e.g., “Have you been threatened with a knife, gun, or another weapon because you are, or were thought to be gay, lesbian, bisexual, or transgender?”). Items were measured on a 4-point scale ranging from “Never (0)” to “Three times or more (3).”
In the Crew 450 sample at Times 3 and 4, LGBT victimization was measured using a 24-item composite of victimization experienced in the previous 6 months adapted from Ramirez-Valles, Kuhns, Campbell, and Diaz (2010) and Kuhns, Vazquez, and Ramirez-Valles (2008). Items ranged from less severe (e.g., “How often have you been made fun of or called names [faggot, queer, sissy, etc.] by your own family, because of the way you behaved?”) to more extreme victimization (e.g., “How often did someone threaten or injure you with a weapon because of your sexual orientation?”). Items were measured on a 4-point scale ranging from “Never (0)” to “Many times (3).”
Internalizing mental health problems
Self-reported depressive symptoms at Time 7 and Time 8 in Project Q2 were measured using six items on the 18-item version of the Brief Symptom Inventory (BSI). The Depression scale on the BSI was computed by taking an average of the six items that ranged from 0 to 4 with higher scores indicated greater depression symptoms. Additionally, the Diagnostic Interview Schedule (DIS) was used at Q2 Time 8 to assess diagnosis of depression based on the Diagnostic and Statistical Manual of Mental Disorders, Fourth Edition (DSM-IV) criteria (Robins et al., 2002). The DIS is a computerized, structured interview developed for use by trained lay interviewers. Diagnoses were for the previous 12-month period. Interviewers had advanced education in psychology and experience with the target population, and we conducted ongoing supervision by a licensed clinical psychologist to ensure fidelity. In Crew 450, internalizing symptoms were measured at Time 3 and Time 4 using the 36 item Internalizing subscale of the Achenbach System of Empirically Based Assessment Adult Self-Report (ASR) (Achenbach, 2009). The internalizing scale on the ASR was computed by taking a sum of all items to create a range between 0 to 36. Higher scores indicate greater internalizing symptoms.
Statistical Analyses
Exploratory factor analysis (EFA) was used to determine the factors that exist in the SOMI using the Project Q2 sample. The ideal number of factors was confirmed using parallel analysis, specifically using the SPSS macro developed by O'Connor (2000). Parallel analysis is not readily available in SPSS, but O'Connor's macro makes this analysis, considered superior to a scree plot or the K1 rule, straightforward. In parallel analysis, raw eigenvalues were calculated from the existing data and compared to eigenvalues calculated from a sample of randomly generated data of equivalent size. Factors were retained as long as the eigenvalue from the real data was greater than the corresponding eigenvalue from the random data. All 204 participants who participated at Time 7 fully completed the SOMI so missingness was not a concern.
Confirmatory factor analyses (CFAs) were conducted in MPlus using the Crew 450 sample in order to find the best fitting model consistent with Reise, Moore, and Haviland's (2010) methods for exploring multidimensional data. Single factor, unrestricted four-factor, second order factor, and bi-factor models were fit to the data and chi-square goodness-of-fit, CFI, RMSEA, and SRMR were used to determine the best fitting model. The single factor model assumes that the SOMI is unidimensional, the unrestricted four-factor assumes that there are four separate but correlated dimensions, the second order factor also includes four dimensions but assumes that those dimensions make up a single higher-order factor, and the bi-factor model assumes that there are four distinct dimensions that exist alongside a general factor that every item loads onto. The key difference between the second order and bi-factor models is the association between the specific factors and the general factor. In the second order model, the higher-order general factor is assumed to account for the associations between the lower-order specific factors. In the bi-factor model, the specific factors are hypothesized to account for additional variance over and above the common variance accounted for by the general factor.
We attempted to measure a single construct (microaggression experiences) that theoretically had a number of different aspects that we also attempted to capture with our measure. Because we had reason to believe from a theoretical perspective that there is a higher-order structure capturing overall microaggression experiences, it was necessary to fit the two common higher-order models (the second-order factor and bi-factor models) (Chen, West, & Sousa, 2006). The best fitting model was then used to predict victimization, BSI depression symptoms, and C-DIS depression diagnosis in the Q2 sample, and victimization and ASR internalizing symptoms in the Crew 450 sample.
Results
Exploratory Factor Analysis (EFA)
In the EFA, we aimed to determine the number of factors in the SOMI for LGBTQ youth. The EFA of the 26-item SOMI scale in the Project Q2 sample supported a four factor solution (see Tables 1 and 2). Results from the parallel analysis found that the first four eigenvalues were greater than the randomly generated eigenvalues at the 95th percentile which indicated that we should keep the first four factors. The first factor encompassed seven items that captured anti-gay attitudes and expressions (e.g., “You heard someone say ‘that's so gay’ in a negative way”), the second was best described as denial of homosexuality (e.g., “You were told that being gay is just a phase”), the third captured heterosexism (e.g., “A heterosexual person didn't believe that gay, lesbian, and bisexual people face discrimination”), and the last factor encompassed societal disapproval items (e.g., “Someone said gay, lesbian, and bisexual people are trying to get ‘special rights’ that they don't deserve.”). Five items were found to crossload (have pattern coefficients on multiple scales within .10 of each other) on multiple scales: “You heard that people of your ethnicity aren't gay or bisexual,” “You heard about people trying to deny rights for same-sex couples,” “Someone assumed you have HIV because of your sexual orientation,” “Someone assumed you must be depressed because of your sexual orientation,” and “Someone implied that only heterosexuality is normal.” Item 13 (“A heterosexual person seemed uncomfortable because they thought you were attracted to them”) had coefficients above .40 on multiple factors. These six items were dropped in subsequent CFA models in order to prevent “contamination” of the factors.
Table 1. Parallel Analysis Results.
| Root | Raw Eigenvalue | 95th Percentile Eigenvalue* |
|---|---|---|
| 1 | 12.01 | 1.02 |
| 2 | 1.36 | 0.85 |
| 3 | 0.82 | 0.73 |
| 4 | 0.70 | 0.65 |
| 5 | 0.49 | 0.58 |
Eigenvalues estimated from 100 randomly generated datasets
Table 2. Descriptive Statistics and Exploratory Factor Analysis Results.
| SOMI Items | M (SD) | Pattern Coefficients | |||
|---|---|---|---|---|---|
|
| |||||
| Factor 1 | Factor 2 | Factor 3 | Factor 4 | ||
| MAG01. You heard someone say “that's so gay” in a negative way? | 2.41 (1.27) | 0.49 | -0.12 | 0.17 | 0.08 |
| MAG02. You were told, “you're not really gay.” | 1.93 (1.19) | 0.41 | 0.17 | 0.01 | -0.06 |
| MAG03. You were told you're not a “real” man/woman. | 1.52 (.99) | 0.27 | 0.15 | 0.49 | -0.11 |
| MAG04. You were told not to “act so gay.” | 1.59 (1.01) | 0.42 | 0.21 | 0.21 | -0.11 |
| MAG05. You were told you just haven't found the right person of the opposite sex. | 1.93 (1.24) | 0.17 | 0.53 | 0.03 | 0.09 |
| MAG06. You heard that people of your ethnicity aren't gay or bisexual | 1.36 (.90) | 0.04 | 0.40 | 0.48 | -0.01 |
| MAG07. You were told that being gay is just a phase. | 1.92 (1.18) | 0.00 | 0.69 | -0.01 | 0.23 |
| MAG08. Someone said, “you are not like those gay people.” | 1.82 (1.18) | 0.59 | 0.22 | 0.09 | -0.03 |
| MAG09. Someone said, “you know how gay people are.” | 2.01 (1.24) | 0.65 | 0.17 | 0.02 | 0.07 |
| MAG10. Someone expressed a stereotype (example: “gay men are so good at fashion”) | 2.44 (1.35) | 0.77 | 0.03 | -0.05 | 0.10 |
| MAG11. You heard someone talk about “the gay lifestyle.” | 2.44 (1.29) | 0.51 | 0.20 | -0.06 | 0.24 |
| MAG12. You heard about people trying to deny rights for same-sex couples (example: “Proposition 8” in California). | 2.33 (1.25) | 0.37 | -0.05 | -0.01 | 0.37 |
| MAG13. A heterosexual person seemed uncomfortable because they thought you were attracted to them. | 1.79 (1.20) | 0.40 | -0.05 | 0.51 | 0.08 |
| MAG14. You saw a group either in person or in the media show negative signs (example: A religious group with a sign that said “God hates fags”) | 1.96 (1.19) | 0.26 | -0.05 | 0.18 | 0.41 |
| MAG15. Someone said gay, lesbian, and bisexual people are trying to get “special rights” that they don't deserve. | 1.71 (1.06) | -0.09 | 0.21 | 0.24 | 0.52 |
| MAG16. Someone said, “I don't mind gay people, they just shouldn't be so public.” | 1.91 (1.18) | 0.11 | 0.22 | 0.22 | 0.47 |
| MAG17. Someone said a hateful slur about gay, lesbian, and bisexual people (example: “fag” or “dyke” said in a mean way). | 2.17 (1.26) | 0.14 | 0.26 | -0.04 | 0.60 |
| MAG18. A family member expressed disappointment about you being gay, lesbian, or bisexual. | 1.62 (1.02) | 0.14 | 0.55 | 0.11 | 0.12 |
| MAG19. Someone said homosexuality is a sin or immoral. | 2.26 (1.32) | 0.05 | -0.03 | 0.07 | 0.79 |
| MAG20. A heterosexual person said you are being “paranoid” when you suspect someone treated you in a homophobic way. | 1.50 (.97) | 0.14 | -0.06 | 0.83 | 0.02 |
| MAG21. A heterosexual person didn't believe that gay, lesbian, and bisexual people face discrimination. | 1.57 (1.02) | -0.08 | 0.06 | 0.55 | 0.29 |
| MAG22. You were told you were overreacting when you talked about a negative experience you had because of your sexual orientation. | 1.50 (.91) | 0.08 | 0.00 | 0.74 | 0.06 |
| MAG23. A heterosexual denied they have any heterosexism (example: “As a person of color, I'm offended that you would imply I could be homophobic”) | 1.43 (.90) | -0.07 | 0.21 | 0.73 | 0.02 |
| MAG24. Someone assumed you have HIV because of your sexual orientation. | 1.40 (.93) | -0.04 | 0.38 | 0.42 | -0.01 |
| MAG25. Someone assumed you must be depressed because of your sexual orientation. | 1.49 (1.04) | 0.04 | 0.42 | 0.49 | 0.01 |
| MAG26. Someone implied that only heterosexuality is normal (example: “Did you go to a gay bar or a normal bar?”) | 1.78 (1.17) | 0.30 | 0.18 | 0.18 | 0.23 |
Confirmatory Factor Analysis (CFA) Models and Reliability
In the CFA, we set out to confirm the 4-factor solution and determine the best-fitting model (i.e, single-factor, correlated four-factor, second-order factor, or bi-factor model). While results from the EFA supported the presence of four meaningful factors, the large size of the first factor suggests that there may be a higher-order structure (Embretson & Reise, 2000). Fitting a bi-factor model is especially important for this particular EFA pattern. Of the four models, the best fit with the Crew 450 sample was the bi-factor model, χ2(145) = 348.02, p < .001. Fit statistics for the bi-factor model suggested an overall good fit for the data (CFI = .95, RMSEA = .06, and SRMR = .05) (see Fig. 1 for factor coefficients). Item 2 (“You were told, ‘You're not really gay’”) was dropped in order to improve model fit. Pattern coefficients in the bi-factor model were all significant with the exceptions of items 3 (“You were told you're not a ‘real man’”) and 4 (“You were told not to ‘act so gay’”) which were not significant on the anti-gay attitudes and heterosexim factor, respectively, but were significant on the general factor. The best fitting model was then fit to the Q2 sample with similar results, χ2(150) = 261.90, p < .001, CFI = .95, RMSEA = .05, and SRMR = .04 (see Fig. 2 for factor coefficients).
Figure 1. SOMI Bi-Factor Model with Crew 450 Sample.
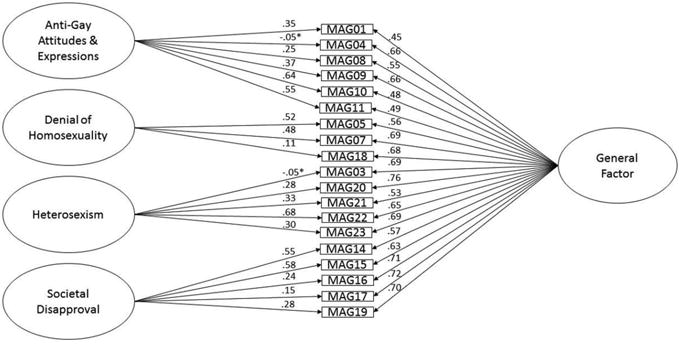
*Coefficients not significant at p < .05. All coefficients are standardized.
Figure 2. SOMI Bi-Factor Model with Project Q2 Sample.
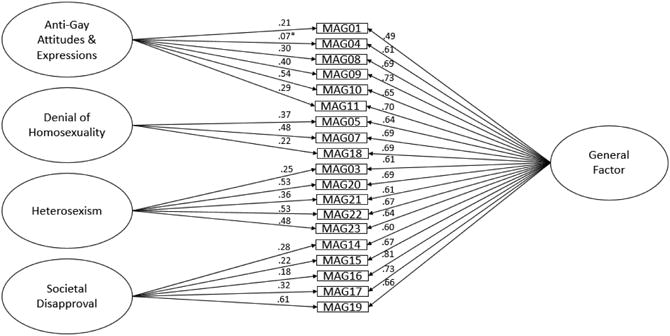
*Coefficients not significant at p < .05. All coefficients are standardized.
Model-based reliability analyses were conducted with the Crew 450 sample for the general factor and the four specific factors present in the bi-factor model by calculating a ratio using the omega and omega hierarchical indexes (Gignac, 2014; Reise, Bonifay, & Haviland, 2013). The general factor was highly reliable, representing 92.55% of the reliable variance in the 19-item scale. The specific factors, however, were much less reliable, representing only between 10-15% of the reliable variance within their respective scales. This indicates that the general factor, controlling for the unique qualities of the specific factors, and not the specific factors themselves, was the single reliable measure of experiences with microaggressions. As such, the validity of the SOMI will only be evaluated in terms of the general factor.
Discriminant Validity
In term of discriminant validity, the correlation between the general microaggression factor and social desirability was not significant (r = .11). This suggests that social desirability did not impact how participants responded to the SOMI.
Convergent Validity
Results for the bi-factor model predicting victimization are shown in Table 3. The general factor significantly predicted victimization concurrently and six months later for the Crew 450 and Q2 participants. For both samples, as the general microaggression factor increased, victimization also increased.
Table 3. Linear Regression of SOMI General Factor on Victimization and Internalizing.
| Crew 450 | Q2 | |||||
|---|---|---|---|---|---|---|
|
|
|
|||||
| General Factor | General Factor | |||||
|
| ||||||
| Standardized Beta | SE | p-value | Standardized Beta | SE | p-value | |
| Victimization (concurrent) | 0.65 | 0.04 | <.001 | 0.73 | 0.08 | <.001 |
| Victimization (6 months later) | 0.53 | 0.05 | <.001 | 0.36 | 0.08 | <.001 |
| Internalizing (concurrent) | 0.25 | 0.06 | <.001 | 0.38 | 0.07 | <.001 |
| Internalizing (6 months later) | 0.21 | 0.06 | <.001 | 0.36 | 0.08 | <.001 |
| MDD Diagnosis (6 months later) | - | - | - | 0.12 | 0.12 | ns |
MDD Major Depressive Disorder. All analyses were univariate
Criterion-Related Validity
Associations between the bi-factor model and ASR internalizing symptoms for Crew 450 and BSI and C-DIS depression for Project Q2 are shown in Table 3. For both Crew 450 and Project Q2 samples, the general microaggression factor was associated with internalizing symptoms concurrently and six months later, such that higher scores on the general factor were associated with more internalizing symptoms. There were no significant associations between the general factor and C-DIS depression diagnosis in the Q2 sample.
Incremental Validity
In order to assess whether SOMI had predictive value over existing measures of related constructs, we controlled for victimization in our models of the SOMI bi-factor model predicting internalizing symptoms and depression (see Table 4). In the Crew 450 sample, victimization was a significant predictor both concurrently and six months later such that as victimization increased, internalizing symptoms increased. Increases in the general factor were still associated with higher internalizing symptoms concurrently, but this association was no longer significant six months later when controlling for victimization.
Table 4. Multivariate Linear Regression of SOMI General Factor on Internalizing Controlling for Victimization.
| Crew 450 | Q2 | |||||
|---|---|---|---|---|---|---|
|
|
|
|||||
| ASR Internalizing (Concurrent) | BSI Depression (Concurrent) | |||||
|
| ||||||
| Standardized Beta | SE | p-value | Standardized Beta | SE | p-value | |
| Victimization | 0.15 | 0.06 | <.05 | 0.03 | 0.08 | ns |
| General Factor | 0.15 | 0.07 | <.05 | 0.29 | 0.08 | <.001 |
|
| ||||||
| ASR Internalizing (6 months later) | BSI Depression (6 months later) | |||||
|
| ||||||
| Victimization | 0.19 | 0.07 | <.01 | 0.17 | 0.08 | <.05 |
| General Factor | 0.09 | 0.07 | ns | 0.24 | 0.09 | <.01 |
|
| ||||||
| C-DIS Depression (6 months later) | ||||||
|
| ||||||
| Victimization | - | - | - | 0.35 | 0.09 | <.001 |
| General Factor | - | - | - | -0.08 | 0.12 | ns |
In the Q2 sample, victimization was not a significant predictor of BSI depression symptoms concurrently, but it was associated with BSI symptoms and C-DIS diagnosis six months later, such that as victimization increased, depression symptoms and odds of diagnosis also increased. Even after controlling for victimization, the general factor was positively associated with BSI depressive symptoms both concurrently and six months later. However, the SOMI general factor was still not a significant predictor of C-DIS depression diagnosis after controlling for victimization.
Discussion
This study developed and refined a brief measure for quantifying microaggressions in a diverse community sample of LGBTQ youth and emerging adults. This study was also the first to provide a data-driven taxonomy of the microaggressions experienced by LGBTQ youth, and provided evidence for convergent, criterion-related, and discriminant validity by relating microaggressions to LGBTQ victimization, internalizing mental health problems, and social desirability. The initial EFA results for the Q2 participants supported a four-factor model similar to the three-factor taxonomy developed by Sue et al. (2007). The model included three factors analogous to Sue et al.'s “microassaults” (societal disapproval), “microinsults” (anti-gay attitudes), and “microinvalidations” (heterosexism), along with a new fourth factor unique to LGBTQ youth that we termed “denial of homosexuality.” However, subsequent CFA models with the Crew 450 participants, and confirmed with the Q2 sample, supported a bi-factor model with a general factor and four specific factors that corresponded to the four factors supported in the initial EFA. Reliability analyses found that the general factor represented a majority of the reliable variance within the 19-item scale and that the four specific factors on their own did not represent enough reliable variance to be useful as independent measures of microaggression experiences. The implication was that as much as the existence of Sue et al.'s taxonomy in LGBTQ youth was supported in our findings, the overall effect of experiencing microaggressions was more important than the unique features of Sue's microaggression factors.
Inherent with the bi-factor model was the challenge of interpreting the specific factors in relation to the general factor (Rindskopf & Rose, 1988). In the case of this study, because the specific factors did not represent significant reliable variance, the interpretation of the general factor was the most important consideration for how the SOMI should be applied in future work. The general factor was a superior measure of the common variance across all items compared to a unidimensional model because within the bi-factor model the characteristics unique to the specific factors are controlled for (Holzinger & Swineford, 1937; Reise et al., 2010; Schmid & Leiman, 1957). In other words, one is controlling for the multidimensionality of the data in the estimates of a general factor that is, practically-speaking, a unidimensional factor (Reise et al., 2010). Previous research with bi-factor models suggests that for cases like the SOMI where the specific factors account for only a modest proportion of the reliable variance, it may be acceptable to estimate a single-factor model and treat the measure as unidimensional (Reise et al., 2013). Reise et al. found that despite the poorer fit from fit indices for the single-factor model, if the bias in the pattern coefficients between the single-factor model and the general factor from the bi-factor model fall below 10%, the single-factor model can be used with minimal loss in accuracy. This is especially important for researchers who seek to adapt the SOMI for studies with smaller sample sizes that may not have the power to accurately estimate the bi-factor solution.
The general factor of sexual orientation microaggressions was associated with victimization concurrently and six months later in both the Project Q2 and Crew 450 samples. This was the clearest evidence that the SOMI had convergent validity through the association between microaggressions and the similar but more overt experience of victimization. The general microaggression factor was also associated with concurrent and future depressive/internalizing symptoms in both samples, which supported criterion-related validity for the SOMI. This provided confirmatory evidence that minority stress, as operationalized by exposure to microaggressions based on sexual orientation, contributed to psychopathology in the LGBTQ community. In other words, microaggressions based on sexual minority status may not seem as potentially damaging as more overt victimization, such as being called a derogatory name or being physically bullied, but they can have a profound impact on the mental health of LGBTQ youth.
This impact was further supported by the fact that the general factor was still a significant predictor of internalizing mental health problems after controlling for victimization (i.e., incremental validity). The association between the general microaggression factor and symptoms of depression and internalizing symptoms remained significant, except that the general factor no longer predicted internalizing symptoms six months later in the Crew 450 sample after controlling for victimization. This provided strong evidence that microaggressions were important even beyond the effects of overt victimization.
This study had a number of limitations. For instance, these findings were data-driven rather than stemming from an a priori theoretical orientation. The diversity of our sample, while a strength in many respects, was also a limitation in that the current study does not address the cross-section between LGBTQ and racial microaggressions. The work by Balsam et al. (2011) may capture data related to intersectional identity more robustly, and future directions for this research should address this question directly through the inclusion of additional items related explicitly to intersectionality. Future research should address both types of microaggressions in tandem in order to better understand the discrimination faced by people with multiple minority statuses. The present study was also limited by the size of the sample used for exploratory factor analysis, but this was somewhat mollified by confirmation of the model fit with our second sample. Future studies should confirm the factor structure supported here with a larger sample and confirm that the loss in accuracy in coefficient estimates from substituting the single-factor model in place of the bi-factor is small. Future research should also explore contextual factors that may potentially interact with the effects of microaggressions, such as the persons expressing the microaggressions and the environments in which they are experienced.
In sum, SOMI emerged as a brief scale with evidence of validity for measuring exposure to microaggressions. It is the only measure in the LGBTQ microaggressions literature to be developed specifically for racially diverse LGBTQ youth that accounts for racial, socioeconomic and developmental diversity. Exploratory and confirmatory analyses found evidence to support previous conceptions of the microaggression taxonomy. However, the best fit for the data was a bi-factor model, and the reliable variance within that model was primarily accounted for by the general factor, not the specific factors. Future applications of the SOMI should model the 19-item bi-factor when possible but incorporate only the general factor in analyses as the single reliable measure of microaggression experiences. In situations where the bi-factor cannot be effectively modeled, researchers should take a unidimensional approach to the SOMI and model the single factor. Further research is necessary to fully understand the associations between sexual orientation microaggressions and psychopathology in LGBTQ populations. However, the detrimental effect of microaggressions has been validated by critical race theory, and through quantitative and qualitative studies of microaggressions and pathology. It is time to start using validated tools, such as the SOMI, to more accurately document the damaging effects of microaggressions and to use these findings to develop interventions that have the capacity to protect LGBTQ individuals against negative health outcomes.
Acknowledgments
This research was supported by grants from the National Institute of Mental Health (R21MH095413; PI: Mustanski) and the National Institute on Drug Abuse (R01DA025548; PIs: Garofalo & Mustanski). The content is solely the responsibility of the authors and does not necessarily represent the official views of the funding agencies.
References
- Achenbach TM. The Achenbach System of Empirically Based Assessment (ASEBA): Development, Findings, Theory, and Applications. Burlington, VT: University of Vermont Research Center for Children, Youth and Families; 2009. [Google Scholar]
- Almeida J, Johnson RM, Corliss HL, Molnar BE, Azrael D. Emotional distress among LGBT youth: The influence of perceived discrimination based on sexual orientation. Journal of Youth and Adolescence. 2009;38:1001–1014. doi: 10.1007/s10964-009-9397-9. [DOI] [PMC free article] [PubMed] [Google Scholar]
- Balsam KF, Molina Y, Beadnell B, Simoni J, Walters K. Measuring multiple minority stress: The LGBT People of Color Microaggressions Scale. Cultural Diversity and Ethnic Minority Psychology. 2011;17:163–174. doi: 10.1037/a0023244. [DOI] [PMC free article] [PubMed] [Google Scholar]
- Burn SM, Kadlec K, Rexer R. Effects of subtle heterosexism on gays, lesbians, and bisexuals. Journal of Homosexuality. 2005;49:23–38. doi: 10.1300/J082v49n02_02. [DOI] [PubMed] [Google Scholar]
- Chen FF, West SG, Sousa KH. A comparison of bifactor and second-order models of quality of life. Multivariate Behavioral Research. 2006;41:189–225. doi: 10.1207/s15327906mbr4102_5. [DOI] [PubMed] [Google Scholar]
- Crowne DP, Marlowe D. A new scale of social desirability independent of psychopathology. Journal of Counseling Psychology. 1960;47:155–164. doi: 10.1037/h0047358. [DOI] [PubMed] [Google Scholar]
- D'Augelli AR, Hershberger SL, Pilkington NW. Lesbian, gay, and bisexual youth and their families: Disclosure of sexual orientation and its consequences. American Journal of Orthopsychiatry. 1998;68:361–371. doi: 10.1037/h0080345. [DOI] [PubMed] [Google Scholar]
- Donovan RA, Galban DJ, Grace RK, Bennett JK, Felicie SZ. Impact of racial macro-and microaggressions in Black women's lives: A preliminary analysis. Journal of Black Psychology. 2013;39:185–196. doi: 10.1177/0095798412443259. [DOI] [Google Scholar]
- Embretson SE, Reise SP. Item response theory for psychologists. Mahwah, NJ: Lawrence Erlbaum Associates Publishers; 2000. [Google Scholar]
- Gignac GE. On the inappropriateness of using items to calculate total scale score reliability via coefficient alpha for multidimensional scales. European Journal of Psychological Assessment. 2014;30:130–139. doi: 10.1027/1015-5759/a000181. [DOI] [Google Scholar]
- Herek GM, McLemore KA. Sexual prejudice. Annual Review of Psychology. 2013;64:309–333. doi: 10.1146/annurev-psych-113011-143826. [DOI] [PubMed] [Google Scholar]
- Holzinger KJ, Swineford F. The bi-factor method. Psychometrika. 1937;2:41–54. [Google Scholar]
- Huebner DM, Davis MC. Perceived antigay discrimination and physical health outcomes. Health Psychology. 2007;26:627–634. doi: 10.1037/0278-6133.26.5.627. [DOI] [PubMed] [Google Scholar]
- Kuhns LM, Kwon S, Ryan DT, Garofalo R, Phillips G, Mustanski BS. Evaluation of respondent-driven sampling in a study of urban young men who have sex with men. Journal of Urban Health. 2015;92:151–167. doi: 10.1007/s11524-014-9897-0. [DOI] [PMC free article] [PubMed] [Google Scholar]
- Kuhns LM, Vazquez R, Ramirez-Valles J. Researching special populations: retention of Latino gay and bisexual men and transgender persons in longitudinal health research. Health Education Research. 2008;23:814–825. doi: 10.1093/her/cym066. [DOI] [PMC free article] [PubMed] [Google Scholar]
- McCabe PC, Dragowski EA, Rubinson F. What is homophobic bias anyway? Defining and recognizing microaggressions and harassment of LGBTQ youth. Journal of School Violence. 2013;12:7–26. doi: 10.1080/15388220.2012.731664. [DOI] [Google Scholar]
- Mustanski BS, Garofalo R, Emerson EM. Mental health disorders, psychological distress, and suicidality in a diverse sample of lesbian, gay, bisexual, and transgender youths. American Journal of Public Health. 2010;100:2426–2432. doi: 10.2105/AJPH.2009.178319. doi:AJPH.2009.178319[pii]10.2105/AJPH.2009.178319. [DOI] [PMC free article] [PubMed] [Google Scholar]
- Nadal KL. Gender identity microaggressions: Experiences of transgender and gender nonconforming people. In: Nadal KL, editor. That's so gay! Microaggressions and the lesbian, gay, bisexual, and transgender community. Washington, DC: American Psychological Association; 2013. pp. 80–107. [Google Scholar]
- Nadal KL, Rivera DP, Corpus MJH. Sexual orientation and transgender microagressions: Implications for mental health and counseling. In: Sue DW, editor. Microaggressions and marginality: Manifestation, dynamics, and impact. Hoboken, NJ: Wiley; 2010. pp. 217–240. [Google Scholar]
- Nadal KL, Wong Y, Issa MA, Meterko V, Leon J, Wideman M. Sexual orientation microaggressions: Processes and coping mechanisms for lesbian, gay, and bisexual individuals. Journal of LGBT Issues in Counseling. 2011;5:21–46. doi: 10.1080/15538605.2011.554606. [DOI] [Google Scholar]
- O'Connor BP. SPSS and SAS programs for determining the number of components using parallel analysis and velicer's MAP test. Behavior Research Methods, Instruments, & Computers. 2000;32:396–402. doi: 10.3758/bf03200807. [DOI] [PubMed] [Google Scholar]
- Pascoe EA, Smart Richman L. Perceived discrimination and health: A meta-analytic review. Psychological Bulletin. 2009;135:531–554. doi: 10.1037/a0016059. [DOI] [PMC free article] [PubMed] [Google Scholar]
- Ramirez-Valles J, Kuhns LM, Campbell RT, Diaz RM. Social integration and health: Community involvement, stigmatized identities, and sexual risk in Latino sexual minorities. Journal of Health and Social Behavior. 2010;51:30–47. doi: 10.1177/0022146509361176. [DOI] [PMC free article] [PubMed] [Google Scholar]
- Reise SP, Bonifay WE, Haviland MG. Scoring and modeling psychological measures in the presence of multidimensionality. Journal of Personality Assessment. 2013;95:129–140. doi: 10.1080/00223891.2012.725437. [DOI] [PubMed] [Google Scholar]
- Reise SP, Moore TM, Haviland MG. Bifactor models and rotations: Exploring the extent to which multidimensional data yield univocal scale scores. Journal of Personality Assessment. 2010;92:544–559. doi: 10.1080/00223891.2010.496477. [DOI] [PMC free article] [PubMed] [Google Scholar]
- Rindskopf D, Rose T. Some theory and applications of confirmatory second-order factor analysis. Multivariate Behavioral Research. 1988;23:51–67. doi: 10.1207/s15327906mbr2301_3. [DOI] [PubMed] [Google Scholar]
- Robins L, Cottler L, Bucholz K, Compton W, North CS, Rourke KM. Diagnostic Interview Schedule for DSM-IV. St Louis, MO: Washington University School of Medicine, Department of Psychiatry; 2002. [Google Scholar]
- Robinson JL. Sexual orientation microaggressions and posttraumatic stress symptoms (Doctoral dissertation) 2014 Retrieved from https://poar.twu.edu/bitstream/handle/11274/3570/2014Robinsonc2.pdf.
- Schmid J, Leiman JM. The development of hierarchical factor solutions. Psychometrika. 1957;22:53–61. [Google Scholar]
- Sue DW. Microaggressions and marginality: Manifestation, dynamics, and impact. Hoboken, NJ: Wiley; 2010a. [Google Scholar]
- Sue DW. Microaggressions in everyday life: Race, gender, and sexual orientation. Hoboken, NJ: Wiley; 2010b. [Google Scholar]
- Sue DW, Bucceri J, Lin AI, Nadal KL, Torino GC. Racial microaggressions and the Asian American experience. Cultural Diversity and Ethnic Minority Psychology. 2007;13:72–81. doi: 10.1037/1099-9809.13.1.72. [DOI] [PubMed] [Google Scholar]
- Sue DW, Capodilupo CM. Racial, gender and sexual orientation microaggressions: Implications for counseling and psychotherapy. In: Sue DW, Sue D, editors. Counseling the culturally diverse: Theory and practice. New York: Wiley; 2007. pp. 109–131. [Google Scholar]
- Sue DW, Capodilupo CM, Torino GC, Bucceri JM, Holder AMB, Nadal KL, Esquilin M. Racial microaggressions in everyday life: Implications for clinical practice. American Psychologist. 2007;62:271–286. doi: 10.1037/0003-066x.62.4.271. [DOI] [PubMed] [Google Scholar]
- Woodford MR, Howell ML, Silverschanz P, Yu L. “That's so gay!”: Examining the covariates of hearing this expression among gay, lesbian, and bisexual college students. Journal of American College Health. 2012;60:429–434. doi: 10.1080/07448481.2012.673519. [DOI] [PubMed] [Google Scholar]
- Wright AJ, Wegner RT. Homonegative microaggressions and their impact on LGB individuals: A measure validity study. Journal of LGBT Issues in Counseling. 2012;6:34–54. doi: 10.1080/15538605.2012.648578. [DOI] [Google Scholar]