

Abstract
Mössbauer and EPR spectra of fermenting yeast cells before and after cell wall (CW) digestion revealed that CWs accumulated iron as cells transitioned from exponential to post-exponential growth. Most CW iron was mononuclear nonheme high-spin (NHHS) FeIII, some was diamagnetic and some was superparamagnetic. A significant portion of CW Fe was removable by EDTA. Simulations using an ordinary-differential-equations-based model indicated that cells accumulate Fe as they become metabolically inactive. When dormant Fe-loaded cells were metabolically reactivated in Fe-deficient bathophenanthroline disulfonate (BPS)-treated medium, they grew using Fe that had been mobilized from their CWs AND using trace amounts of Fe in the Fe-deficient medium. When grown in Fe-deficient medium, Fe-starved cells contained the lowest cellular Fe concentrations reported for a eukaryotic cell. During metabolic reactivation of Fe-loaded dormant cells, FeIII ions in the CWs of these cells were mobilized by reduction to FeII, followed by release from the CW and reimport into the cell. BPS short-circuited this process by chelating mobilized and released FeII ions before reimport; the resulting FeII(BPS)3 complex adsorbed on the cell surface. NHHS FeII ions appeared transiently during mobilization, suggesting that these ions were intermediates in this process. In the presence of chelators and at high pH, metabolically inactive cells leached CW Fe; this phenomenon probably differs from metabolic mobilization. The iron regulon, as reported by Fet3 levels, was not expressed during post-exponential conditions; Fet3p was maximally expressed in exponentially growing cells. Decreased expression of the iron regulon and metabolic decline combine to promote CW Fe accumulation.
Keywords: Mössbauer spectroscopy, electron paramagnetic resonance, Mathematical modeling, iron, Fit1, Fit2, Fit3
Graphical abstract
Yeast cells accumulate large quantities of ferric ions in their cell walls as they become metabolically inactive. This Fe can be reduced and mobilized as cells become metabolically active.

Introduction
Although commonly considered an extracellular structure, the cell wall (CW) is actually an intracellular component of fungal cells (1-4). It is synthesized from cellular components that are under the genetic control of the cell - about 20% of the genes in Saccharomyces cerevisiae affect CW construction (5, 6) – and the CW contributes to the cell's ability to survive and flourish. The CW provides structural support and rigidity, and it allows the cell to withstand high osmotic pressure. The CW allows cells to adhere to each other and to solid supports, and is involved in mating and morphogenesis (3). It affects the virulence of pathogenic fungi and thus has biomedical importance (7-11).
The CW of budding yeast S. cerevisiae consists of an inner glucan frame linked to an outer layer of mannose-based glycoproteins (12-15). The frame includes chitin and β-1,3-glucans. Numerous mannose-based glycoproteins are in the outer layer, most of which have N-linked glycosidic bonds anchored to the frame via β-1,6-glucan glycosylphosphatidylinositol (GPI) phosphodiester linkages (6). Mature GPI-CW proteins are linked to the frame via their C-termini. Their N-termini extend outward into the environment due to extensive glycosylation of serine and threonine residues in this region.
About 80% of the proteins in the CW can be solubilized using SDS, implying that such proteins are not covalently linked to the frame (1-6). Most covalently linked manno-proteins are solubilized by gluconase. Other CW proteins are attached to the frame via poorly defined “alkali-sensitive linkages”; these proteins dissociate from the frame under alkali conditions.
The CW constantly remodels as cells grow and divide, and its composition changes with the phase of the cell cycle and growth conditions. The CW acts like a filter to limit access of environmental species to cellular regions within the plasma membrane. Cell porosity refers to the degree to which such species pass through the CW and into the cytosol. CW porosity maximizes in the early-exponential phase of growth, and declines dramatically during post-exponential growth (2). Declining porosity is associated with increasing densities of mannan side-chains and disulfide bonds of the gluconase-solubilizable proteins of the outer layer. Porosity is not affected by the more abundant SDS-solubilizable mannoproteins.
From the energy-dispersive TEM spectrum, Vainshtein et al. identified iron-containing nanoparticles associated with the CW of yeast cells grown on medium containing high concentrations of iron (16). X-ray microanalyses suggested that these particles are ferric oxides. To the best of our knowledge, this is the only published physical characterization of CW iron in yeast. Philpott and coworkers determined that ca. 40% of cellular iron is released upon treatment with Zymolyase (17), a mixture of β-1,3-gluconase and proteases that catalyzes the disassembly of the CW and releases mannoproteins (18). This implies that a large percentage of cellular Fe can be found in the CW. The pH of the growth medium influences the amount and speciation of metals that accumulate in the CW (19).
The only S. cerevisiae CW proteins known to be involved in Fe metabolism are the “Facilitator of Iron Transport” mannoproteins Fit1, Fit2 and Fit3 (17). These proteins are secreted by the cell and bound to the frame by β-1,6-glucan units through GPI anchors. They contain numerous serine and threonine residues that are heavily glycosylated. FIT1/2/3 genes are part of the Aft1/2-associated Iron Regulon (20). These genes are transcribed under Fe-deficient growth conditions but not under Fe-rich ones. Their expression levels change dramatically (60 to 230 fold) depending on the concentration of Fe in the medium (17). Strains lacking these proteins have difficulty importing FeIII siderophores whereas the import rates of other FeIII complexes are unaffected. Thus, the Fit1/2/3 proteins facilitate import of specific siderophores, rather than all Fe-species that enter the cell. Fit1/2/3-deficient strains behave as though they are Fe-deficient even in Fe-replete medium, another indication that these proteins help import Fe. Less CW Fe is found in Fit-deficient strains, again suggesting that the Fit proteins are involved in Fe import (17). However, other Fe import proteins must also be involved. Fit proteins apparently do not affect CW porosity.
Iron is an essential component of all eukaryotic cells. In yeast cells, environmental Fe must pass through the CW on its way to the cell interior. Much cytosolic Fe is trafficked to the mitochondria where it is used in the biosynthesis of iron-sulfur clusters (ISCs) and heme centers (21). Many such centers are installed into respiratory complexes contained within that organelle. Under Fe-sufficient and Fe-excess conditions, Fe traffics into vacuoles for storage (22). Mitochondria and vacuoles are the two established “hubs” of Fe trafficking in yeast (23).
We recently reported that glucose-grown S. cerevisiae cells accumulate Fe in post-exponential stages of growth (24). Based on the spectral characteristics of the Fe that accumulated, we hypothesized that this Fe localized in vacuoles and/or mitochondria as mononuclear nonheme high-spin (NHHS) FeIII species and nanoparticles. At that time, we were unaware that the CW accumulates Fe. Once aware of this, we wondered whether the accumulated Fe in post-exponential cells might have actually localized in the CW rather than (or in addition to) vacuoles. In this paper, we show that this is indeed the case. Our results suggest that there are multiple types of FeIII species in the CW, and that CW Fe accumulates when metabolic activity is declining. CW FeIII is reductively mobilized and released from metabolically reactivated cells. Some of the resulting FeII ions are reimported into such cells to support growth. The concentration of CW Fe is high, far greater than that found within the cytosol and internal organelles, indicating that the CW is a third “hub” in fungal iron trafficking.
Methods
Yeast Strain and Media
W303-1B (MATα, ura3-1, ade2-1, trp1-1, his3-11,15, leu2-3,112) cells were grown from frozen stocks on standard YPAD agar plates for 3-4 days. The medium contained 1% yeast extract, 2% peptone, 2% (w/v) glucose and 40 mg/L adenine hemisulfate dihydrate. Single colonies were used to inoculate YPD medium. YPD-grown cells were used to inoculate synthetic minimal medium (MM) prepared as described (25) with 40 μM 57FeIII citrate added (24). We will refer to this medium as 57Fe40B0, where the superscript indicates the Fe isotope used, the first subscript indicates the final concentration of added Fe-citrate in μM, and the last subscript indicates the final concentration (also in μM) of added bathophenanthroline disulfonate (BPS). The FeII chelator BPS is commonly used to generate Fe-deficient medium. Other MM-based media used include 56Fe40B0, 57Fe1B21, Fe0B30, Fe0B100, Fe0B0, and Fe0B100-NAB (Table S1). NAB indicates medium prepared with No Amino acids or Bases. Sterile deionized water (DW) was also used as a medium into which cells were inoculated.
Fe-loaded and Fe-starved cells
A colony was used to inoculate 50 mL of YPD medium, and cells were grown in a shaker at ∼ 150 rpm and 30 °C until OD600 = 1.0. An aliquot was transferred to 57Fe40B0 medium, achieving OD600 = 0.01. Cells grown for 5 days will be called Fe-loaded or post-exponential. Another aliquot was added to 57Fe1B21 medium, again attaining OD600 = 0.01. Cells harvested after 15 hrs (OD600 ≈ 1.0) or 5 days will be called Fe-starved.
Cell manipulations and spectroscopy
Cells were harvested by spinning at 2,500×g for 5 min. Cells were washed 3 times with chilled 100 μM EDTA in 150 μM Tris pH 8.0 followed by 3 washings with chilled DW. Resulting cells were packed into 5 mm OD tubes by centrifugation at 4,000×g for 5 min using an ultracentrifuge (Beckman Coulter Optima L-90K) and swinging-bucket rotor (SW 32 Ti). For metal analysis, packed cells were resuspended with an equal volume of DW. Resulting suspensions were incubated overnight in 200 μL of 30% trace-metal grade HNO3 (Fisher Scientific) at 95 °C, and then diluted with DW before analysis. Fe concentrations were measured by ICP-MS (Agilent 7700×) as described (26). A cell packing efficiency of 70% was used (27). Western Blots were performed as described (24).
For Mössbauer (MB) studies, cells were loaded into MB cups by centrifugation at 5,000×g for 5 min and frozen in liquid N2. MB spectra were collected on either a model MS4 WRC or LHe6T spectrometer (SEE Co., Edina, MN). Both instruments were calibrated using α-Fe foil at RT. For UV-vis studies, packed cells were diluted with an equal volume of DW and then transferred to a 2 mm pathlength quartz cuvette (NSG Precision Cells, Inc.). Spectra were recorded on a Hitachi 3010 spectrometer possessing a Head-On photomultiplier tube. Absorbances were measured 6 times and results were averaged and multiplied by 5 to yield the value expected if a 10 mm rather than a 2 mm path-length cuvette had been used.
Dissolved O2 concentrations
An O2 probe (24″ long FOXY-T-1000-RTD, Ocean Optics Inc, Dunedin FL) was placed in an iron-free custom glass/titanium bioreactor filled with 24 L of 57Fe40B0 medium at 30 °C. The reactor was inoculated with cells that had been grown overnight in YPAD similarly supplemented. Standard purity O2 gas was bubbled into the bioreactor at a fixed rate of ca. 500 mL/min. The paddle stir-rate was ca. 100 RPM.
Measuring CW Fe release
Cells were grown in the bioreactor for 5 days and then centrifuged and washed twice with water to remove residual medium. Cells were resuspended in water and aliquots were transferred into 50 mL plastic screw-top vials. The vials were centrifuged to yield pellets the volumes of which (ca. 5 mL) were determined from the height of the pellet and the mass of water needed to fill the vial to that height (after the experiment). The volume of the pellet was corrected for packing efficiency. Various treatment buffers (40 mL) were added to each tube at time 0, including: water, 100 μM EDTA (prepared in 150 μM Tris buffer pH 8.0), and 100 μM EDTA plus lyticase (Sigma; 1000 U of lyticase activity per gram of wet packed cell in tube) in SP buffer (1.2 M sorbitol in 50 mM potassium phosphate pH 7.4). At 10 min intervals, 2 mL of solution were removed from each tube and transferred to microfuge tubes and centrifuged. Supernatants were saved for metal analysis and pellets were washed twice with triple-distilled water or SP buffer (lyticase samples) that lacked chelators or lyticase. The volumes of these pellets and supernatants were measured, and Fe, Mn, Cu, and Zn concentrations were determined. At each buffer condition, the relationship Vpell•[Fepell] + Vsup•[Fesup] equalled a constant number of moles at each time point within an error of ± 10%.
Results and Discussion
Mössbauer and EPR characterization of iron-loaded post-exponential cells before and after CW digestion
Iron accumulates in glucose-grown yeast cells as they transition from exponential to post-exponential growth (24). To test whether that Fe accumulated in the CW, we grew WT cells in 57Fe40B0 medium and harvested them during exponential (OD600 = 0.2, 0.4, and 0.7) and post-exponential (OD600 = 1.5, 5 days after inoculating) growth phases. Cells were washed 3 times with water, 100 μM EDTA, or EDTA plus lyticase, an enzyme that, like zymolyase, digests CWs.
Low-temperature (5 K), low-field (0.05 T) MB spectra of cells harvested at different times during exponential phase and washed in water (Figure 1, A and B) were similar to each other and to previous spectra of cells harvested in this growth phase (24). Exponential cells washed with EDTA exhibited similar spectra (data not shown). Spectra were dominated by a sextet due to NHHS FeIII in the vacuole (Figure 1, green line) followed by a central quadrupole doublet (gold line) due mainly to [Fe4S4]2+ clusters and LS FeII heme centers in mitochondria (28). Minor quadrupole doublets due to HS FeII heme (orange line) and NHHS FeII (purple line) were also evident. The average concentration of Fe in these samples was 370 ± 170 μM. Cellular Mn, Cu and Zn concentrations were also determined (Table 1). A portion of freshly harvested exponentially grown cells were treated with lyticase, but this had no significant effect on the spectrum (Figure 1C), suggesting that little if any Fe accumulated in the CWs of exponentially growing cells.
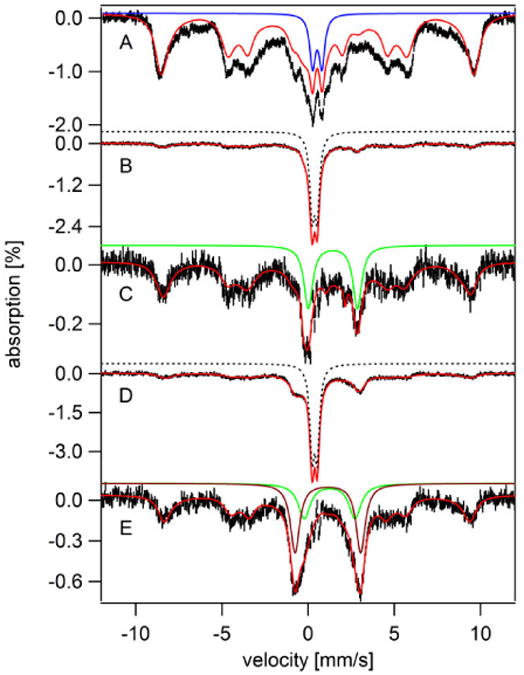
Figure 1. Low field (0.05 T) low temperature (5 K) Mössbauer spectra of whole intact fermenting WT cells grown on 57Fe40B0 medium and harvested at different growth stages.
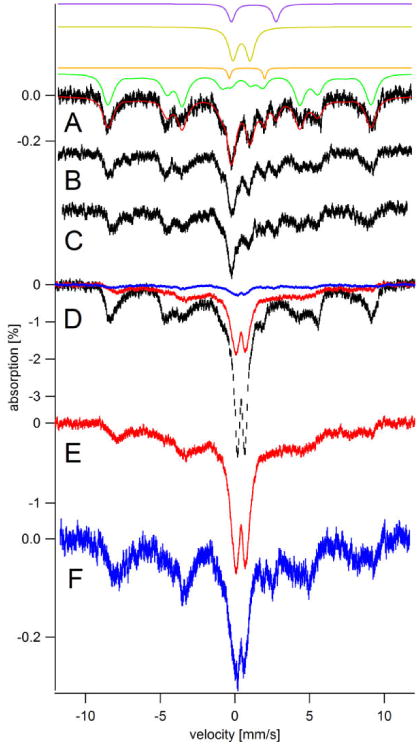
A, harvested at OD600 = 0.4 (exponential stage) and washed with water; B, harvested at OD600 = 0.7 (exponential stage) and washed with water; C, same as B except treated with lyticase/EDTA; D, black hash-marks, harvested at OD600 = 1.5 (post-exponential stage; 5 days) and water washed; E, same as D except washed with EDTA; F, same as D and E except treated with lyticase/EDTA. Red and blue hashmarks in D are the same spectra as shown in E and F, respectively, scaled to the spectrum in black. Solid red line in A is a simulation consisting of NHHS S = 5/2 FeIII from vacuoles (green line; 74%; δ = 0.41 mm/s; ΔEQ = 0.3 mm/s; Aiso/gnβn = -228 kG; D = 0.5 cm-1; E/D = 0.33; η = 3; Γ = 0.7 mm/s), HS Heme FeII (orange line: δ = 0.8 mm/s; ΔEQ = 2.4 mm/s; Γ = 0.3 mm/s), central doublet (gold line: δ = 0.45 mm/s; ΔEQ = 1.15 mm/s; Γ = 0.7 mm/s), and NHHS FeII (purple line: δ = 1.26 mm/s; ΔEQ = 3.0 mm/s; Γ = 0.6 mm/s). The Y-axis scale for A, B, and C are the same.
Table 1.
Metal concentrations of WT cells grown to exponential and post-exponential phases, and subsequently treated with EDTA or lyticase. Concentrations are in μM.
| OD600 | Treatment | [Fe] | [Mn] | [Cu] | [Zn] |
|---|---|---|---|---|---|
| 0.2 | Water | 230 | 14 | 22 | 320 |
| 0.4 | Water | 190 | 12 | 24 | 440 |
| 0.7 | Water | 590 | 10 | 24 | 560 |
| 0.7 | Lyticase/EDTA | 480 | 13 | 21 | 420 |
| 1.5 | Water | 7400 | 12 | 32 | 620 |
| 1.6 | EDTA | 4400 | 9 | 24 | 510 |
| 1.5 | Lyticase/EDTA | 1800 | 8 | 30 | 600 |
The MB spectrum of cells harvested 5 days after inoculation, in post-exponential mode, exhibited a percent effect 10-times greater than that of cells harvested during exponential growth (Figure 1D, black trace). Subsequent ICP-MS analysis indicated that such cells were indeed loaded with Fe (Table 1). Cells from the same harvest but treated with lyticase/EDTA and then washed 3 times with SP buffer afforded a MB spectrum (Figure 1, D and F, blue traces) that was only ca. 10% as intense as that of water-washed cells. Similar cells treated with EDTA alone exhibited a spectrum (Figure 1, D and E, red line) that was less intense than water-washed cells but more intense than those washed with lyticase/EDTA.
After the MB spectra of Figure 1 (and Figures 4 and 5, see below) were collected, samples were pulverized and packed into EPR tubes while being kept in or directly above liquid N2. The 10 K X-band EPR spectrum of post-exponential cells showed dramatic changes upon lyticase/EDTA treatment (Figure 2, A vs. C). The spectrum of the water-washed sample (Figure 2A) exhibited intense features at g = 4.3 and in the g = 2 region. The g = 4.3 signal is typical of paramagnetic NHHS FeIII species with rhombic symmetry. The signal in the g = 2 region was unusually broad as is typical of FeIII oxyhydroxide nanoparticles found in mitochondria of yeast that are defective in ISC-related processes (29-31). The intensity at g = 4.3 was significantly diminished and the broad g = 2 signal was absent in the spectrum of the lyticase/EDTA-treated sample (Figure 2C). The EPR spectrum of the sample treated only with EDTA (Figure 2B) was also devoid of the broad g = 2 signal and the integrated intensity of the sharper g = 4.3 derivative signal was reduced relative to that in the spectrum of water-washed cells. The decline in the intensity of these signals upon lyticase treatment suggests that CW Fe is heterogeneous, with mononuclear NHHS FeIII affording the g = 4.3 signal and superparamagnetic FeIII nanoparticles affording the broad g = 2 signal.
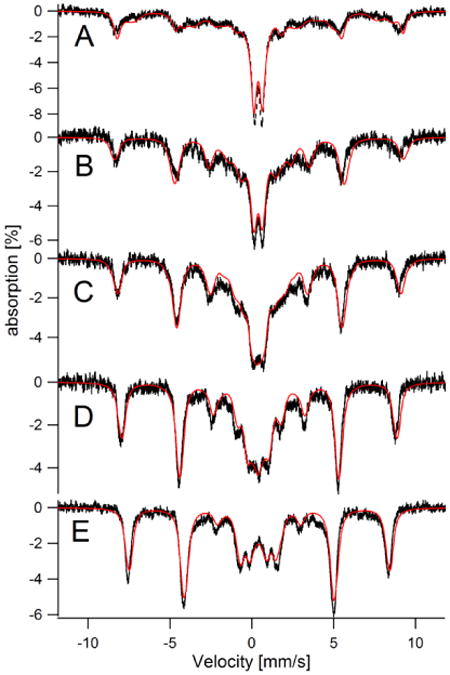
Figure 4. Temperature-dependent Mössbauer spectra of 57Fe-loaded cells (water washed).
A, 5; B, 15; C, 25; D, 50; E, 75; F, 100; G, 150 (all in K). A field of 0.05 T was applied parallel to the gamma radiation. The sample used was the same as in Figure 1D. Overall simulations (red lines in A and F) were the sum of two simulated spectra, including an S = 5/2 species (Aiso/gnβn = -216 kG, D = 0.04 cm-1, E/D = 0.22, δ = 0.45 mm/s, ΔEQ = 0.5 mm/s, η = 10 and Γ = 0.4 – 0.7 mm/s) representing 70% of spectral intensity, and an S = 0 species (δ = 0.38 mm/s, ΔEQ = 0.5 mm/s, η = 1 and Γ = 0.4 – 0.7 mm/s) representing 30% of spectral intensity. With increasing temperature, spectral features broadened.
Figure 5. Variable-Field 4.2 K Mössbauer spectra of 57Fe-loaded (water washed) cells.
A, 0; B, 0.75; C, 1.5; D, 3.0, and E, 6.0 (all in T). Fields were applied perpendicular to the gamma radiation. Overall simulations (red lines) were generated using the same model as in the Figure 4 legend. The sample was the same as used in Figures 1D and 4. The simulation in A assumed an applied field of 0.02 T and that the sextet represented 65% of spectral intensity and the doublet 35%.
Figure 2. 10 K X-Band EPR spectra of whole intact fermenting yeast cells.
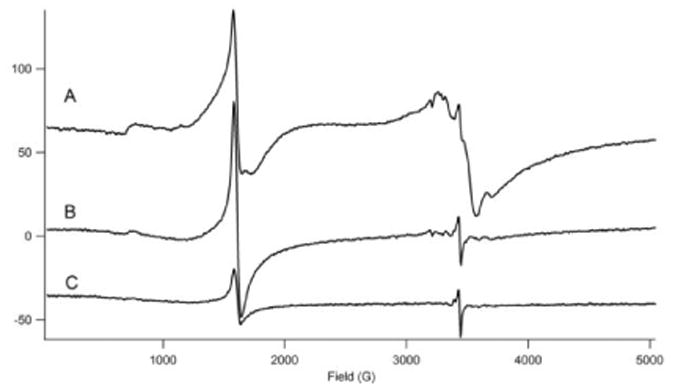
A, treated with water; B, treated with EDTA; C, treated with EDTA/lyticase. Other EPR conditions: microwave power, 0.2 mW; microwave frequency, 9.645 GHz; modulation amplitude, 9.2 G; sweep time, 160 sec. Samples were the same as those used to generate Figure 1 D, E, and F, respectively, obtained by transferring samples from MB holder to EPR tubes while maintained near 77 K.
The concentration of cellular Fe after lyticase-treatment was about 24% of that in water-washed cells (Table 1). Interestingly, the concentrations of Mn, Cu, and Zn did not increase in post-exponential cells, relative to concentrations of the same metals in exponential cells, and the concentrations of the same metals did not decline upon lyticase treatment. We conclude that Fe (but not Cu, Mn, or Zn) accumulates in the CW of post-exponential (but not exponential) cells and that the majority (75% - 90%) of the Fe in those cells is located in the CW.
Rate of O2-dependent metabolism declines in post-exponential cells
To evaluate whether post-exponential cells are metabolically active, we simultaneously measured cell density, as reported by OD600, and dissolved [O2] in the growth medium vs. time after inoculating 24 L of minimal medium with cells that had been grown overnight in YPAD. [O2] consumption was used as a reporter of metabolic activity. O2 gas was bubbled into the bioreactor at a fixed rate, with temperature and stir conditions also fixed. The resulting OD600 trace (Figure 3, green dots) exhibited a lag phase followed by exponential growth and then a transition into the post-exponential state. The corresponding traces of dissolved [O2] (Figure 3, red dots) began high (because the reactor contained few cells and the bubbling rate was fast) and then declined as the concentration of cells and O2 consumption increased (overpowering the fixed bubbling rate). Towards the end of the experiment, dissolved [O2] gradually returned to near its initial concentration.
Figure 3. Model of cell growth and O2 consumption in a batch culture of WT fermenting S. cerevisiae.
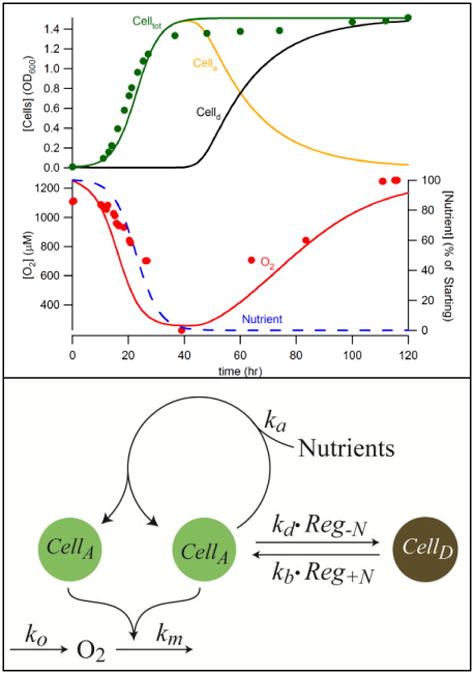
Upper panel: plots of OD600 and [O2] in 57Fe40B0 medium vs. time after inoculation. Data are solid green (OD600) and red (O2) circles. Simulations are green (total cells), yellow (active cells), black (dormant cells), blue (nutrient concentration) and red (O2 concentration) lines. Lower panel: chemical model showing generation of O2, consumption of O2 by active cells, self-replication of active cells, and interconversion of active and dormant cells as regulated by the nutrient concentration.
This final return of [O2] to near its initial concentration indicated that metabolically active cells converted into an inactive dormant state when nutrients became scarce. We assumed this in a chemical model (Figure 3, bottom and Table 2) in which metabolically active cells (CellA) self-replicate and metabolize O2 along with a hypothesized nutrient N. Dormant cells (CellD) were assumed only to convert into active cells when [N] levels were sufficiently high. This model was translated into ordinary differential equations (ODEs) [1] – [4].
Table 2.
Model Reactions, Parameters and Sensitivities. Sensitivities were determined as described (32). 1250 is the maximum concentration (in μM) of dissolved O2 in the medium. The rate of O2 increase in the medium at any time was assumed to be proportional to the difference between 1250 μM and the concentration of dissolved O2 at that time. This arrangement prevented [O2] from exceeding the known saturation limit of O2. ANU, arbitrary nutrient units.
| Reaction | Rate Expression | Parameter | Sensitivity | ||
|---|---|---|---|---|---|
|
|
Ra = ka · [N] · [CellA] | ka = 0.18 hr-1ANU-1 | 1.08 | ||
|
|
Rm = km · [O2] · [CellA] | km = 690 hr-1OD-1 | 1.04 | ||
|
|
|
kd = 0.072 hr-1 [N]sp = 0.01 ANU sen = 6.6 |
1.01 1.00 1.00 |
||
|
|
Ro = ko · (1250 – [O2]) | ko = 220 hr-1 | 1.01 | ||
|
|
|
kb = 0.33 hr-1 | 1.00 |
| [1] |
| [2] |
| [3] |
| [4] |
Reg-N functions (32) were used to regulate the rate at which metabolically active cells became dormant and dormant cells became active. Selecting initial parameters was complicated because the concentration of total cells at each time was unknown, as were the identity and concentration of N. For simplicity, we assigned cell concentration to units of OD600, such that the initial cell concentration was taken as 0.01 (the OD600 at the time of inoculation) and the final concentration was taken as 1.4 (OD600 at the time of harvesting). Given the assumed stoichiometry that 1 N is required to generate 1 CellA (Table 2) and the need for a dramatic decline in [N] to prompt the conversion from CellA → CellD, we selected initial [N]0 = 1.5, just greater than the final OD600. This concentration was high enough to generate all of the cells in the experiment but low enough to decline dramatically (percentagewise) during the time-course of the experiment.
ODEs [1] – [4] were numerically integrated using the NDSolve routine in Mathematica 9 (http:\\www.wolfram.com). The model was optimized by adjusting parameters ka, kb, kd, km, ko, [N]sp, and sen (Table 2), minimizing the RMSD function defined in Appendix A (Electronic Supplementary Information) to the value 0.016. Simulations (Figure 3, upper panel, solid lines) fit the data acceptably well. The cells used to inoculate the culture were assumed to be dormant (CellD), so that their conversion to active cells (CellA) could generate the observed lag phase that preceded exponential growth. Self-replication of active cells and the consumption of O2 were the most sensitive reactions of the model, whereas the activation of dormant cells was the least sensitive (Table 2). The increase of dormant cells correlated well with the accumulation of large quantities of CW Fe. We conclude that cells accumulate Fe in their walls as they become metabolically inactive.
Cell wall iron consists of a heterogeneous distribution of FeIII species
To characterize CW iron further, we collected MB spectra of Fe-loaded dormant cells at 5, 15, 25, 50, 75, 100, and 150 K (all at 0.05 T parallel-applied magnetic field, Figure 4, A - G) and at perpendicular-applied magnetic fields of 0, 0.75, 1.5, 3, and 6 T (all at 4.2 K, Figure 5). We also collected X-band EPR spectra of such cells at 10, 20, 40 and 80 K (Figure 6, red, yellow, green, and blue lines, respectively). MB spectra were composed of sextet and doublet species, with the sextet representing the majority. Given the results of Figure 1 and Table 1, we presumed that all of the spectral absorption was due to CW Fe, and that the sextet and doublet arose from a paramagnetic S = 5/2 FeIII species and a diamagnetic S = 0 species, respectively. A small contribution to the sextet intensity was probably due to vacuolar mononuclear NHHS FeIII (S = 5/2) but this contribution could not be distinguished from the dominating CW FeIII. A small contribution to the doublet intensity was probably due to superparamagnetic FeIII oxyhydroxide nanoparticles. (A portion of the doublet intensity could have arisen from an integer spin species with a very small hyperfine field, but this seems unlikely.) Any central doublet due to mitochondrial [Fe4S4]2+ clusters and LS FeII hemes was undetectable due to the dominance of the CW Fe and so we made no attempt to take this feature into account. The high-energy line due to HS FeII heme, representing a few percent of the overall spectral absorption, was observed at low temperatures, but this was also ignored in fitting.
Figure 6. Temperature-dependent EPR spectra of 57Fe-loaded cells (water washed).
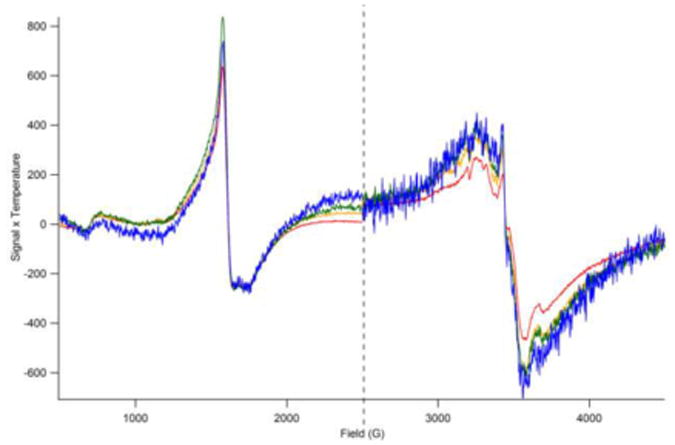
Low-field spectra show the g = 4.3 signal while high-field spectra exhibit a broad g = 2 signal. Spectra were collected at 10 K (red line), 20 K (yellow), 40 K (green), and 80 K (blue). Signal intensities have been multiplied by temperature. The sample used was the same as in Figure 1D, 4 and 5. Microwave power was 2 mW and 0.2 mW for the low- and high-field spectra, respectively. Other conditions were as in Figure 2.
At 4.2 K and 0.05 T, diamagnetic and superparamagnetic species could not be distinguished. Collectively they represented ca. 30% of spectral intensity. As the temperature was raised, the shape of the spectra changed but the intensity ratio of the sextet to the main doublet remained about the same. This suggested that any superparamagnetic Fe contribution associated with the doublet has a Blocking temperature TB ≪ 4.2 K. At high applied fields (e.g. Figure 5E), a superparamagnetic species will magnetically split depending on the hyperfine field, whereas diamagnetic species will not do this. Thus we assigned the ill-resolved region in the middle of the 4.2 K, 6T spectrum to diamagnetic species. Simulation of this region with an S = 0 Hamiltonian indicated that ca. 20% spectral intensity was due to diamagnetic species. This implies that the superparamagnetic species accounts for ca. 10% of spectral intensity. This low percentage, along with the broad distribution in hyperfine fields, made it impossible to reliably simulate the superparamagnetic species at high field.
The sample was transferred from a Mössbauer cup to an EPR tube while maintaining it at or near liquid N2 temperatures. The sample exhibited a g = 4.3 EPR signal due to the H.S FeIII species. The signal exhibited Curie-Law behavior in that the intensity of the product of signal intensity·temperature (S·T) was invariant between 10 K and 80 K (Figure 6). The broad g = 2 signal, which we assign to the superparamagnetic species, also seemed to exhibit Curie-Law behavior although there was a modest decrease in S·T at low T.
Compare the spectroscopic properties of the superparamagnetic nanoparticles to those of the 2 - 4 nm diameter nanoparticles in Yah1-depleted mitochondria (30). In Yah1-depleted cells, the superparamagnetic doublet had δ = 0.52 mm/s and ΔEQ = 0.62 mm/s at 5 K; here, δ = 0.38 mm/s and ΔEQ = 0.50 mm/s. Like the current superparamagnetic species, Yah1-depleted nanoparticles had TB ≪ 5 K such that a superparamagnetic doublet was observed at all temperatures > 4.2 K. The EPR spectrum associated with nanoparticles from Yah1-depleted mitochondria also exhibited a broad g = 2 feature with anti-Curie-Law behavior. However, the inverse-temperature effect was more dramatic for the nanoparticles of Yah1-depleted mitochondria than what we observed here.
Kinetics of cell wall iron release by chelation and enzymatic digestion
The experiments of Figure 1 show that CW Fe can be released under different wash conditions. To evaluate the rate of Fe release, we measured the concentration of cellular Fe as a function of time after treating Fe-loaded cells with water, EDTA at pH 8, or lyticase/EDTA at pH 8. We also monitored the concentration of Fe released into the medium. In all trials, we could account for > 90% of the released Fe. About 80% of CW Fe was removed by treating the cells with lyticase/EDTA for 1 hr (Figure 7, blue lines). The reaction was almost completed in 30 min. Equivalent treatment with EDTA alone (red lines) was less effective whereas treatment with water alone (black lines) was essentially ineffective. These results are qualitatively congruent with the MB/EPR experiments described above (however, the MB study suggests that EDTA is less effective in removing CW Fe, compared to EDTA/lyticase treatment, relative to the results of Figure 7). Similar results were obtained using EGTA rather than EDTA (data not shown). We estimate that over half of the CW Fe in dormant cells can be removed reasonably well by chelators such as EDTA at pH 8; this estimate assumes that all CW Fe is removed by enzymatic digestion.
Figure 7. Iron concentrations in WT post-exponential cells and the corresponding washes after various treatments.
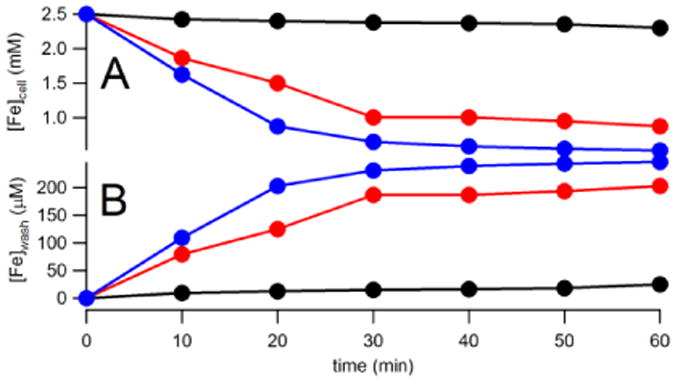
A, [Fe]cell; B, [Fe]wash. Data are solid circles. Black, washed with water only; Red, washed with EDTA only; Blue, washed with lyticase and EDTA.
Metabolically Reactivated Fe-loaded cells grow using Fe mobilized from their internal stores AND from Fe in the medium, including trace levels of Fe in Fe-deficient medium
To evaluate whether cells can utilize their internal Fe stores for growth, we grew cells on 57Fe40B0 medium for 4 days (into stationary phase). After washing 3 times with 100 μM EDTA at pH 7, the resulting metabolically inactive 57Fe-loaded cells contained 4.1 ± 0.4 mM Fe (n = 3) (less CW Fe is removed by EDTA at lower pH).
These 57Fe-loaded cells were used to inoculate Fe-deficient Fe0B30 medium, yielding OD600 ≈ 0.01 at the start of the experiment. The 30 μM concentration of BPS in the medium was >30 times that required to coordinate all cellular Fe and endogenous Fe in the medium.Footnote1 The 57Fe-loaded cells in this experiment grew slowly, exhibiting a minimal doubling time (DT) of 4.8 hr (Figure 8A, solid circles). In contrast, cells growing on Fe-sufficient minimal medium replicate ∼ every 2 hr (24). After 3 - 4 days, the culture that had been inoculated with 57Fe-loaded cells reached a final OD600 of 1.6 ± 0.3 (n = 2), slightly less than the final OD600 = 2 attained by cells grown in standard Fe40B0 medium. The stationary-state cells contained only 57 ± 7 μM Fe (n = 2). In contrast, cells on the Fe-sufficient medium and harvested under exponential growth conditions contain 300 - 400 μM Fe (24).
Figure 8. Panel A, Growth of Fe-loaded or Fe-starved Cells after transfer to various media.
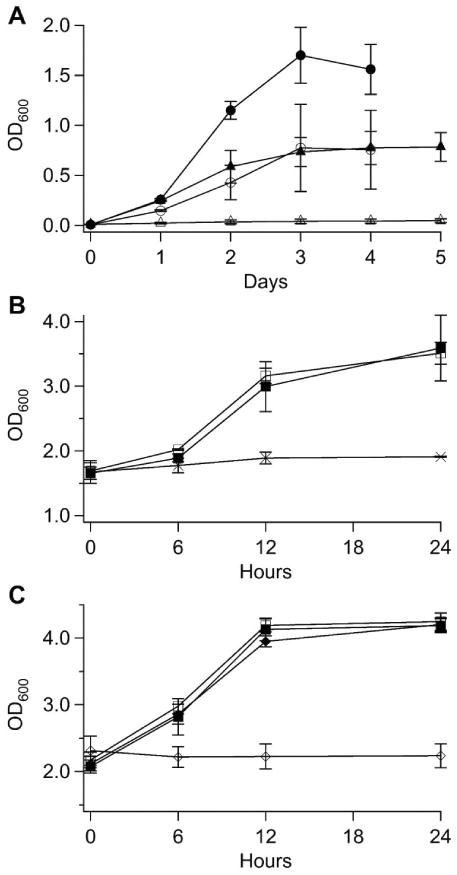
Solid circles, Fe-loaded cells transferred to Fe0B30 medium. Open circles, Fe-starved cells transferred to Fe0B30 medium. Solid triangles, Fe-loaded cells transferred to Fe0B100. Open triangles, Fe-starved cells transferred to Fe0B100 medium. Panel B, Growth of Fe-loaded cells transferred to various media inoculated at conserved cell density. Solid squares, transferred to 57Fe40B0 medium. Open squares, transferred to Fe0B100 medium. Crosses, transferred to Fe0B100-NAB medium. Panel C, same as Panel B, but a different experiment. Solid squares, transferred to 56Fe40B0 medium. Open squares, transferred to Fe0B100 medium. Solid diamonds, transferred to Fe0B0 medium. Open diamonds, transferred to DW.
Had the 57Fe-loaded cells exclusively used their intracellular stores of 57Fe for growth, and not import any 56Fe from the Fe-deficient medium, they should have doubled 6 times and then stopped growing (4100μM ÷ (2)6 ≈ 57μM). The observed OD600 change indicates that they actually stopped growing after ∼ 7 doublings (1.6 ÷ (2)7 ≈ 0.01). This implies that about half of the Fe used by these cells originated from their 57Fe stores and half from the tiny amount of endogenous 56Fe in the Fe0B30 medium. This result was surprising because yeast cells are commonly thought to be unable to grow on Fe-deficient medium treated with BPS. If the endogenous Fe in BPS-treated medium is chelatable by (and kinetically accessible to) BPS, the tight-binding nature of the FeII(BPS)3 complex implies that virtually all endogenous Fe in the medium should have been chelated by BPS. Perhaps some fraction of the endogenous Fe is inaccessible to BPS yet can be imported and used by cells.
A second batch of 57Fe-loaded cells with an [56Fe]/[57Fe] isotope ratio estimated at ca. 0.05 was transferred to Fe0B30 medium, achieving an initial OD600 = 0.01. After 7 doublings the resulting 56Fe/57Fe ratio in the harvested cells was 1.0 (25 μM 56Fe and 24 μM 57Fe). The increase in cellular 56Fe must have originated from the trace amounts of 56Fe in the Fe0B30 medium as there was no other source of 56Fe in the experiment. In a third experiment, 56Fe-loaded cells were used to inoculate Fe0B30 medium. In this case, the final 56Fe/57Fe ratio in the harvested cells was 44 (62 μM 56Fe and 1.4 μM 57Fe), again consistent with the import of endogenous 56Fe from Fe-deficient media. In both cases, the final [56Fe]/[57Fe] ratios in the harvested cells reflected the relative amounts of the Fe isotopes in the Fe-loaded cells and in the endogenous Fe in the medium. We conclude that Fe-loaded yeast cells can grow on their internal Fe stores AND on trace amounts of endogenous Fe present in Fe-deficient medium.
Metabolically reactivated cells mobilize cell wall FeIII species
We wanted to identify the type of internal Fe stores that are used by Fe-loaded cells to grow on Fe-deficient medium. Our approach was to use MB spectroscopy. 57Fe-loaded cells were transferred into 3 different media, namely 57Fe40B0 (the control for which Fe stores should not be used), Fe0B100 (Fe-deficient, for which Fe stores should be used), and Fe0B100-NAB. The last medium was designed to prevent cells from growing in an iron-deficient environment, thereby eliminating the effects of cell growth and metabolic activity. In these experiments, the amount of Fe-loaded cells used to inoculate fresh media was much greater than in the first set of experiments, such that the OD600 immediately after inoculation was approximately equal to the OD600 when the Fe-loaded cells (used for that inoculation) had been previously harvested. This allowed MB spectroscopy (which requires large quantities of cells) to monitor changes in cellular Fe content.
The 57Fe-loaded cells initially contained 4.9 ± 1.5 mM Fe (n = 2). Surprisingly, the cells grew equally well on 57Fe40B0 and Fe0B100 media. Thus, cells that were loaded with Fe in their CWs and vacuoles grew as fast and to the same final extent in Fe-deficient media as they did in Fe-rich media; i.e. the absence of Fe in the medium did not limit the growth rate. The OD600 of these cultures increased from 1.7 at the time of inoculation to 3.6 after 24 hr of growth (Figure 8B, solid and open squares, respectively).
Despite the same growth rate, the concentration of Fe in the resulting harvested cells was quite different. The cells harvested from the 57Fe40B0 medium contained 3.9 ± 0.9 mM Fe while those harvested from the Fe0B100 medium contained 1.3 ± 0.4 mM Fe (n = 2 for each condition). If dilution due to cell growth was the only factor affecting these final cellular Fe concentrations (i.e. if Fe had not been imported from or exported to the environment), the 57Fe40B0–grown cells would have contained 2.3 mM Fe after the 24 hr incubation. The fact that they contained more Fe indicates that they (not surprisingly) imported Fe from Fe-rich Fe40B0 medium. Thus, cells import environmental Fe even if they are not growth-limited by Fe.
The Fe concentration in the cells harvested from Fe0B100 medium was 1.8-fold less than that expected if they had grown and divided exclusively using their own Fe stores. Where did the rest of their Fe stores go? The simplest interpretation is that the Fe-loaded cells mobilized and released ∼ 40% of their internal Fe stores when incubated in Fe-deficient medium for 24 hrs. We will show below that some of the released Fe coordinated to BPS and that the resulting FeII(BPS)3 complexes adsorbed onto cell surfaces. Counting this absorbed Fe as part of the Fe that was mobilized suggests that these cells actually mobilized much more than 40% of their internal Fe stores during growth after dormancy. Some of the mobilized Fe remained in the growth medium, some coordinated to BPS, and some was reimported into the cell. Only this latter portion supported cell growth. We conclude that a large portion of cellular Fe in post-exponential Fe-loaded (dormant) cells is rapidly mobilized when such cells are metabolically reactivated.
The 57Fe-loaded cells that were transferred into Fe0B100-NAB medium barely grew during the same 24 hr period; the OD600 of the culture increased from 1.7 → 1.9 (Figure 8B, crosses) whereas the concentration of Fe in these cells declined to 2.9 ± 0.9 mM (n = 2). The extent of Fe loss was greater than could be explained by the effects of growth-associated dilution. Dilution would have caused the Fe concentration to decline only to ∼ 4.3 mM. Thus, nearly 30% of the Fe in the Fe-loaded cells must have been released and used to support growth after those cells were transferred to Fe-deficient medium.
We then used MB spectroscopy to investigate the type(s) of Fe centers mobilized by Fe-loaded cells when such cells are grown on Fe-deficient media. The low-temperature low-field MB spectrum of 57Fe-loaded cells (Figure 9A) was dominated by a sextet representing 65% of total spectral intensity. A similar feature is present in the spectra of Figure 1D and 4A which we have shown to be due to CW Fe. This sextet was similar to that arising from vacuolar Fe (33) which is why we previously assigned it as such (24). Another 10% of the spectral intensity was due to a quadrupole doublet in the center of the spectrum (simulated by the blue line in Figure 9A). Both features are simulated collectively by the solid red line. The minor differences in simulation parameters relative to those used to fit the spectra of Figures 4 and 5 may reflect batch-to-batch variation as well as uncertainties caused by fitting overlapping spectral features. Some of the intensity of Figure 9A appears to be due to broad, unresolved and poorly characterized magnetic features similar to those described previously (24). MB parameters and total Fe concentrations for these samples are listed in Table S3.
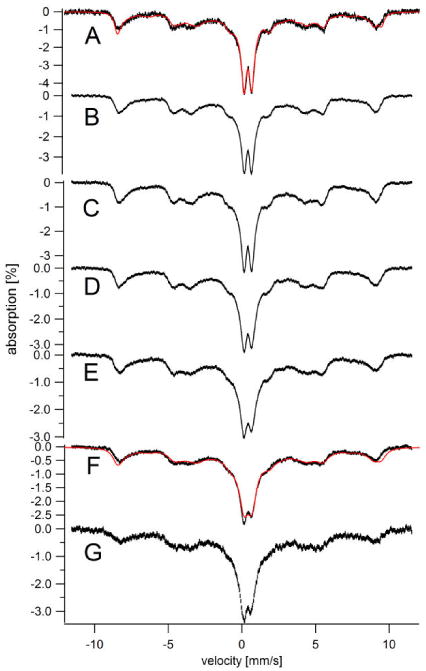
Figure 9. Mössbauer spectra (5 K, 0.05 T) of whole WT yeast cells before (A) and after (B – E) switching growth media.
Results from this experiment are also presented in Figure 8B. A, Fe-loaded cells. The blue line is a simulation of FeIII nanoparticles (δ = 0.53 mm/s; ΔEQ = 0.52 mm/s; Γ = 0.45 mm/s). The red line is a composite simulation including 20% absorption due to nanoparticles and 65% to NHHS FeIII (Aiso/gnβn = -235 kG; E/D = 0.33; D = 1.15 cm-1; δ = 0.55 mm/s; ΔEQ = 0 mm/s; Γ = 0.8 mm/s). B, Fe-loaded cells 5 days after being transferred to Fe0B100. Red line is a composite simulation including NHHS FeIII and the quadrupole doublet due to 57FeII(BPS)3. Simulation parameters are given in Table S3. C, same as B but after removing the quadrupole doublet due to 57FeII(BPS)3. The green line is a simulation of the NHHS FeII doublet and the red line is a composite simulation defined in Table S3. D, Fe-loaded cells 1 day after being transferred to Fe0B100-NAB medium. Red line is a composite simulation. E, same as D but after removing the quadrupole double due to FeII(BPS)3. Green and maroon lines are simulations of the two NHHS FeII species described in the text. The red line is a composite simulation.
The MB spectrum of 57Fe-loaded cells that had grown for 24 hr on Fe0B100 medium (Figure 9B) was dominated by a narrow quadrupole doublet arising from the 57FeII(BPS)3 complex. This doublet, which represented 60% of spectral intensity, was simulated by the dotted line with δ = 0.38 mm/s and ΔEQ = 0.30 mm/s (28). Another 27% of the intensity arose from a NHHS FeIII sextet, and another 10% from NHHS FeII species (with δ = 1.3 mm/s and ΔEQ = 3.0 mm/s). These two minor features are highlighted by removing the dominating FeII(BPS)3 doublet contribution (Figure 9C). The NHHS FeII doublet is simulated by the green line. The sextet in the spectrum of Figure 9C is only ∼ 10% as intense as that in the spectrum of Fe-loaded cells (consistent with it originating from vacuolar NHHS FeIII). We conclude that most (ca. 90%) of the FeIII species associated with the CW of Fe-loaded cells was mobilized. Some of this Fe helped cells grow on Fe-deficient Fe0B100 medium, some formed a complex with BPS, and some remained in solution.
The presence of the 57FeII(BPS)3 doublet in the spectrum of Figure 9B would be easily explained had the cells been grown on BPS medium containing 57Fe. BPS is a membrane-impermeable FeII chelator that turns cells pink due to the formation of FeII(BPS)3 on the CW and/or cell membrane surface (see SI of ref 34). However, the cells used to generate the spectrum of Figure 9B were initially loaded with 57Fe and then transferred to medium that was essentially devoid of Fe (virtually all of the trace endogenous Fe was 56Fe). This demonstrates that the 57Fe used to generate the 57FeII(BPS)3 complex in this sample originated from 57Fe that had been associated with the CW of 57Fe-loaded cells that were used to inoculate the Fe0B100 culture. It also supports our earlier conclusion that Fe-loaded yeast cells can utilize their CW Fe for growth on Fe-deficient medium. Since BPS binds FeII tightly, these results indicate that mobilizing CW FeIII species involves reducing it to the FeII state prior to BPS coordination.
The Fe-loaded cells that barely grew on Fe0B100-NAB medium exhibited a MB spectrum (Figure 9D) that was similar to that of Fe-loaded cells that had been transferred to Fe0B100 medium and harvested after 24 hr. Major spectral components were due to FeII(BPS)3 (48%), NHHS FeIII (24%), and two NHHS FeII species (δ = 1.3 mm/s, ΔEQ = 3.0 mm/s, 10%; δ = 1.1 mm/s and ΔEQ = 3.8 mm/s, 16%; green and maroon lines, respectively, in Figure 9E). The latter two doublets arise from a lack of adenine in the medium (35). Under adenine-deficient conditions, ADE2 mutant strains such as the one used in this study turn pink and accumulate two types of NHHS FeII species called FeIION and FeIIONS. Since adenine was not supplemented in the Fe0B100-NAB medium, the spectra of these cells included these doublets.
MB spectra of Fe-loaded cells that had been incubated for 24 hr in Fe-deficient medium were dominated by the FeII(BPS)3 doublet. We suspect that this complex was adsorbed on the CW. Waste solutions obtained by washing such cells 3 times with EDTA-containing water and then 3 times in DW were pink due to the leaching of FeII(BPS)3 complex from the CW. We calculate that 30% – 40% of the CW Fe was washed away by these rinses. Additional washings were progressively less effective. The FeII(BPS)3 doublet observed in MB spectra arose from FeII(BPS)3 complexes that remained on the CW after such washings.
Iron-starved cells can extract endogenous iron from Fe-deficient growth medium but their growth rate and extent of growth is diminished
Iron-starved cells should not grow as well on Fe-deficient medium as Fe-loaded cells since they lack Fe stores. To test this idea, Fe-starved cells were inoculated into 57Fe1B21 medium, which is essentially Fe-deficient medium but supplemented with a small amount of 57Fe. The cells grew for 15 hr, achieving an OD600 ≈ 1.0. They contained 130 ± 20 μM 57Fe (n = 2) upon harvesting. Although this was a moderate concentration of Fe, these cells were still “Fe-starved” relative to Fe-loaded cells which contain ≥ 4 mM Fe. Similar Fe concentrations have been observed previously in Fe-starved cells (23). In the previous study, MB spectroscopy revealed that the Fe in these cells was mainly in the form of mitochondrial Fe-S clusters and heme centers, with some NHHS FeII ions present but no vacuolar NHHS FeIII species. This makes sense because vacuolar FeIII is a storage form of Fe that is not essential for cell metabolism.
The Fe-starved cells were transferred to Fe0B30 medium such that OD600 was ≈ 0.01 immediately after inoculation. They grew to a final OD600 of 0.8 ± 0.4 (Figure 8A, open circles) at which point they contained just 23 ± 2 μM Fe (Table S2) (n = 2), the lowest cellular Fe concentrations reported for S. cerevisiae. Since Fe-starved cells do not store Fe, these cells did not grow quickly or extensively under Fe-deficient conditions. Their minimal DT (5.7 hours) was longer than that of the Fe-loaded cells, and their ultimate cell density was half of that attained by Fe-loaded cells. The change of OD600 indicated that the Fe-starved cells doubled ∼ 6 times after they were inoculated into Fe0B30, whereas the change of cellular Fe implied that the little Fe initially contained in these cells would only allow ∼ 2.5 doublings. The Fe required for the additional ∼ 3.5 doublings must have originated from the trace endogenous 56Fe in the Fe0B30 medium. In support of this, the 56Fe/57Fe ratio in 57Fe-starved cells was 0.3 before inoculation and 4.4 after harvesting. This increase indicates that the cells imported much of their 56Fe from the Fe0B30 medium (virtually all of the endogenous Fe in that medium was 56Fe). Each growth and division cycle appears to have been associated with the input of ∼ 20 μM 56Fe and ∼ 3 μM 57Fe (Appendix B, Electronic Supplementary Information). This experiment again demonstrates that yeast cells can grow using the tiny amount of Fe present in Fe-deficient BPS-treated medium.
Effect of high concentrations of BPS on the growth of Fe-starved and Fe-loaded cells
To examine the effect of higher concentrations of BPS on cell growth, we prepared Fe-loaded and Fe-starved cells, and then transferred them to Fe0B100 medium which contained 100 μM rather than 30 μM BPS. (We also standardized the incubation time to 5 days for both Fe-loaded and Fe-starved cells.) The Fe-starved cells barely grew on Fe0B100 (minimal DT = 21 hours), attaining a final OD600 of only 0.05 ± 0.02 (Figure 8A, open triangles). The extent of growth implied just 2 doubling. Fe-starved cells that contained 130 ± 30 μM Fe at the time of transfer to Fe0B100 should have contained just ∼ 30 μM Fe after 2 doublings if they exclusively used their own Fe for growth. This estimate (we did not measure this concentration) is reasonable because it is similar to the minimum cellular Fe concentration of S. cerevisiae reported above.
The Fe-loaded cells grew on Fe0B100 medium with a minimal DT (5.1 hours) similar to that of cells grown on Fe0B30 medium. However, the final OD600 of the culture was only 0.79 ± 0.15 (Figure 8A, filled triangles), about half of that attained when Fe-loaded cells were grown on Fe0B30 (Figure 8A, filled circles). Cells that began as Fe-loaded at the time of inoculation contained 110 ± 10 μM Fe after growing 5 days on Fe0B100 medium. This is approximately twice the Fe concentration of equivalent cells that were transferred to Fe0B30 medium and grown to approximately the same stage.
Thus, cells grown on a more extreme Fe-deficient medium grew to half the culture density and contained twice as much Fe as cells grown on less extreme Fe-deficient medium. Why? One could argue that they ran out of endogenous Fe sooner because there was less of it - but if that were the case why didn't they grow on their internal Fe stores?
We hypothesize that the CW iron in Fe-loaded cells is in a form that cannot support growth directly; it must first be mobilized and released into the environment before it can be reimported and used by the cell. Accordingly, BPS short-circuits this mobilization process by intercepting the mobilized Fe before it can be reimported into the cell, with higher concentrations of BPS in the medium more effective in doing this than lower concentrations. We further hypothesize that this Fe mobilization-reimport process requires metabolic energy, and that the cells stopped growing because they lacked the energy needed to drive mobilization. Thus, once CW FeIII is reduced, the FeII becomes available for coordination to BPS for import into the cytosol. BPS at a higher concentration will react faster with mobilized FeII, forming more FeII(BPS)3 which can no longer be reimported into the cytosol or used in metabolism. The metabolic activity of the Fe-starved cells gradually declines, preventing further growth.
Mobilized cell wall iron dissociates into the growth medium
To further assess whether mobilized CW Fe dissociates from the cell and moves into the growth medium, we directly measured Fe in three MM-based media (Fe0B100, Fe0B0, and 56Fe40B0) after each had been inoculated with 57Fe-loaded cells. The first two media lacked added Fe; their endogenous 56Fe and 57Fe concentrations were measured to be 230 nM and 8 nM, respectively. The third medium contained 40 μM of added 56Fe. We used DW as a fourth medium, which contained 43 nM 56Fe and 2 nM 57Fe prior to inoculation. 57Fe-loaded cells were inoculated into each medium to about the same cell density as when they had been harvested. OD600 was then monitored for 24 hr, and then cells were harvested and analyzed by ICP-MS and MB spectroscopy. The concentration of Fe in the media itself was measured at different times during the incubations to obtain direct evidence that Fe dissociates from cells.
Cells in the first three media grew at similar rates and extents (Figure 8C, open squares, solid diamonds and solid squares, respectively), relative to each other and to cells grown in standard 57Fe40B0 medium (Figure 8B, solid squares). In the experiment of Figure 8C, OD600 increased regardless of media (n = 2 for 57Fe40B0; n = 3 for Fe0B100 and n = 3 for Fe0B0). This indicated one cell doubling. The concentration of Fe in the Fe-loaded cells that were incubated in Fe0B100 declined from 3.9 ± 0.7 mM before inoculation to 1.5 ± 0.2 mM thereafter (Table S2), similar to our previous results. There was a similar decline (to 1.2 ± 0.2 mM) in the Fe concentration of the cells incubated in Fe0B0. At face-value, these results suggest that the 57Fe-loaded cells that were incubated in Fe0B100 and Fe0B0 media respectively mobilized about 23% and 40% of their CW Fe into the media during the 24 hr period when they doubled. Cells actually mobilized more Fe because the 57FeII(BPS)3 that adhered to the CW (and was included in the measured cellular [Fe]) originated from FeII that had also been mobilized.
The Fe concentration of 57Fe-loaded cells after growth on 56Fe40B0 medium was 3.1 mM (Table S2, Figure 8C, solid squares), 21% lower than at the time of inoculation. However, since the OD600 doubled, the total amount of Fe in the entire population of cells must have increased by ∼ 52% while the 57Fe portion decreased by ∼ 57%. This indicates that CW 57Fe was mobilized and released as 56Fe was simultaneously imported. Hence, even under Fe-sufficient conditions, metabolically active cells mobilize and import CW Fe while they simultaneously reduce and import environmental Fe.
Metabolically inactive cells placed in DW also lost Fe. The Fe concentration of 57Fe-loaded cells placed in DW for 24 hr decreased by 46% ({Fe3.9 × OD2.2 − Fe2.1 × OD2.2} ÷ {Fe3.9 × OD2.2}) even though the cells barely grew (Figure 8C, open diamonds). We regard this as Fe leaching from the CW rather than metabolic mobilization.
Loss of cellular Fe was confirmed by measuring the Fe concentration in media to which cells had been incubated. 57Fe concentrations in Fe0B100, Fe0B0, and DW media at different times after 57Fe-loaded cells were inoculated are shown in Figure 10A. Prior to incubation, the residual total Fe concentration in Fe0B100 and Fe0B0 media was 0.24 μM (0.008 μM 57Fe) while that in DW was 0.045 μM (0.002 μM 57Fe). The OD600 was 2.1 immediately after 57Fe-loaded cells were added. At different times, cells were removed by centrifugation and the Fe concentration in the medium was measured. Within 15 min of inoculation, the 57Fe concentration in Fe0B100 medium increased to 2 μM (Figure 10A, solid squares). Then the 57Fe concentration decreased, reaching 0.4 μM at 24 hr. The concentration of 56Fe in the medium dropped 0.12 μM over the first 12 hr (Figure 10B, open diamonds). A UV-vis spectrum of 57Fe-loaded cells that had been incubated for 24 hr in Fe0B100 medium showed strong absorption at 535 nm (Figure S1, B vs. A) that reflected FeII(BPS)3 complexes associated with these unwashed cells. A corresponding MB spectrum revealed that > 90% of Fe associated with these cells was 57FeII(BPS)3 (Figure 11D). Much of that 57FeII(BPS)3 complex was removed by washing at high pH (see below, Figure S1, C and D and Figure 11E). We conclude that much of the CW Fe in Fe-loaded cells was mobilized and released into the Fe-deficient medium after which a significant portion bound BPS and adsorbed on the CW.
Figure 10. Iron concentrations in growth medium before and after inoculation with 57Fe-loaded cells.
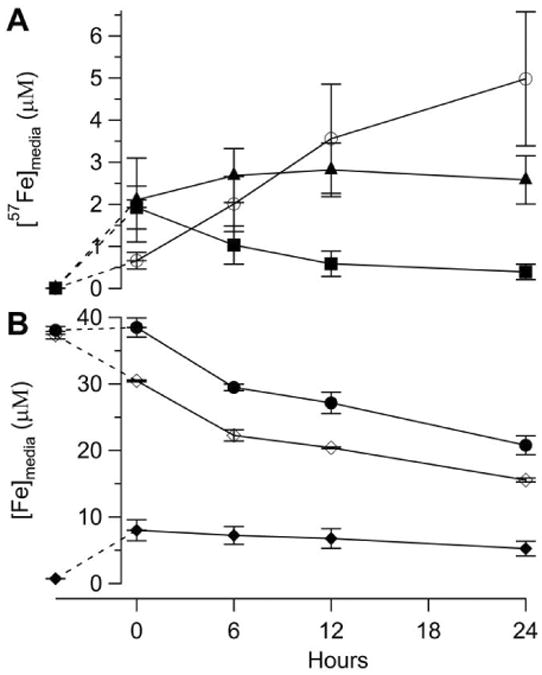
Other results of this experiment are presented in Figure 1C. Panel A, 57Fe concentration in media: Solid squares, medium before and after 57Fe-loaded cells were transferred to Fe0B100 medium. The datum at t < 0 was of medium prior to inoculation. Other data are of the medium 0, 6, 12 and 24 hr after the transfer and after cells were removed by centrifugation. Solid triangles, same but for Fe0B0 medium. Blank circles, same but for DW. Panel B, Fe concentration in 56Fe40B0 medium: Solid circles, total [Fe]; Open diamonds, [56Fe]; Solid diamonds [57Fe].
Figure 11. Whole-cell Mössbauer spectra (5 K, 0.05 T) obtained from the experiment of Figure 8C.
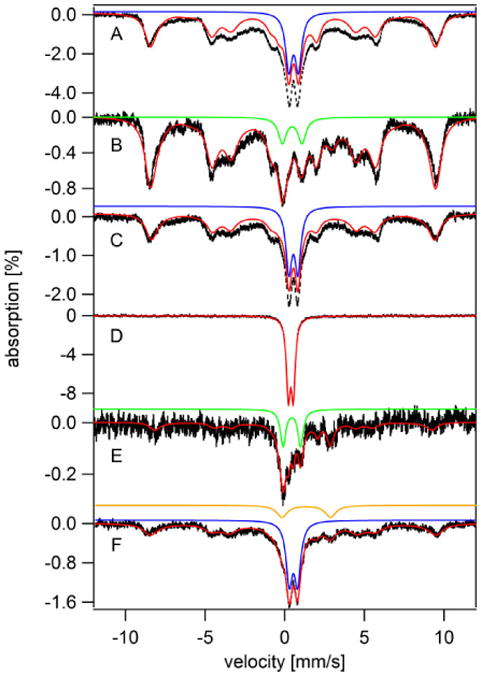
A, 57Fe-loaded cells; B – F, 57Fe-loaded cells after 1 day incubation in the following media: B, Fe0B0; C, DW; D, Fe0B100; E, same as D, but cells were rinsed with 100 mM Tris-HCl buffer (pH 9.4) three times prior to obtaining the spectrum; F, 56Fe40B0. Red and blue lines in A and C are the same as in Figure 9A. The green line in B simulates the CD while the red line is a composite simulation as defined in Table S3. The red line in D simulates the FeII(BPS)3 doublet, the green line in E simulates the CD, and the orange line in F simulates the NHHS FeII doublet.
Whether the mobilized FeII ions were “cleanly” released from the CW and then coordinated by BPS and readsorbed onto the CW, or whether BPS coordinated FeII ions that remained loosely associated with the CW, is unknown. However, at least some of the mobilized Fe was released into the medium as evidenced by direct measurement. The kinetics of this experiment suggest an initial fast mobilization-and-release phase was followed by a slow-release phase that occurred as Fe was reimported into the cells.
For the experiment involving Fe0B0 medium, the concentration of 57Fe in the medium increased to ∼ 2 μM immediately after incubation (Figure 10A, solid triangles), similar to the experiment involving Fe0B100 medium, but it then remained nearly invariant for 24 hr rather than decline. Why the difference? Fe0B0 medium lacks BPS, and so in this medium the exported 57Fe stayed in solution rather than re-associate with the CW. Fe0B0–grown cells contained 1.2 mM Fe while Fe0B100-grown cells contained 1.5 mM Fe due to this association of FeII(BPS)3 with the CW. The 1.5 mM value might underestimate the magnitude of this effect because some FeII(BPS)3 complexes were removed from the CW during rinsing. In the absence of BPS, the mobilized 57Fe ions must have been imported into the cytosol where they were used to support cell growth. The rates of these two processes (CW Fe mobilization and release vs. Fe import into the cytosol) appear to be similar since the concentration of Fe in the medium was largely invariant for 24 hr.
The low-temperature low-field MB spectrum of the corresponding cells after 24 hr incubation (Figure 11B) was dominated by an FeIII sextet along with significant intensity of the central quadrupole doublet that is primarily due to mitochondrial respiratory complexes (green line). The MB spectrum of the original 57Fe-loaded cells used in this experiment (Figure 11A) exhibited an intense sextet and doublet, features which were strongly diminished in spectra of the post-incubation cells. This indicates that 57Fe-loaded cells exported nearly all of their CW FeIII. Some mobilized CW Fe was likely used to synthesize the Fe/S clusters and heme centers giving rise to the central doublet in Figure 11B.
Interpreting the effect of incubating Fe-loaded cells in DW proved to be difficult despite the absence of any cell-growth effects. Consistent with the decrease in cellular Fe, the 57Fe concentration in DW increased gradually (Figure 10A, open circles), indicating that 57Fe had exited the cells that had been placed in water. Consistent with that, the intensity of the corresponding MB spectrum declined (Figure 11C) to about half of that observed for Fe-loaded cells (Figure 11A). Curiously, the components in that spectrum and their relative percentages, before and after incubation in water, were nearly identical. Viewed naively, this would imply that all Fe in the metabolically inactive cells (not just CW Fe) was slowly released in proportion to the amount present. We conclude that metabolically inactive cells “leach” CW Fe but they do not mobilize it in contrast to metabolically reactivating cells.
The overall concentration of Fe in the cells incubated in 56Fe40B0 decreased ∼ 20% after 24 hr of incubation (3.9 mM → 3.1 mM) during which time the cells underwent a single doubling. The 56Fe/57Fe ratio changed from 0.03 to 2.6, indicating both mobilization and release of 57Fe from the CW AND the import of 56Fe from the medium. Initially, [56Fe]1 = 0.1 mM and [57Fe]1 = 3.8 mM (the subscript indicates the generation number) whereas after doubling, [56Fe]2 = 2.2 mM and [57Fe]2 = 0.9 mM. Thus in one doubling the cells increased [56Fe] by 2.1 mM and decreased [57Fe] by 2.9 mM. This may seem like an extremely rapid rate of exchange, but the time required for that doubling event was far longer than takes place under standard exponential growth conditions (24 hr. vs. 2 hr.).
The overall concentration of Fe in the 56Fe40B0 medium declined during the 24 hr incubation (Figure 10B, solid circles), consistent with the import of 56Fe into the cell and with the doubling of cellular content. In 56Fe40B0 medium, the concentration of 56Fe (open diamonds) declined while that of 57Fe (solid diamonds) increased during the initial 15 min, again consistent with the import of 56Fe into the cell and the rapid loss of 57Fe. The total Fe concentration in the medium was invariant during this period, indicating that cellular and environmental Fe ions exchange at roughly equal rates.
The MB spectrum of the 57Fe-enriched cells that had been incubated for 24 hr in 56Fe40B0 medium (Figure 11F) displayed just the 57Fe ions that were retained in the cells (imported 56Fe was MB-invisible and any released 57Fe was no longer associated with the cells). Consistent with a decrease in 57Fe concentration (5.2 → 0.7 mM; Table S2), there was approximately a 5-fold decline in overall spectral intensity. Much of the lost Fe appears to have been CW FeIII species. The spectrum displayed an increase in the NHHS FeII doublet (Figure 11F, orange line) which may represent the reduced form of the mobilized CW FeIII species.
FeII(BPS)3 desorption from the cell wall depends on pH
BPS is a negatively-charged chelator that should be unable to penetrate neutral or negatively charged cell membranes. This property is probably due to the large size of the molecule and to charge-charge repulsion involving negatively charged groups on the yeast CW (4). So why does [FeII(BPS)3]4- adhere to the CW? We hypothesize that it is actually neutral or positively charged at the pH of the medium, which would facilitate CW binding via hydrophobic or electrostatic interactions. The pH of Fe40B0 medium dropped from 4.6 to 3.1 during the 24 hr experiments. The pKa of the sulfonic acid groups on FeII(BPS)3 are 2.83 and 5.20 (36) which implies that a portion of the FeII(BPS)3 molecules should be neutral at the pH of the experiment.
Given these considerations, we endeavored to remove FeII(BPS)3 from the CW by rinsing the pink cells with chilled 100 mM Tris at pH 9.4. At this pH, the complex should be negatively charged and, if our hypothesis is correct, no longer attracted to the CW or plasma membrane. Upon adding the high-pH buffer, the cells turned off-white and the washes turned an intense pink, indicating the large-scale release of the FeII(BPS)3 complex into the buffer (Figure S1, D). UV-vis spectra of the pink and off-white cells confirmed that FeII(BPS)3 had been removed (Figure S1, C vs. B). MB spectra of the equivalent cells showed that most of the FeII(BPS)3 complex was gone; the remaining Fe exhibited features commonly associated with normal yeast cells, such as the central doublet and HS FeII/III features. However, these features were present at low levels (Figure 11 E vs. D, Table S2).
Nonheme high-spin FeII forms transiently during initial stages of cell wall iron mobilization
To investigate the kinetics and mechanism of Fe mobilization from 57Fe-loaded cells after being transferred into Fe0B100 medium, we collected MB spectra of these cells 0, 0.5, 3 and 6 hr after transferring them into Fe0B100 medium. The 0.5 hr spectrum (Figure 12B) exhibited features similar to those of original 57Fe-loaded cells (Figure 12A), except that the NHHS FeII doublet was three-times more intense (see arrow in Figure 12B; Table S3). At that time, the FeII(BPS)3 doublet had barely begun to form (Figure 12B, pink line). At longer times, NHHS FeII and diamagnetic/superparamagnetic FeIII features diminished as the intensity of the FeII(BPS)3 doublet increased (Figures 12C and S2). The NHHS FeIII sextet also decreased, perhaps with a slight delay relative to the other processes (Figure S2, open squares vs. solid circles and squares). The FeII(BPS)3 doublet had reached ∼ 50% of the total intensity by 6 hr (Figure 12D), eventually climbing to ∼ 90% by 24 hr (Figure S2, solid circles). These results demonstrate that an early step in CW Fe mobilization is the formation of NHHS FeII from FeIII CW species, followed by BPS coordination.
Figure 12. Mössbauer spectra (5 K, 0.05 T) of 57Fe-loaded cells before (A) and at increasing times after (B – E) transfer to Fe0B100 medium.
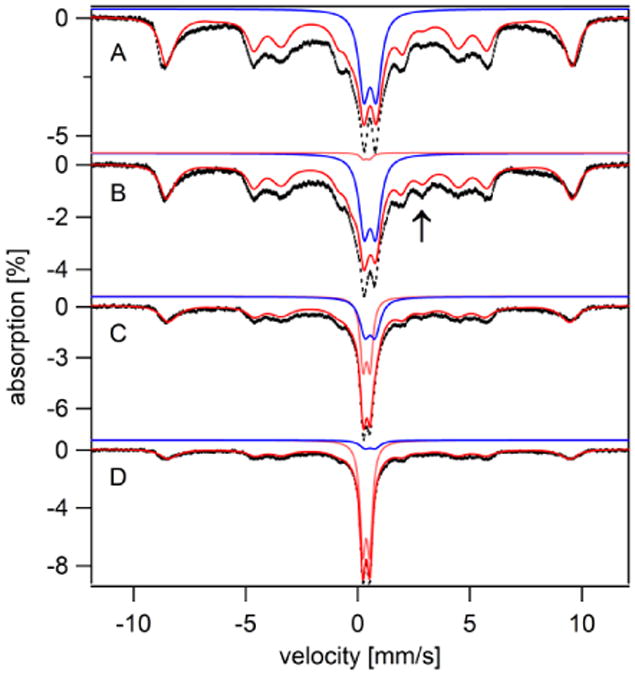
Time after transfer: B, 30 min; C, 3 hr; D, 6 hr. Blue and pink lines are simulations of the FeIII nanoparticle and FeII(BPS)3 quadrupole doublets, respectively. The red lines are composite simulations as defined in Table S3. The arrow in B indicates the position of the high energy line of the NHHS FeII doublet.
The Iron Regulon is not expressed during the accumulation of cell wall iron
We examined the level of Fet3p expression in various media and at different times. In cells grown on Fe0B100, Fet3p was expressed at all times (Figure 13, bottom panel). However, maximal expression was at 12 hr when the cells were growing exponentially (see Figure 8C). As cells entered stationary state, Fet3p expression declined to an extent similar to that observed previously (24). This is consistent with the decreased need for Fe under stationary growth conditions. In the absence of BPS, Fet3p expression was reduced. In 56Fe40B0 medium, cells did not express much Fet3p because Fe was abundant in the medium. In DW, cells did not express Fet3p because they were metabolically inactive. These measurements suggest that the Aft1/2-dependent iron regulon is not expressed under post-exponential conditions when the cell becomes dormant and Fe accumulates in the CW. Iron regulon proteins probably promote CW Fe mobilization via the reductive Fe uptake system.
Figure 13. Western Blot showing Fet3p expression levels in WT cells in various media.
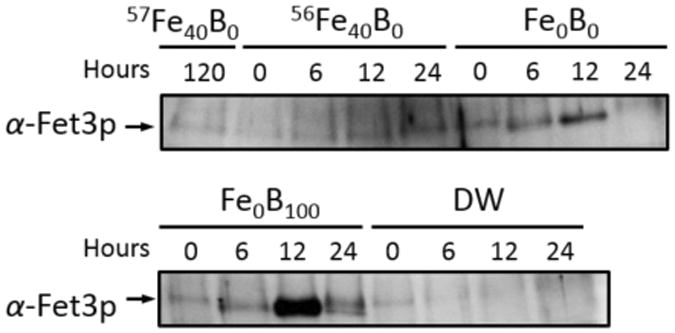
Top panel, Fe-loaded cells transferred to Fe40B0, 56Fe40B0, and Fe0B0 media and harvested at the indicated times (in hr) after the transfer. Bottom panel, same as top panel but with cells transferred to Fe0B100 and DW media.
Conclusions
The major conclusions of this study are summarized in the model of Figure 14. Iron accumulates in the walls of yeast cells that are declining in metabolic activity (transitioning from exponential to post-exponential growth stages). This phenomenon is probably prompted by the lack of certain metabolites (possibly glucose) within the cell. Metal ion accumulation appears specific for Fe in that Cu, Mn, and Zn do not accumulate in the CW. In metabolically dormant cells, CW Fe accounts for ∼ 90% of total cellular Fe; thus, the accumulation of CW Fe represents a huge perturbation of the Fe content of a yeast cell.
Figure 14. Model for iron accumulation into the cell wall.
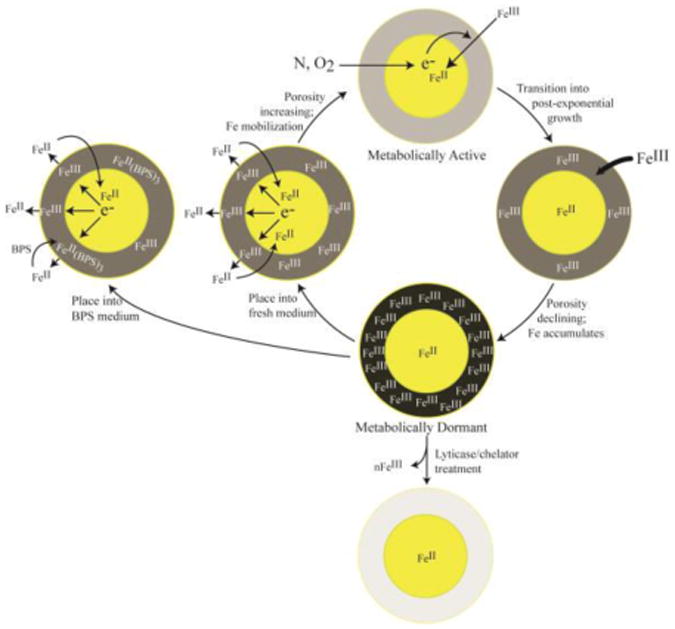
Metabolically active (exponentially-growing) cells do not accumulate Fe in their CWs; FeIII from the environment is reduced by metabolic processes in the cell and it enters the cell as FeII. As cells transition into a post-exponential (or dormant) state, FeIII begins to accumulate in the CW. CW Fe can be removed by chelation or CW digestion. When dormant cells become metabolically active (by placing them into fresh media), the CW FeIII becomes reductively mobilized to the FeII state. The FeII is released from the CW where it can: a) dissociate from the cell and diffuse into the environment; b) enter the cytosol to support cell growth; or c) chelate with BPS (if BPS is in the medium). A significant portion of the neutral FeII(BPS)3 species adsorbs onto the CW.
Our results show that the majority of CW Fe (∼70%) is present as mononuclear NHHS FeIII ions, with modest levels of diamagnetic Fe species (∼ 20%) and even less superparamagnetic FeIII oxyhydroxide nanoparticles (∼10%). It is tempting to speculate that Fe initially accumulates as magnetically isolated mononuclear FeIII species, then as Fe accumulates to a higher density, magnetic interactions develop that give rise to the diamagnetic and finally superparamagnetic species. The CW contains a large number of negatively charged phosphodiester bridges in both N- and O-carbohydrate side chains that anchor the protein to the CW (37). Fe coordinates other phosphodiester species (38) suggesting this mode of binding. FeIII may bind to various sites in the CW (39). Bound Fe may also serve to stabilize the CW structure.
When dormant cells reactivate, CW FeIII species become mobilized regardless of the Fe concentration in the growth medium. Mobilization involves reduction to the FeII state probably via a reaction catalyzed by surface ferric reductases (40). CW Fe may dissociate even when not reduced to FeII, but this is a different phenomenon that we call leaching. The reducing equivalents used for mobilization must originate from the metabolic activity of the cell (41). Mobilized FeII is released from the CW; some is imported into the cytosol for cell growth and some remains in the environment. Thus, CW Fe becomes available as dormant cells awaken. If chelators such as BPS or EDTA are present in the environment, they will also coordinate mobilized FeII. Metabolically active cells can also import trace amounts of endogenous forms of Fe in Fe-deficient (BPS-treated) growth media. The cell does not discriminate strongly in its source of imported Fe - it simultaneously imports mobilized CW Fe AND endogenous Fe from the medium. Given the scarcity of bioavailable Fe in the environment, the CW Fe accumulation-mobilization-re-importation process would have provided a selective advantage during evolution.
Our results demonstrate that the CW should be regarded as a second storage compartment for Fe in S. cerevisiae and probably in other fungal cells. Its function in this regard is distinct from that of vacuoles; vacuolar Fe maintains intracellular homeostasis which allows metabolically active cells to survive in Fe-poor environments and it also sequesters potentially toxic forms of Fe. CW Fe helps reactivate dormant cells, by providing Fe regardless of the availability of Fe in the environment. Given the large extent of Fe accumulation, the CW should be regarded, along with mitochondria and vacuoles, as a major iron traffic “hub” in yeast.
During exponential growth, the reductive Fe uptake system controlled by the Aft1/2-dependent iron regulon may reduce bound FeIII such that the Fe could be imported and not accumulate in the CW. After the cell enters post-exponential growth, the iron regulon is shut down and CW bound Fe cannot be reductively mobilized; thus it accumulates. The Fit genes are part of the iron regulon, and so their expression should also decline. If the Fit proteins facilitate passage of Fe across the CW and into the cytosol, we would expect that Fe should accumulate during post-exponential growth, as is observed. Conflicting with this expectation is the observed decline in CW Fe in mutant strains lacking Fit proteins (17). Further studies are needed to reconcile this situation.
One practical ramification of our study is that researchers who measure Fe concentrations of whole fungal cells should not grow cells beyond exponential phase, because the dominating contribution of CW Fe to the total cellular Fe could cause confusion. One should also be cautious in using BPS to generate Fe-deficient conditions. Doing so creates an Fe deficiency severe enough to turn-on the iron regulon (42, 43) but not severe enough to fully abolish growth. Amazingly, yeast cells can import trace endogenous Fe from such media and use it for growth.
Other fungal cells besides S. cerevisiae have CWs, and some connections with iron metabolism have been reported. Vainshtein et al. identified Fe nanoparticles in the CW of the pathogenic fungus Cryptococcus humicola (16). Cir1, the “master iron regulator” in the pathogen Cryptococcus neoformans, regulates CW biogenesis and other virulence factors (44). The polysaccharide capsule of these cells is a major virulence factor, and capsule production is enhanced under Fe-limiting conditions (8). In Candida glabrata, CW proteins CgCcw14 and CgMam3 are “pivotal virulence determinants” that are involved in iron metabolism (45). CgCcw14 is a cysteine-rich glycosylphosphatidylinositol-linked CW protein while CgMam3 is a putative hemolysin. Ferric reductase Cfl1 in Candida albicans is involved in CW integrity, morphogenesis, virulence and invasion into host cells (10). Mutant cells lacking Cfl1 overload with Fe, but whether the Fe accumulates in the CW or elsewhere was not investigated (11). We suspect that the CW Fe accumulation phenomenon discovered here is a general property of fungi, and that it promotes their survival. If so, inhibiting CW Fe may diminish the ability of pathogenic fungi to survive in a host (7). Deleting the Fet3 ferroxidases on the plasma membrane of pathogenic fungus Colletotrichum graminicola caused an 80% decline in chitin synthase and defects in the CW that reduced virulence. These proteins are part of the reductive iron import system which is required for CW integrity/stability and pathogenic fungal virulence; indeed the ability to import Fe is considered a “key factor for pathogenicity”. Future studies should investigate whether pathogenicity is related to the ability of the CW to accumulate and/or mobilize Fe as such investigations may lead to improved treatments for fungal pathologies.
Supplementary Material
Electronic Supplementary Information: Table S1: Media composition; Table S2: Final OD600 and final Fe concentration of cells harvested during media switch experiments; Appendix A: RMSD considerations; Appendix B: propagation of iron concentrations with divisions; Table S3: MB spectral decompositions; Figure S1: UV-Vis spectra of FeII(BPS)3 solution and whole yeast cells; Figure S2: changes in percentages of Fe species found in MB spectra of 57Fe40B0 cells transferred to Fe0B100 medium.
Significance to Metallomics.
Fungal cells such as yeast contain a cell wall that plays important cellular functions and is responsible for the virulence of pathogenic fungi. We report here that the cell wall accumulates massive amounts of iron when cells become metabolically inactive. Cell wall iron is found mainly as magnetically isolated FeIII ions. When such cells become metabolically reactivated, the cell wall FeIII becomes reduced to FeII and released from the wall. Once mobilized in this way, the FeII ions can be imported into the cell and used for growth.
Acknowledgments
We thank Brad Pierce (University of Texas at Arlington) for kindly allowing us to use his EPR spectrometer, Andrew Dancis (University of Pennsylvania) for generously providing the Fet3 antibody, and Charles Johnson (University of Tennessee) for help in analyzing Mössbauer spectra. The National Institutes of Health (GM084266) and the Robert A. Welch Foundation (A1170) sponsored this study.
Abbreviations
- ANU
arbitrary nutrient units
- BPS
bathophenanthroline disulfonate
- CellA
active cells in the math model
- CellD
dormant cells in the math model
- CD
Central doublet representing [Fe4S4]2+ clusters and LS FeII heme centers, mainly located in mitochondria
- CW
cell wall
- DT
doubling time
- DW
sterile deionized water
- EDTA
ethylenediaminetetraacetate
- EGTA
ethylene glycol tetraacetate
- 57Fe40B0
MM with 40 μM 57FeIII citrate
- 56Fe40B0
same but with 56FeIII citrate
- 57Fe1B21
MM with 1 μM 57FeIII citrate and 21 μM BPS
- Fe0B30
MM with 30 μM BPS
- Fe0B100
MM with 100 μM BPS
- Fe0B0
MM
- Fe0B100-NAB
MM with 100 μM BPS but no amino acids or bases
- GPI
β-1,6-glucan glycosylphosphatidylinositol
- ICP-MS
inductively coupled plasma mass spectrometer or spectrometry
- LS
low-spin
- MB
Mössbauer
- MM
minimal medium
- N
nutrient component in the math model
- NHHS
nonheme high-spin
- OD600
optical density at 600 nm
- ODE
ordinary differential equation
- RMSD
root-mean-square deviation
- SP
sorbitol-phosphate
- TEM
transmission electron microscopy
- YPAD
same as YPD but with 100 μM added adenine
- YPD
yeast extract, peptide and dextrose medium
Footnotes
Footnote 1: If all of the 57Fe in these cells were released into the medium, the final 57Fe concentration in the medium would have been ∼ 80 nM. At an OD600 = 1.0, 250 mL of cell culture packs into a volume of ∼ 700 μL, which suggests that cultures with OD600 = 0.01 should pack into a volume of ∼ 7 μL. Assuming a packing efficiency of 0.7, this corresponds to ∼ 5 μL of cells. The concentration of Fe in this volume of 4.1 mM Fe, if diluted into 250 mL, would be ∼ 80 nM. The endogenous concentration of 56Fe in Fe0B0 medium was 0.3 ± 0.2 μM (n = 3).
References
- 1.Lesage G, Bussey H. Cell wall assembly in Saccharomyces cerevisiae. Microbiol and Mol Biol Rev. 2006;70:317–343. doi: 10.1128/MMBR.00038-05. [DOI] [PMC free article] [PubMed] [Google Scholar]
- 2.De Nobel JG, Klis FM, Priem J, Munnik T, VanDenEnde H. The gluconase-soluble mannoproteins limit cell wall porosity in Saccharomyces cerevisiae. Yeast. 1990;6:491–499. doi: 10.1002/yea.320060606. [DOI] [PubMed] [Google Scholar]
- 3.DeGroot PWJ, Ram AF, Klis FM. Features and functions of covalently linked proteins in fungal cell walls. Fungal Genet Biol. 2005;42:657–675. doi: 10.1016/j.fgb.2005.04.002. [DOI] [PubMed] [Google Scholar]
- 4.Klis FM, de Jong M, Brul S, de Groot PWJ. Extraction of cell surface-associated proteins from living yeast cells. Yeast. 2007;24:253–258. doi: 10.1002/yea.1476. [DOI] [PubMed] [Google Scholar]
- 5.DeGroot PWJ, Ruiz C, Vazquez de Aldana CR, Euienas E, Cid VJ, Del Rey F, et al. A genomic approach for the identification and classification of genes involved in cell wall formation and its regulation in Saccharomyces cerevisiae. Comp Funct Genomics. 2001;2:124–142. doi: 10.1002/cfg.85. [DOI] [PMC free article] [PubMed] [Google Scholar]
- 6.Klis FM, Boorsma A, DeGroot PWJ. Cell wall construction in Saccharomyces cerevisiae, Yeast. 2006;23:185–202. doi: 10.1002/yea.1349. [DOI] [PubMed] [Google Scholar]
- 7.Albarouki E, Deising HB. Infection structure-specific reductive iron assimilation is required for cell wall integrity and full virulence of the maize pathogen Colletotrichum graminicola. Mol Plant-Microbe Interact. 2013;26:695–708. doi: 10.1094/MPMI-01-13-0003-R. [DOI] [PubMed] [Google Scholar]
- 8.Vartivarian SE, Anaissie EJ, Cowart RE, Sprigg HA, Tingler MJ, Jacobson ES. Regulation of cryptococcal capsular polysaccharide by iron. J of Infect Dis. 1993;167:186–190. doi: 10.1093/infdis/167.1.186. [DOI] [PubMed] [Google Scholar]
- 9.Srivastava VK, Suneetha KJ, Kaur R. A systematic analysis reveals an essential role of high-affinity iron uptake system, haemolysin and CFEM domain-containing protein in iron homoeostasis and virulence in Candida glabrata. Biochem J. 2014;463:103–114. doi: 10.1042/BJ20140598. [DOI] [PubMed] [Google Scholar]
- 10.Yu Q, Dong Y, Xu N, Qian K, Chen Y, Zhang B, Xing L, Li M. A novel role of the ferric reductase Cfl1 in cell wall integrity, mitochondrial function, and invasion to host cells in Candida albicans. FEMS Yeast Res. 2014;14:1037–1047. doi: 10.1111/1567-1364.12194. [DOI] [PubMed] [Google Scholar]
- 11.Xu N, Qian K, Dong Y, Chen Y, Yu Q, Zhang B, Xing L, Li M. Novel role of the Candida albicans ferric reductase gene CFL1 in iron acquisition, oxidative stress tolerance, morphogenesis and virulence. Res Microbiol. 2014;165:252–261. doi: 10.1016/j.resmic.2014.03.001. [DOI] [PubMed] [Google Scholar]
- 12.Fleet GH, Phaff HJ. Ultrastructure of the Cell-Wall of Schizosaccharomyces pombe following treatment with various gluconases. J Structural Biol. 1995;114:140–152. doi: 10.1006/jsbi.1995.1013. [DOI] [PubMed] [Google Scholar]
- 13.Cabib E, Drgon T, Drgonova J, Ford RA, Kollar R. The yeast cell wall, a dynamic structure engaged in growth and morphogenesis. Biochem Soc Trans. 1997;25:200–204. doi: 10.1042/bst0250200. [DOI] [PubMed] [Google Scholar]
- 14.Goldman RC, Branstrom A. Targeting cell wall synthesis and assembly in microbes: similarities and contrasts between bacteria and fungi. Curr Pharmaceutical Design. 1999;5:473–501. [PubMed] [Google Scholar]
- 15.Orlean P. Biogenesis of yeast wall and surface components. In: Pringle JR, Broach JR, Jones EW, editors. The molecular and cellular biology of the yeast Saccharomyces Vol 3 Cell cycle and cell biology Cold Spring Harbor Monograph series. Vol. 21. 1997. pp. 229–362. [Google Scholar]
- 16.Vainshtein M, Belova N, Kulakovskaya T, Suzina N, Sorokin V. Synthesis of magneto-sensitive iron-containing nanoparticle by yeasts. J Ind Microbiol Biotechnol. 2014;41:657–663. doi: 10.1007/s10295-014-1417-4. [DOI] [PubMed] [Google Scholar]
- 17.Protchenko O, Ferea T, Rashford J, Tiedeman J, Brown PO, Botstein D, Philpott CC. Three cell wall mannoproteins facilitate the uptake of iron in Saccharomyces cerevisiae. J Biol Chem. 2001;276:49244–49250. doi: 10.1074/jbc.M109220200. [DOI] [PubMed] [Google Scholar]
- 18.Scott JH, Schekman R. Lyticase – endoglucanase and protease activities that act together in yeast cell lysis. J Bacteriol. 1980;142:414–423. doi: 10.1128/jb.142.2.414-423.1980. [DOI] [PMC free article] [PubMed] [Google Scholar]
- 19.Chojnacka K. Biosorption and bioaccumulation – the prospects for practical applications. Environment Internatl. 2010;36:299–307. doi: 10.1016/j.envint.2009.12.001. [DOI] [PubMed] [Google Scholar]
- 20.Outten CE, Albetel AN. Iron sensing and regulation in Saccharomyces cerevisiae: ironing out the mechanistic details. Curr Opin Microbiol. 2013;16:662–668. doi: 10.1016/j.mib.2013.07.020. [DOI] [PMC free article] [PubMed] [Google Scholar]
- 21.Lill R, Hoffmann B, Molik S, Pierik AJ, Rietzschei N, Stehling O, Uzarska MA, Webert H, Wibrecht C, Mühlenhoff U. The role of mitochondria in cellular iron-sulfur protein biogenesis and iron metabolism. Biochim Biophys Acta. 2012;1823:1491–1508. doi: 10.1016/j.bbamcr.2012.05.009. [DOI] [PubMed] [Google Scholar]
- 22.Li L, Miao R, Bertram S, Jia X, Ward DM, Kaplan J. A role for iron-sulfur clusters in the regulation of transcription factor yap5-dependent high iron transcriptional responses in yeast. J Biol Chem. 2012;287:35709–35721. doi: 10.1074/jbc.M112.395533. [DOI] [PMC free article] [PubMed] [Google Scholar]
- 23.Holmes-Hampton GP, Jhurry ND, McCormick SP, Lindahl PA. Iron content of Saccharomyces cerevisiae cells grown under iron-deficient and iron-overload conditions. Biochemistry. 2013;52:105–114. doi: 10.1021/bi3015339. [DOI] [PMC free article] [PubMed] [Google Scholar]
- 24.Park J, McCormick SP, Chakrabarti M, Lindahl PA. The lack of synchronization between iron uptake and cell growth leads to iron overload in Saccharomyces cerevisiae during post-exponential growth modes. Biochemistry. 2013;52:9413–9425. doi: 10.1021/bi4010304. [DOI] [PMC free article] [PubMed] [Google Scholar]
- 25.Park J, McCormick SP, Chakrabarti M, Lindahl PA. Insights into the iron-ome and manganese-ome of Δmtm1 Saccharomyces cerevisiae mitochondria. Metallomics. 2013;5:656–672. doi: 10.1039/c3mt00041a. [DOI] [PMC free article] [PubMed] [Google Scholar]
- 26.Lindahl PA, Morales JG, Miao R, Holmes-Hampton GP. Isolation of Saccharomyces cerevisiae Mitochondria for Mössbauer, EPR and Electronic Absorption Spectroscopic Analyses. Meth Enzymol. 2009;456, Ch. 15:268–286. doi: 10.1016/S0076-6879(08)04415-7. [DOI] [PubMed] [Google Scholar]
- 27.Miao R, Holmes-Hampton GP, Lindahl PA. Biophysical investigation of the iron in Aft1-1(up) and Gal-Yah1 Saccharomyces cerevisiae. Biochemistry. 2011;50:2660–2671. doi: 10.1021/bi102015s. [DOI] [PMC free article] [PubMed] [Google Scholar]
- 28.Holmes-Hampton GP, Miao R, Morales JG, Guo Y, Münck E, Lindahl PA. A nonheme high-spin ferrous pool in mitochondria isolated from fermenting Saccharomyces cerevisiae. Biochemistry. 2010;49:4227–4234. doi: 10.1021/bi1001823. [DOI] [PMC free article] [PubMed] [Google Scholar]
- 29.Preoteasa EA, Schianchi G, Giori DC. EPR detection of possible superparamagnetic polyiron nanoparticles and free radicals in the blood serum of patients with homozygous β-thalassemia. Appl Magn Reson. 2014;45:537–571. [Google Scholar]
- 30.Miao R, Martino M, Morales JG, Kim H, Ellis EA, Lill R, Hendrich MP, Münck E, Lindahl PA. EPR and Mössbauer spectroscopy of intact mitochondria isolated from Yah1p-depleted Saccharomyces cerevisiae. Biochemistry. 2008;47:9888–9899. doi: 10.1021/bi801047q. [DOI] [PubMed] [Google Scholar]
- 31.Miao R, Kim H, Koppolu UMK, Ellis EA, Scott RA, Lindahl PA. Biophysical characterization of the iron in mitochondria from Atm1p-depleted Saccharomyces cerevisiae. Biochemistry. 2009;48:9556–9568. doi: 10.1021/bi901110n. [DOI] [PMC free article] [PubMed] [Google Scholar]
- 32.Wofford JD, Lindahl PA. Mitochondrial iron-sulfur-cluster activity and cytosolic iron regulate iron traffic in Saccharomyces cerevisiae. J Biol Chem. 2015;290:26968–26977. doi: 10.1074/jbc.M115.676668. [DOI] [PMC free article] [PubMed] [Google Scholar]
- 33.Cockrell AL, Holmes-Hampton GP, McCormick SP, Chakrabarti M, Lindahl PA. Mössbauer and EPR study of iron in vacuoles from fermenting Saccharomyces cerevisiae. Biochemistry. 2011;50:10275–10283. doi: 10.1021/bi2014954. [DOI] [PMC free article] [PubMed] [Google Scholar]
- 34.Homann OR, Dea J, Noble SM, Johnson AD. A phenotypic profile of the Candida albicans regulatory network. PLOS Genetics. 2009;5:1–12. doi: 10.1371/journal.pgen.1000783. [DOI] [PMC free article] [PubMed] [Google Scholar]
- 35.Park J, McCormick SP, Cockrell AL, Chakrabarti M, Lindahl PA. High-spin ferric ions in Saccharomyces cerevisiae vacuoles are reduced to the ferrous state during adenine-precursor detoxification. Biochemistry. 2014;53:3940–3951. doi: 10.1021/bi500148y. [DOI] [PMC free article] [PubMed] [Google Scholar]
- 36.Blair D, Diehl H. Bathophenanthrolinedisulphonic acid and bathocuproinedisulfphonic acid, water soluble reagents for iron and copper. Talanta. 1961;7:163–174. [Google Scholar]
- 37.Kapteyn JC, Montijn RC, Vink E, delaCruz J, Llobell A, Douwes JE, Shimoi H, Lipke PN, Klis FM. Retention of Saccharomyces cerevisiae cell wall proteins through a phosophodiester-linked beta-1,3-/beta-1,6-glucan heteropolymer. Glycobiology. 1996;6:337–345. doi: 10.1093/glycob/6.3.337. [DOI] [PubMed] [Google Scholar]
- 38.Omoike A, Chorover J, Kwon KD, Kubicki JD. Adhesion of bacterial expolymers to alpha-FeOOH: Inner sphere complexation of phosphodiester groups. Langmur. 2004;20:11108–11114. doi: 10.1021/la048597+. [DOI] [PubMed] [Google Scholar]
- 39.Lesuisse E, Raguzzi F, Crichton RR. Iron uptake by the yeast Saccharomyces cerevisiae – involvement of a reduction step. J Gen Microbiol. 1987;133:3229–3236. doi: 10.1099/00221287-133-11-3229. [DOI] [PubMed] [Google Scholar]
- 40.Kosman DJ. Redox cycling in iron uptake, efflux and trafficking. J Biol Chem. 2010;285:26729–26735. doi: 10.1074/jbc.R110.113217. [DOI] [PMC free article] [PubMed] [Google Scholar]
- 41.Hughes AL, Gottschling DE. An early age increase in vacuolar pH limits mitochondrial function and lifespan in yeast. Nature. 2012;492:261–265. doi: 10.1038/nature11654. [DOI] [PMC free article] [PubMed] [Google Scholar]
- 42.Yamaguchi-Iwai Y, Dancis A, Klausner RD. AFT1: a mediator of iron regulated transcriptional control in Saccharomyces cerevisiae. EMBO J. 1995;14:1231–1239. doi: 10.1002/j.1460-2075.1995.tb07106.x. [DOI] [PMC free article] [PubMed] [Google Scholar]
- 43.Hassett RF, Romeo AM, Kosman DJ. Regulation of high affinity iron uptake in the yeast Saccharomyces cerevisiae – role of dioxygen and Fe(II) J Biol Chem. 1998;273:7628–7636. doi: 10.1074/jbc.273.13.7628. [DOI] [PubMed] [Google Scholar]
- 44.Kronstad JW, Hu G, Jung WH. An encapsulation of iron homeostasis and virulence in Cryptococcus neoformans. Trends Microbiol. 2013;21:457–465. doi: 10.1016/j.tim.2013.05.007. [DOI] [PMC free article] [PubMed] [Google Scholar]
- 45.Srivastava VK, Suneetha KJ, Kaur R. A systematic analysis reveals an essential role for high-affinity iron uptake system, haemolysin and CFEM domain-containing protein in iron homoeostasis and virulence in Candida glabrata. Biochem J. 2014;463:103–114. doi: 10.1042/BJ20140598. [DOI] [PubMed] [Google Scholar]
Associated Data
This section collects any data citations, data availability statements, or supplementary materials included in this article.
Supplementary Materials
Electronic Supplementary Information: Table S1: Media composition; Table S2: Final OD600 and final Fe concentration of cells harvested during media switch experiments; Appendix A: RMSD considerations; Appendix B: propagation of iron concentrations with divisions; Table S3: MB spectral decompositions; Figure S1: UV-Vis spectra of FeII(BPS)3 solution and whole yeast cells; Figure S2: changes in percentages of Fe species found in MB spectra of 57Fe40B0 cells transferred to Fe0B100 medium.