

Abstract
Objective
To examine the association between demographic characteristics and long-term smoking trajectory group membership among HIV-seropositive and HIV-seronegative men who have sex with men (MSM).
Methods
A cohort of 6,552 MSM from the Multicenter AIDS Cohort Study (MACS) were asked detailed information about their smoking history since their last follow-up. Group-based trajectory modeling was used to examine smoking behavior and identify trajectory group membership. Because participants enrolled after 2001 were more likely to be younger, HIV-seronegative, non-Hispanic black, and have a high school diploma or less, we also assessed time of enrollment in our analysis.
Results
Participants were grouped into 4 distinct smoking trajectory groups: persistent nonsmoker (n=3,737 [55.9%]), persistent light smoker (n=663 [11.0%]), heavy smoker to nonsmoker (n=531 [10.0%]), and persistent heavy smoker (n=1,604 [23.1%]). Compared with persistent nonsmokers, persistent heavy smokers were associated with being enrolled in 2001 and later (adjusted odds ratio [aOR], 2.35; 95% CI, 2.12-2.58), having a high school diploma or less (aOR, 3.22; 95% CI, 3.05-3.39), and being HIV-seropositive (aOR, 1.17; 95% CI, 1.01-1.34). These associations were statistically significant across all trajectory groups for time of enrollment and education but not for HIV serostatus.
Conclusions
The overall decrease of smoking as shown by our trajectory groups is consistent with the national trend. Characteristics associated with smoking group trajectory membership should be considered in the development of targeted smoking cessation interventions among MSM and people living with HIV.
Introduction
The prevalence of current smoking among persons living with HIV (PLWH) has been estimated to be over 40%, more than 20% greater than the smoking rate in the US general population [1-6]. PLWH who smoke have an average of 16 to 23 cigarettes per day, an indicator of high nicotine dependence [7]. Studies from the 1990s suggest that smoking rates in men who have sex with men (MSM) were high—ranging from 45% to 49% [8, 9]. Because of a history of exclusion and discrimination in other social settings, the social focus for many MSM has been gay-identified bars and clubs, where the prevalence of smoking is thought to be high [10]. Recent data from the National Health Interview Survey suggest that the current prevalence of smoking has dramatically shifted: 27.2% of gay men between the ages of 16 to 64 were current smokers compared with 22.3% of straight men of the same age group [11]. However, it is not clear whether the lower rate of smoking today reflects that MSM are less likely to smoke or more likely to quit smoking or whether they failed to initiate smoking. This rate likely reflects responses of MSM as a group to progressive public health policies regulating tobacco sales and use.
Although the use of antiretroviral therapy (ART) has dramatically reduced HIV-related morbidity and mortality, HIV-seropositive individuals are now reaching ages at which smoking-related disease rapidly increases [12]. Studies assessing smoking in PLWH are similar to research from the general population, showing that smoking is a risk factor for coronary artery disease, myocardial infarction, lung cancer, and stroke [3, 4, 13-15]. Among PLWH, Petoumenos et al. found that among those who stopped smoking, the odds ratio for the risk of cardiovascular disease (CVD) decreased from 2.3 within the first year of stopping to 1.5 after more than 3 years.
Little is known about long-term smoking patterns among PLWH and MSM. Most studies have categorized participants' smoking habits as current, former, or never smokers. We recently assessed long-term smoking using current, former, or never smokers [16]. We found that smoking remained high among certain subgroups of MSM, but we also found that categorization does not capture duration or intensity of smoking throughout participants' lifetimes. A measure such as pack-years does quantify duration and intensity; however, it does not capture the fluctuations in lifetime smoking that can be observed among those who quit or decrease cigarette smoking. The use of long-term patterns of smoking provides a longitudinal measure that can be compared across different groups of interest.
Given the study gaps described above, we constructed and characterized multiple long-term trajectories of cigarette smoking among HIV-positive and HIV-negative MSM. We assessed whether HIV serostatus was associated with trajectory group membership. Finally, we analyzed multiple trajectories among HIV-positive MSM, and examined how these trajectories varied by HIV-specific time-variant covariates. We used data derived from an ongoing longitudinal study with repeated measures over a period of 28 years. Dynamic models with both time-constant and time-varying covariates were used to evaluate differences in trajectories of cigarette smoking.
Methods
Study Population
The Multicenter AIDS Cohort Study (MACS) is an ongoing prospective cohort study of the natural and treated histories of HIV infection among MSM in the United States [16, 17]. A total of 6,972 men were recruited at 4 centers: Baltimore/Washington, DC; Chicago; Los Angeles; and Pittsburgh. Men were recruited in 3 waves: 4,954 in 1984-1985, 668 in 1987-1991, and 1,350 in 2001-2003. MACS participants complete study visits every 6 months during which they are tested for HIV (if HIV-seronegative), provide a blood sample for storage in a repository for future research, undergo a physical examination, and complete questionnaires, which collect demographic, psychosocial, behavioral, medical history, and health services data. The questionnaires are available online at http://www.statepi.jhsph.edu/macs/forms.html. Informed consent was obtained from all participants, and the MACS study protocol was approved by the institutional review boards of each of the participating centers.
Participants in MACS return biannually for detailed interviews, physical examinations, collection of blood, and laboratory testing. At each study visit, the men are asked detailed information about their smoking history since their previous visit. This present study uses a prospective cohort design to examine the association between demographic characteristics with self-reported smoking trajectories. We used data from all 3 waves because smoking behavior was captured since each participant's initial visit. This analysis follows cigarette consumption from semiannual visits 1 through 57 of the MACS. The study sample included 6,535 men who reported their smoking behavior during their initial visit and at least 1 follow-up visit. The median person-years in the study was 9.6 years (interquartile range, 5.4-18.5 years).
Main Outcome Measure
At each visit, current smoking status was assessed as part of the study questionnaires. Participants were classified as never, former, and current smokers at each visit. These questions include “Did you ever smoke cigarettes?” and “Do you smoke cigarettes now?” The latter question was used to assess current smoking. Quantity of cigarette packs smoked were categorized by the MACS as follows: less than ½ pack per day; at least ½ but less than 1 pack per day; at least 1 but less than 2 packs per day; and 2 or more packs per day. Using these measures, we constructed 4 long-term trajectories.
Covariates of Interest
We examined the following characteristics measured at the index visit in our analysis: age, race (indicated by 2 dummy variables, race included 3 categories: non-Hispanic black, other, and non-Hispanic white [reference group]), and education (indexed by high school diploma or less and having some college or more [reference group])[18]. Because participants enrolled after 2001 were more likely to be younger, HIV-seronegative, black non-Hispanic, and have a high school diploma or less, we also assessed time of enrollment in our analysis.
When studying health trajectories over an extended period of observations, many of the covariates can change over time. Therefore, we conducted additional analyses by incorporating time-varying covariates. In our analysis, a number of covariates (alcohol use, marijuana use, CD4 cell count, viral load, and ART use) could vary with time [19, 20]. Finally, we constructed a binary variable to identify those who had died (n=2124), were censored (those removed from the study in order to recruit new participants), or who dropped out (n=2527) of the study during the period of observation and were included in our model. These measures were treated as confounding variables instead of predictors in our model to assess the degree to which the findings depend on a participant's missing data pattern [21].
Data Analysis
We used group-based, semiparametric mixture models to identify 4 distinct trajectories of smoking among participants in the MACS, using the SAS PROC TRAJ program developed by Nagin and colleagues [22]. PROC TRAJ uses maximum likelihood estimation and yields parameter estimates that define (a) trajectory shape and (b) trajectory group membership probabilities. The 2-stage model selection process described by Nagin and colleagues was used to define the optimal number of trajectory groups and the order of the polynomial needed to model the shape of each trajectory. A preset rule that all trajectories are linear was used to structure the first-stage search, and a zero-inflated Poisson model was specified for the amount smoked per visit. The optimal number of latent trajectory classes was determined by: (1) using the Bayes factor approximation to compare the difference in the Bayesian information criterion (BIC) scores between competing models [23]; (2) calculating the average posterior probabilities for each class; and (3) assessing the utility of the latent classes in practice, including the similarity of trajectories between classes and the number of cases within each trajectory class.
To identify the distinct trajectories of cigarette smoking, we explored various models including intercept only and linear, quadratic, or cubic functions of time. Although a linear function may be sufficient in describing some trajectories, we chose to apply a quadratic function for some of the groups. Given the number of repeated observations available, the quadratic functions are more flexible in identifying the distinct trajectories. On the basis of changes in the BIC score as the number of trajectory groups increased from 2 to 10 and whether there was any overlap between the confidence intervals of adjacent trajectories, we chose 4 groups because the improvement in BIC began to level off after 4 groups.
To first understand smoking behavior among our participants, we derived the basic trajectory groups by estimating a model in which smoking is a function of time only by time of enrollment, without any other covariates. Second, we evaluated baseline characteristics and time-varying covariates in the probabilities of belonging to the identified trajectories among all participants of the study. We repeated this same process among HIV-positive MSM to adjust for HIV-specific time-varying covariates. This allowed for joint estimation of the parameters that describe the shape of trajectory group curves and adjusted odds ratios (aORs) for the relationship between the covariates of interest and trajectory group membership. We used the joint estimation process because it yields standard errors that account for the uncertainty of group assignments. To further confirm our results we used generalized linear mixed models (PROC GLIMMIX). Each trajectory was a separate outcome, and the trajectory group that smoked the least was treated as the reference group. Only the intercept was allowed to vary between subjects, and the regression slopes were assumed to be fixed effects.
Results
Men in the study were grouped into 1 of 4 distinct smoking trajectory groups. Based on the trajectory models, we classified light smoking as less than ½ pack per day (on average), and heavy smoking as greater than ½ pack per day (on average). The 4 patterns were:
Persistent nonsmoker: Accounting for 55.9% (n=3,737) of all participants, persistent nonsmokers were characterized by nearly zero packs smoked along with a small negative linear slope. Participants in this group had little to no cigarettes smoked throughout the period of observation.
Persistent light smoker: Representing 11.0% (n=663) of all participants, the course was distinguished by smoking at least half pack a day and remained constant over time.
Heavy smoker to nonsmoker: Participants in this group began with nearly smoking at least half pack but less than 1 pack per day but experienced substantial reduction over time, ending with smoking almost no packs a day. They accounted for 10.0% (n=531) of all participants in the study.
Persistent heavy smoker: Characterizing 23.1% (n=1,604) of the sample, the trajectory group exhibited a very high level of cigarette smoking that persisted over the observation period. The trajectory did decline, but participants continued smoking more than half pack a day.
At the baseline visit, black, non-Hispanic men were more likely to be persistent heavy smokers among both HIV-seronegative and HIV-seropositive men compared with white, non-Hispanic men (Table 1). HIV-seronegative participants in the second wave were more likely to be persistent heavy smokers compared with participants in the first wave (33.9% vs 19.8%). There were no differences in proportions observed for CD4 cell count, ART use, and viral load by type of smoking trajectory.
Table 1. Descriptive Statistics of Baseline Covariates by Trajectory Group and HIV serostatus.
| HIV-seronegative | HIV-seropositive | |||||||
|---|---|---|---|---|---|---|---|---|
| Persistent nonsmoker (n=1,925) | Persistent light smoker (n=300) | Heavy Smoker to nonsmoker (n=254) | Persistent Heavy Smoker (n=699) | Persistent nonsmoker (n=1,812) | Persistent light smoker (n=363) | Heavy Smoker to nonsmoker (n=277) | Persistent Heavy Smoker (n=905) | |
| Age (mean, SD) | 33.6 (8.3) | 35.0 (8.8) | 34.0 (7.5) | 35.6 (8.7) | 33.3 (7.5) | 34.2 (7.8) | 33.1 (7.7) | 34.0 (7.5) |
| Race | ||||||||
| White, non-Hispanic | 63.2 (1600) | 8.4 (213) | 8.2 (208) | 20.1 (509) | 56.5 (1318) | 9.5 (222) | 7.5 (176) | 26.5 (619) |
| Black, non-Hispanic | 46.0 (193) | 11.9 (50) | 6.0 (25) | 36.2(152) | 45.5 (289) | 11.7 (74) | 8.4 (53) | 34.5 (219) |
| Other | 58.2 (132) | 16.3 (37) | 8.8 (20) | 16.7 (38) | 43.0 (205) | 17.3 (67) | 12.4 (48) | 17.3 (67) |
| Wave | ||||||||
| Enrolled before 2001 | 63.0 (1688) | 9.0 (242) | 8.2 (220) | 19.8 (531) | 56.8 (1520) | 10.0 (268) | 8.3 (222) | 24.9 (666) |
| 2001 and after | 47.6 (237) | 11.9 (59) | 6.6 (33) | 33.9 (169) | 42.9 (292) | 14.0 (95) | 8.1 (55) | 35.1 (239) |
| Site of Enrollment | ||||||||
| Baltimore/Washington DC | 65.3 (575) | 9.9 (87) | 8.5 (75) | 16.4 (144) | 55.3 (422) | 10.9 (83) | 7.5 (57) | 26.3 (201) |
| Chicago | 61.5 (425) | 9.6 (66) | 5.9 (41) | 23.0 (159) | 52.2 (437) | 9.0 (75) | 9.0 (75) | 29.9 (250) |
| Los Angeles | 64.2 (482) | 9.5 (71) | 10.3 (77) | 16.1 (121) | 55.8(630) | 13.2 (149) | 9.3 (105) | 21.7 (245) |
| Pittsburgh | 51.8 (443) | 9.0 (77) | 7.0 (60) | 32.2 (276) | 51.4 (323) | 8.9 (56) | 6.4 (40) | 33.3 (209) |
| Education | ||||||||
| High School Diploma or Less | 40.7 (180) | 10.2 (45) | 5.7 (25) | 43.4 (192) | 33.9 (214) | 13.5 (85) | 9.5 (60) | 43.2 (273) |
| Some College or College Degree | 57.1 (838) | 9.2 (135) | 9.5 (140) | 24.2 (355) | 54.4 (967) | 10.5 (187) | 8.8 (157) | 26.3 (467) |
| Graduate Work or More | 72.0 (895) | 9.4 (117) | 6.8 (85) | 11.8 (147) | 67.0 (618) | 9.3 (86) | 6.3 (58) | 17.4 (160) |
| Unemployed | ||||||||
| Depressive Symptoms | ||||||||
| CESD < 16 | 62.9 (1540) | 9.3 (228) | 7.7 (188) | 20.1 (493) | 57.5 (1401) | 10.3 (251) | 8.3 (202) | 23.9 (583) |
| CESD ≥ 16 | 53.3 (360) | 9.9 (67) | 8.6 (58) | 28.3 (191) | 44.3 (369) | 11.8 (98) | 8.4 (70) | 35.5 (296) |
| Cumulative Pack-Years | 5.8 (13.8) | 12.3 (15.0) | 19.2 (17.2) | 26.0 (18.7) | 5.4 (13.4) | 10.9 (12.9) | 16.7 (15.9) | 23.2 (15.5) |
| Marijuana Use | ||||||||
| No | 42.7 (29) | 13.2 (9) | 4.4 (3) | 39.7 (27) | 35.9 (28) | 18.0 (14) | 11.5 (9) | 34.6 (27) |
| Yes | 37.8 (74) | 13.8 (27) | 6.6 (13) | 41.8 (82) | 26.1 (62) | 17.7 (42) | 8.0 (19) | 48.3 (115) |
| Hospitalization in the past 6 months | ||||||||
| No | 61.1 (1859) | 9.4 (285) | 8.0 (242) | 21.6 (123) | 54.7 (1709) | 11.0 (342) | 8.3 (260) | 26.0 (811) |
| Yes | 48.1 (63) | 12.2 (16) | 7.6 (10) | 32.1 (42) | 44.1 (94) | 6.6 (14) | 8.0 (17) | 41.3 (88) |
| CD4+ T-cell count (cells/μl) | ||||||||
| >500 | 52.3 (1072) | 10.8 (221) | 9.2 (188) | 27.7 (568) | ||||
| 201-500 | 58.2 (603) | 10.2 (106) | 6.5 (67) | 25.2 (261) | ||||
| ≤ 200 | 50.6 (137) | 13.3 (36) | 8.1 (22) | 28.0 (76) | ||||
| ART | ||||||||
| No therapy | 49.5 (335) | 9.8 (66) | 8.6 (58) | 32.2 (218) | ||||
| Monotherapy | 63.6 (7) | 0.0 (0) | 9.1 (1) | 27.3 (3) | ||||
| Combined Therapy | 45.0 (9) | 15.4 (4) | 3.9 (1) | 26.9 (7) | ||||
| Potent Therapy | 48.9 (114) | 14.8 (51) | 7.3 (25) | 33.3 (115) | ||||
| Viral Load | ||||||||
| Not Detectable | 46.9 (135) | 12.2 (35) | 6.6 (19) | 34.4 (99) | ||||
| Detectable | 44.5 (300) | 11.9 (80) | 9.6 (65) | 34.0 (229) | ||||
| Died | 4.0 (12) | 5.4 (103) | 9.1 (23) | 11.6 (81) | 52.1 (189) | 57.8 (1047) | 52.7 (146) | 57.6 (521) |
| Dropped Out / Censored | 67.8 (204) | 61.5 (1184) | 52.2 (132) | 65.9 (461) | 16.5 (60) | 15.1 (273) | 13.4 (37) | 18.0 (163) |
SD = standard deviation; CESD = Center for Epidemiologic Studies Depression; ART = antiretroviral therapy
After adjusting for time-constant and time-varying covariates, we modeled long-term smoking trajectories for all participants (Figure 1 and Table 2). As shown in Table 2, for all 4 smoking trajectory groups, cigarette smoking at a given time varied with not only time but also with marijuana use and binge drinking. Several covariates of interest were associated with cigarette smoking group membership. Compared with the persistent nonsmoker group, persistent heavy smoker group membership were associated with being enrolled in 2001 and after (aOR, 2.35; 95% CI, 2.12-2.58) and having a high school diploma or less (aOR, 3.22; 95% CI, 3.05-3.39) (Table 3). Time of enrollment and having a high school diploma or less were significant predictors of cigarette smoking across all trajectory groups (p<0.0001). Loss to follow-up of participants that had died or dropped out were associated with persistent heavy smoking compared with the persistent nonsmoker group. Loss to follow-up was also a predictor across all trajectory groups (p<0.0001 and p=0.0002, respectively). To confirm our results, we used generalized linear mixed models. Each trajectory was a separate outcome, and the persistent nonsmoker group was treated as the reference group. Black, non-Hispanic MSMs, being enrolled 2001 and after, being HIV-seropositive, marijuana use, and binge drinking were all associated with the trajectory groups persistent heavy smoker, heavy smoker to nonsmoker, and persistent light smoker when compared with the persistent nonsmoker group (data not shown).
Figure 1. Trajectory groups of smoking consumption over time with adjustment for time-constant and time-varying variables in participants in the MACS.
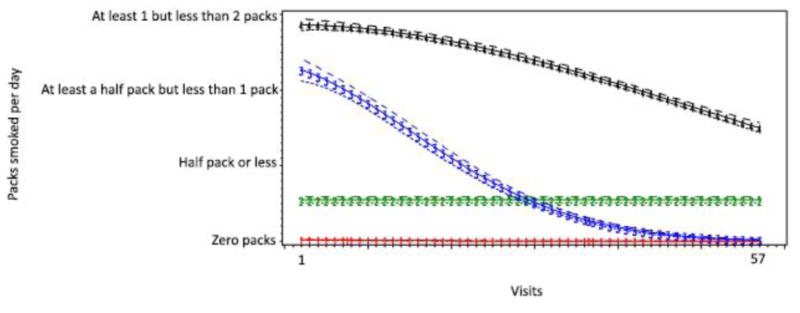
Table 2. Estimated Trajectory Groups and Group-Specific Growth Parameters for All Participants in the MACS.
| Group 1 | Group 2 | Group 3 | Group 4 | |
|---|---|---|---|---|
|
| ||||
| Description | Persistent nonsmoker | Persistent light Smoker | Heavy Smoker to nonsmoker | Persistent Heavy Smoker |
| Intercept | -6.3264** | -1.1471** | 0.8572** | 1.0924** |
| Linear | -0.0047** | <0.0001** | -0.0005 | 0.0001 |
| Quadratic | - | - | -0.00001** | <-0.0001** |
| Marijuana Use | 1.1794** | 0.2862** | 0.0043 | -0.0081 |
| Binge Drinker | 0.1348* | 0.0333* | 0.0230 | 0.0091 |
| Group Membership | 55.9% | 11.0% | 10.0% | 23.1% |
| BIC¥ | -71359.39 (N=123550) / -71309.39 (N=6525) | |||
p < 0.05
p < 0.001
Bayesian Information Criteria
Table 3. Factors Associated with Trajectory Group Membership, After Adjusting for Time-Varying Covariates for All Participants.
| Persistent nonsmoker | Persistent light Smoker aOR (95% CI) | Heavy Smoker to nonsmoker aOR (95% CI) | Persistent Heavy Smoker aOR (95% CI) | Wald-based chi-squared statistic | |
|---|---|---|---|---|---|
| Age (mean, SD) | Reference | 1.02 (1.01-1.03) | 1.01 (1.00-1.03) | 1.01 (1.00-1.02) | 0.23 |
| Race | |||||
| White, non-Hispanic | Reference | Reference | Reference | Reference | |
| Black, non-Hispanic | Reference | 1.44 (1.16-1.73) | 1.12 (0.76-1.48) | 1.22 (1.03-1.42) | 0.47 |
| Other | Reference | 1.73 (1.44-2.02) | 1.53 (1.19-1.88) | 0.40 (0.09-0.70) | <0.0001 |
| Wave | |||||
| Enrolled before 2001 | Reference | Reference | Reference | Reference | |
| 2001 and after | Reference | 1.28 (0.96-1.60) | 1.02 (0.61-1.44) | 2.35 (2.12-2.58) | <0.0001 |
| Education | |||||
| High School Diploma or Less | Reference | 1.76 (1.51-2.01) | 1.30 (0.97-1.65) | 3.22 (3.05-3.39) | <0.0001 |
| Some College or More | Reference | Reference | Reference | Reference | |
| HIV-seropositive | Reference | 1.15 (0.93-1.37) | 0.97 (0.72-1.23) | 1.17 (1.01-1.34) | 0.36 |
| Death | Reference | 1.32 (1.05-1.60) | 1.22 (0.92-1.51) | 1.95 (1.75-2.15) | <0.0001 |
| Drop out / Censored | Reference | 1.48 (1.24-1.72) | 0.90 (0.64-1.17) | 1.71 (1.53-1.89) | 0.0002 |
AOR = adjusted odds ratio
CI = confidence interval
Because we were also interested in HIV-specific variables, we ran the same analysis using HIV-seropositive participants while additionally adjusting for HIV-specific time-varying covariates. The patterns of smoking behavior remained the same (Table 4). Compared with the persistent nonsmoker group, persistent heavy smoker group membership was associated with being enrolled in 2001 and after (aOR, 2.13; 95% CI, 1.67-2.59) and having a high school diploma or less (aOR, 2.53; 95% CI, 2.07-3.01) (Table 5). Race was the only statistically significant predictor for group membership across all trajectory groups (non-Hispanic black, p=0.001; other, p<0.0001).
Table 4. Estimated Trajectory Groups and Group-Specific Growth Parameters for HIV-seropositive Participants in the MACS.
| Group 1 | Group 2 | Group 3 | Group 4 | |
|---|---|---|---|---|
|
| ||||
| Description | Persistent non-smoker | Persistent light Smoker | Heavy Smoker to nonsmoker | Persistent Heavy Smoker |
| Intercept | -5.8115** | -0.4994** | -0.1214 | 0.9241** |
| Linear | -0.0063** | 0.000** | 0.0131** | 0.0003 |
| Quadratic | - | - | -0.0004** | <-0.0001** |
| Marijuana Use | 1.1006** | 0.1623* | -0.0912 | 0.0295 |
| Binge Drinker | 0.2440** | 0.0065* | 0.0560 | 0.0179 |
| CD4 Count | 0.0016** | 0.0002 | <0.0001 | 0.0001** |
| ART Use | 0.0888 | -0.1635** | -0.0145 | 0.0059 |
| Viral Load | <-0.0001 | <-0.0001 | <0.0001 | <-0.0001 |
| Group Membership | 53.4% | 11.1% | 10.1% | 25.4% |
| BIC¥ | -22339.38 (N=58083) / -22283.72 (N=3349) | |||
p < 0.05
p < 0.001
Bayesian Information Criteria
Table 5. Factors Associated with Trajectory Group Membership, Before Adjusting for Time-Varying Covariates, HIV-Seropositive Participants.
| Persistent non-smoker | Persistent light smoker aOR (95% CI) | Heavy Smoker to nonsmoker aOR (95% CI) | Persistent Heavy Smoker aOR (95% CI) | Wald-based chi-squared statistic | |
|---|---|---|---|---|---|
| Age (mean, SD) | Reference | 1.02 (1.00-1.04) | 1.02 (0.99-1.05) | 1.02 (1.00-1.04) | 0.64 |
| Race | |||||
| White, non-Hispanic | Reference | Reference | Reference | Reference | |
| Black, non-Hispanic | Reference | 2.23 (1.83-2.64) | 0.88 (0.19-1.58) | 1.30 (0.85-1.75) | 0.001 |
| Other | Reference | 1.65 (1.16-2.14) | 2.42 (1.82-3.02) | 1.42 (1.00-1.83) | <0.0001 |
| Wave | |||||
| Enrolled before 2001 | Reference | Reference | Reference | Reference | |
| 2001 and after | Reference | 1.75 (1.27-2.24) | 1.39 (0.71-2.07) | 2.13 (1.67-2.59) | 0.447 |
| Education | |||||
| High School Diploma or Less | Reference | 1.86 (1.47-2.25) | 1.76 (1.17-2.35) | 2.53 (2.07-3.01) | 0.068 |
| Some College or More | Reference | Reference | Reference | Reference | |
| Death | Reference | 1.49 (1.05-1.82) | 1.13 (0.88-1.47) | 2.31 (1.82-2.65) | 0.002 |
| Dropout / Censored | Reference | 1.41 (1.06-1.77) | 0.48 (0.12-1.08) | 1.61 (1.37-1.83) | 0.0014 |
AOR = adjusted odds ratio; CI = confidence interval
Discussion
Our analysis of longitudinal data from the MACS identified 4 distinct, long-term smoking trajectories in HIV-seropositive and HIV-seronegative MSM. Reflecting the stability of smoking behavior over the lifetime, 34% of these men changed their smoking behavior during the study period. A third of those who changed were initially smoking between half pack and one pack per day but experienced substantial reduction over time, ending with smoking almost no packs a day. We demonstrated that among all participants, education and time of enrollment were significant predictors across all trajectory groups. Among HIV-seropositive participants, race was the only statistically significant predictor across all trajectory groups.
Previous studies that examined smoking trajectories have presented results for trends among adolescents as they emerge into adulthood [24-27]. To our knowledge this is the first time smoking trajectories have been used to establish distinct smoking patterns among MSM and PLWH using a large cohort study. Because there is a difference among age groups, type of population, trajectory type, and gender, it is difficult to compare trajectory patterns across studies. However, the overall decrease of smoking as shown by our trajectory groups is consistent with the national trend [3, 11].
Greenwood et al., found that a greater proportion of MSM reported cessation of tobacco use than reported current daily tobacco use. This indicates a voluntary inclination toward health promotion and recovery [28]. This was also marked in our study, as there was evidence of reductions and quitting of smoking among MSM with demonstrated syndemic healthy conditions [29]. Many studies have theorized that MSM have learned to overcome the negative effects of a certain exposure, how to cope with a traumatic experience, and how to avoid negative trajectories associated with risks [30-32]. Resilience among MSM has been defined as a process of adaptation and readjustment despite facing adversity [33]. The process of adaptation may involve psychological, social, and/or behavioral characteristics [32, 33]. Over time, MSM have decreased recreational drug use and have increasingly participated in the gay rights movement, indicating health promotion, altruism, and social justice [34-37]. Among MACS participants, a recent study showed that there were patterns of resilience against frequent stimulant drug use [20]. The patterns shown in our study should be used to identify factors for resiliency to aid in the design of intervention programs to continue to reduce cigarette smoking among MSM.
Our study has several limitations. Although we used a large sample of HIV-seropositive and HIV-seronegative MSM, those included in our sample are still older and may be less diverse than those at highest risk of HIV in the United States. It has also been shown that the MACS participants are a highly motivated group of MSM who have stayed in this study for a number of years and may differ from other MSM in the general population. To account for this, we added variables to assess how death and drop out were associated with trajectory group membership. Among all participants in the study and HIV-seropositive participants, the loss to follow-up variable was a predictor across all trajectory groups. Specifically, the variable was statistically significant among the persistent light smoker group and persistent heavy smoker group among all MSM.
Despite these limitations, the use of a large sample of HIV-seropositive and HIV-seronegative MSM from different sites in the United States, the long-term follow up, and the use of trajectory modeling to measure smoking patterns are strengths of our study. Our findings expand current understandings of cigarette smoking patterns among HIV-seropositive and HIV-seronegative MSM and should be considered in the development of targeted smoking cessation interventions among this population. Additionally, future studies should examine the factors that underlie resilience among MSM who quit smoking to find ways to incorporate them in interventions for those who continue to smoke. The preserved life expectancy of PLWH coupled with the increased rate of chronic illnesses associated with controlling viral loads emphasizes the need to identify and test effective cessation treatments for smoking cessation in a vulnerable population.
References
- 1.Mdodo R, et al. Cigarette Smoking Prevalence Among Adults With HIV Compared With the General Adult Population in the United States: Cross-sectional Surveys. Ann Intern Med. 2015;162(5):335–44. doi: 10.7326/M14-0954. [DOI] [PubMed] [Google Scholar]
- 2.Crothers K, et al. Impact of cigarette smoking on mortality in HIV-positive and HIV-negative veterans. AIDS Educ Prev. 2009;21(3 Suppl):40–53. doi: 10.1521/aeap.2009.21.3_supp.40. [DOI] [PMC free article] [PubMed] [Google Scholar]
- 3.Lifson AR, Lando HA. Smoking and HIV: prevalence, health risks, and cessation strategies. Curr HIV/AIDS Rep. 2012;9(3):223–30. doi: 10.1007/s11904-012-0121-0. [DOI] [PubMed] [Google Scholar]
- 4.Lifson AR, et al. Smoking-related health risks among persons with HIV in the Strategies for Management of Antiretroviral Therapy clinical trial. Am J Public Health. 2010;100(10):1896–903. doi: 10.2105/AJPH.2009.188664. [DOI] [PMC free article] [PubMed] [Google Scholar]
- 5.Tesoriero JM, et al. Smoking among HIV positive New Yorkers: prevalence, frequency, and opportunities for cessation. AIDS Behav. 2010;14(4):824–35. doi: 10.1007/s10461-008-9449-2. [DOI] [PubMed] [Google Scholar]
- 6.Pacek LR, Harrell PT, Martins SS. Cigarette smoking and drug use among a nationally representative sample of HIV-positive individuals. Am J Addict. 2014;23(6):582–90. doi: 10.1111/j.1521-0391.2014.12145.x. [DOI] [PMC free article] [PubMed] [Google Scholar]
- 7.Benard A, et al. Tobacco addiction and HIV infection: toward the implementation of cessation programs. ANRS CO3 Aquitaine Cohort. AIDS Patient Care STDS. 2007;21(7):458–68. doi: 10.1089/apc.2006.0142. [DOI] [PubMed] [Google Scholar]
- 8.Royce RA, Winkelstein W., Jr HIV infection, cigarette smoking and CD4+ T-lymphocyte counts: preliminary results from the San Francisco Men's Health Study. AIDS. 1990;4(4):327–33. [PubMed] [Google Scholar]
- 9.Stall RD, et al. Cigarette smoking among gay and bisexual men. Am J Public Health. 1999;89(12):1875–8. doi: 10.2105/ajph.89.12.1875. [DOI] [PMC free article] [PubMed] [Google Scholar]
- 10.Reynolds NR. CIGARETTE SMOKING AND HIV: MORE EVIDENCE FOR ACTION. AIDS Educ Prev. 2009;21(3 Suppl):106–21. doi: 10.1521/aeap.2009.21.3_supp.106. [DOI] [PMC free article] [PubMed] [Google Scholar]
- 11.Agaku I, King B, Dube S. Current Cigarette Smoking Among Adults-United States, 2005-2012. [PMC free article] [PubMed] [Google Scholar]
- 12.Justice AC. HIV and aging: time for a new paradigm. Curr HIV/AIDS Rep. 2010;7(2):69–76. doi: 10.1007/s11904-010-0041-9. [DOI] [PubMed] [Google Scholar]
- 13.Barbaro G, et al. An open-label, prospective, observational study of the incidence of coronary artery disease in patients with HIV infection receiving highly active antiretroviral therapy. Clin Ther. 2003;25(9):2405–18. doi: 10.1016/s0149-2918(03)80283-7. [DOI] [PubMed] [Google Scholar]
- 14.Friis-Moller N, et al. Combination antiretroviral therapy and the risk of myocardial infarction. N Engl J Med. 2003;349(21):1993–2003. doi: 10.1056/NEJMoa030218. [DOI] [PubMed] [Google Scholar]
- 15.Petoumenos K, et al. Rates of cardiovascular disease following smoking cessation in patients with HIV infection: results from the D:A:D study(*) HIV Med. 2011;12(7):412–21. doi: 10.1111/j.1468-1293.2010.00901.x. [DOI] [PMC free article] [PubMed] [Google Scholar]
- 16.Kaslow RA, et al. Infection with the human immunodeficiency virus: clinical manifestations and their relationship to immune deficiency. A report from the Multicenter AIDS Cohort Study. Ann Intern Med. 1987;107(4):474–80. doi: 10.7326/0003-4819-107-4-474. [DOI] [PubMed] [Google Scholar]
- 17.Dudley J, et al. The Multicenter AIDS Cohort Study: retention after 9 1/2 years. Am J Epidemiol. 1995;142(3):323–30. doi: 10.1093/oxfordjournals.aje.a117638. [DOI] [PubMed] [Google Scholar]
- 18.Akhtar WZ, et al. Trends and predictors of cigarette smoking among HIV seropositive and seronegative men: The Multicenter AIDS Cohort Study. AIDS and Behavior. 2015 doi: 10.1007/s10461-015-1099-6. (in press) [DOI] [PMC free article] [PubMed] [Google Scholar]
- 19.Cook RL, et al. Alcohol consumption trajectory patterns in adult women with HIV infection. AIDS Behav. 2013;17(5):1705–12. doi: 10.1007/s10461-012-0270-6. [DOI] [PMC free article] [PubMed] [Google Scholar]
- 20.Lim SH, et al. Changes in stimulant drug use over time in the MACS: evidence for resilience against stimulant drug use among men who have sex with men. AIDS Behav. 2012;16(1):151–8. doi: 10.1007/s10461-010-9866-x. [DOI] [PMC free article] [PubMed] [Google Scholar]
- 21.Hedeker D, Gibbons R. Longitudinal Data Analysis. Wiley-Interscience; 2006. [Google Scholar]
- 22.Nagin D. GROUP-BASED MODELING OF DEVELOPMENT. Harvard University Press; 2005. [Google Scholar]
- 23.Shwarz G. Estimating the Dimension of a Model. The Annals of Statistics. 1978;9(2):461–464. [Google Scholar]
- 24.Audrain-McGovern J, et al. Identifying and characterizing adolescent smoking trajectories. Cancer Epidemiol Biomarkers Prev. 2004;13(12):2023–34. [PubMed] [Google Scholar]
- 25.Bernat DH, et al. Adolescent Smoking Trajectories: Results from a Population-Based Cohort Study. J Adolesc Health. 2008;43(4):334–40. doi: 10.1016/j.jadohealth.2008.02.014. [DOI] [PMC free article] [PubMed] [Google Scholar]
- 26.Hampson SE, et al. Smoking Trajectories Across High School: Sensation Seeking and Hookah Use. Nicotine Tob Res. 2013;15(8):1400–8. doi: 10.1093/ntr/nts338. [DOI] [PMC free article] [PubMed] [Google Scholar]
- 27.Lessov-Schlaggar CN, et al. Nicotine Tob Res. England: 2008. Adolescent smoking trajectories and nicotine dependence; pp. 341–51. [DOI] [PubMed] [Google Scholar]
- 28.Greenwood GL, et al. Am J Public Health. United States: 2005. Tobacco use and cessation among a household-based sample of US urban men who have sex with men; pp. 145–51. [DOI] [PMC free article] [PubMed] [Google Scholar]
- 29.Herrick AL, et al. Adversity and syndemic production among men participating in the multicenter AIDS cohort study: a life-course approach. Am J Public Health. 2013;103(1):79–85. doi: 10.2105/AJPH.2012.300810. [DOI] [PMC free article] [PubMed] [Google Scholar]
- 30.Kurtz SP, et al. RESILIENCE, SYNDEMIC FACTORS, AND SEROSORTING BEHAVIORS AMONG HIV-POSITIVE AND HIV-NEGATIVE SUBSTANCE-USING MSM. AIDS Educ Prev. 2012;24(3):193–205. doi: 10.1521/aeap.2012.24.3.193. [DOI] [PMC free article] [PubMed] [Google Scholar]
- 31.Stall R, Friedman M, Catania J. Unequal opportunity: Health disparities affecting gay and bisexual men in the United States. Oxford University Press; New York: 2008. Interacting epidemics and gay men's health: A theory of syndemic production among urban gay men. [Google Scholar]
- 32.Fergus S, Zimmerman MA. Adolescent resilience: a framework for understanding healthy development in the face of risk. Annu Rev Public Health. 2005;26:399–419. doi: 10.1146/annurev.publhealth.26.021304.144357. [DOI] [PubMed] [Google Scholar]
- 33.Rabkin JG, et al. Resilience in adversity among long-term survivors of AIDS. Hosp Community Psychiatry. 1993;44(2):162–7. doi: 10.1176/ps.44.2.162. [DOI] [PubMed] [Google Scholar]
- 34.Mills TC, et al. Distress and depression in men who have sex with men: the Urban Men's Health Study. Am J Psychiatry. 2004;161(2):278–85. doi: 10.1176/appi.ajp.161.2.278. [DOI] [PubMed] [Google Scholar]
- 35.Stall R, et al. Alcohol use, drug use and alcohol-related problems among men who have sex with men: the Urban Men's Health Study. Addiction. 2001;96(11):1589–601. doi: 10.1046/j.1360-0443.2001.961115896.x. [DOI] [PubMed] [Google Scholar]
- 36.Herrick AL, et al. Resilience as an untapped resource in behavioral intervention design for gay men. AIDS Behav. 2011;15(Suppl 1):S25–9. doi: 10.1007/s10461-011-9895-0. [DOI] [PubMed] [Google Scholar]
- 37.Kent M, Davis M. Handbook of adult resilience. Guilford Press; New York: 2010. The emergence of capacity-building programs and models of resilience; pp. 427–449. [Google Scholar]