

Abstract
Key points
Genetic mutations in cardiac troponin I (cTnI) are associated with development of hypertrophic cardiomyopathy characterized by myocyte remodelling, disorganization of cytoskeletal proteins and altered energy metabolism.
The L‐type Ca2+ channel is the main route for calcium influx and is crucial to cardiac excitation and contraction. The channel also regulates mitochondrial function in the heart by a functional communication between the channel and mitochondria via the cytoskeletal network.
We find that L‐type Ca2+ channel kinetics are altered in cTnI‐G203S cardiac myocytes and that activation of the channel causes a significantly greater increase in mitochondrial membrane potential and metabolic activity in cTnI‐G203S cardiac myocytes.
These responses occur as a result of impaired communication between the L‐type Ca2+ channel and cytoskeletal protein F‐actin, involving decreased movement of actin–myosin and block of the mitochondrial voltage‐dependent anion channel, resulting in a ‘hypermetabolic’ mitochondrial state.
We propose that L‐type Ca2+ channel antagonists, such as diltiazem, might be effective in reducing the cardiomyopathy by normalizing mitochondrial metabolic activity.
Abstract
Genetic mutations in cardiac troponin I (cTnI) account for 5% of families with hypertrophic cardiomyopathy. Hypertrophic cardiomyopathy is associated with disorganization of cytoskeletal proteins and altered energy metabolism. The L‐type Ca2+ channel (ICa‐L) plays an important role in regulating mitochondrial function. This involves a functional communication between the channel and mitochondria via the cytoskeletal network. We investigate the role of ICa‐L in regulating mitochondrial function in 25‐ to 30‐week‐old cardiomyopathic mice expressing the human disease‐causing mutation Gly203Ser in cTnI (cTnI‐G203S). The inactivation rate of ICa‐L is significantly faster in cTnI‐G203S myocytes [cTnI‐G203S: τ1 = 40.68 ± 3.22, n = 10 vs. wild‐type (wt): τ1 = 59.05 ± 6.40, n = 6, P < 0.05]. Activation of ICa‐L caused a greater increase in mitochondrial membrane potential (Ψm, 29.19 ± 1.85%, n = 15 vs. wt: 18.84 ± 2.01%, n = 10, P < 0.05) and metabolic activity (24.40 ± 6.46%, n = 8 vs. wt: 9.98 ± 1.57%, n = 9, P < 0.05). The responses occurred because of impaired communication between ICa‐L and F‐actin, involving lack of dynamic movement of actin–myosin and block of the mitochondrial voltage‐dependent anion channel. Similar responses were observed in precardiomyopathic mice. ICa‐L antagonists nisoldipine and diltiazem decreased Ψm to basal levels. We conclude that the Gly203Ser mutation leads to impaired functional communication between ICa‐L and mitochondria, resulting in a ‘hypermetabolic’ state. This might contribute to development of cTnI‐G203S cardiomyopathy because the response is present in young precardiomyopathic mice. ICa‐L antagonists might be effective in reducing the cardiomyopathy by altering mitochondrial function.
Key points
Genetic mutations in cardiac troponin I (cTnI) are associated with development of hypertrophic cardiomyopathy characterized by myocyte remodelling, disorganization of cytoskeletal proteins and altered energy metabolism.
The L‐type Ca2+ channel is the main route for calcium influx and is crucial to cardiac excitation and contraction. The channel also regulates mitochondrial function in the heart by a functional communication between the channel and mitochondria via the cytoskeletal network.
We find that L‐type Ca2+ channel kinetics are altered in cTnI‐G203S cardiac myocytes and that activation of the channel causes a significantly greater increase in mitochondrial membrane potential and metabolic activity in cTnI‐G203S cardiac myocytes.
These responses occur as a result of impaired communication between the L‐type Ca2+ channel and cytoskeletal protein F‐actin, involving decreased movement of actin–myosin and block of the mitochondrial voltage‐dependent anion channel, resulting in a ‘hypermetabolic’ mitochondrial state.
We propose that L‐type Ca2+ channel antagonists, such as diltiazem, might be effective in reducing the cardiomyopathy by normalizing mitochondrial metabolic activity.
Abbreviations
- cTnI
cardiac troponin I
- DHE
dihydroethidium
- Dilt
diltiazem
- FCCP
carbonyl cyanide‐4‐(trifluoromethoxy)phenylhydrazone
- HBS
Hepes‐buffered solution
- ICa‐L
L‐type Ca2+ channel
- IP
immunoprecipitation
- JC‐1
5,5′,6,6′‐tetrachloro‐1,1′,3,3′‐tetraethylbenzimidazolylcarbocyanine iodide
- Latrunc
latrunculin A
- Myx
myxothiazol
- Nisol
nisoldipine
- Oligo
oligomycin
- TEM
transmission electron microscopy
- VDAC
voltage‐dependent anion channel
- Ψm
mitochondrial membrane potential
Introduction
Hypertrophic cardiomyopathy is a primary myocardial disorder that affects one in 200 of the general population (Semsarian et al. 2015). Genetic mutations in cytoskeletal protein cardiac troponin I (cTnI) account for ∼5% of families with hypertrophic cardiomyopathy (Richard et al. 2003; Mogensen et al. 2004; Doolan et al. 2005). Cardiac troponin (cTn) plays an important role in regulating contraction and relaxation. Cardiac troponin consists of three regulatory subunits, including cTnI, troponin T (cTnT) and troponin C (cTnC). Troponin T anchors the troponin complex to tropomyosin, whereas cTnI regulates cardiac contraction and relaxation in response to changes in intracellular Ca2+ ([Ca2+]i; Parmacek & Solaro, 2004). During relaxation, cTnI inhibits actin–myosin interaction. Upon Ca2+ binding to cTnC, cTnI undergoes a conformational change that allows actin–myosin interaction and subsequent contraction. The human disease‐causing cTnI mutation Gly203Ser causes hypertrophic cardiomyopathy and is characterized by apical hypertrophy and, in some cases, supraventricular and ventricular arrhythmias (Kimura et al. 1997; Tsoutsman et al. 2006). However, the relationship between the gene mutation and phenotype is poorly understood.
Hypertrophic cardiomyopathy is associated with myocyte remodelling, disorganization of cytoskeletal proteins and altered energy metabolism (Marian & Roberts, 2001; Tsoutsman et al. 2006). The cytoskeleton consists of microtubules comprised of tubulin, microfilaments comprised of actin, and intermediate filaments. The cytoskeletal network plays an important role in modulating cell morphology, motility, intracytoplasmic transport and mitosis (Penman, 1995; Rappaport et al. 1998). In mature muscle, cytoskeletal elements extend from the plasma membrane to Z discs and traverse cellular organelles such as the t‐tubules, sarcoplasmic reticulum and mitochondria (Tokuyasu et al. 1983). Cytoskeletal proteins interact directly with mitochondria by binding to outer mitochondrial docking proteins. In addition to a physical association, cytoskeletal proteins also regulate the function of proteins in the plasma membrane and within the cell (Thornell et al. 1985). This includes the L‐type Ca2+ channel (ICa‐L) or dihydropyridine receptor that resides in the plasma membrane. ICa‐L is anchored to F‐actin networks by subsarcolemmal stabilizing proteins that also tightly regulate the function of the channel (Lader et al. 1999; Rueckschloss & Isenberg, 2001; Hohaus et al. 2002). Disruption of actin filaments significantly alters ICa‐L current (Lader et al. 1999; Nakamura et al. 2000; Rueckschloss & Isenberg, 2001).
Influx of Ca2+ ions through ICa‐L is responsible for maintaining cardiac excitation and contraction. ICa‐L also plays an important role in regulating mitochondrial function. Activation of ICa‐L with voltage clamp of the plasma membrane or application of the dihydropyridine receptor agonist BayK(−) is sufficient to increase [Ca2+]i, mitochondrial Ca2+, NADH production, superoxide production and metabolic activity in a Ca2+‐dependent manner (Viola et al. 2009; Viola & Hool, 2010). Activation of ICa‐L can also increase the mitochondrial membrane potential (Ψm) in a Ca2+‐independent manner (Viola et al. 2009). The response is reversible upon inactivation of the channel during voltage clamp and is dependent on actin filaments because depolymerization of actin or prevention of movement of the β auxiliary subunit of ICa‐L with application of a peptide derived against the α‐interacting domain prevents the increase in Ψm (Viola et al. 2009). Therefore, ICa‐L influences metabolic activity through transmission of movement of the channel via cytoskeletal proteins.
Here, we sought to identify whether cytoskeletal disruption attributable to the Gly203Ser mutation in cTnI leads to mitochondrial dysfunction and compromised cardiac function in cardiac myocytes isolated from 25‐ to 30‐week‐old mice expressing the human disease causing‐mutation cTnI‐G203S that exhibit characteristic features of the cardiomyopathy, including hypertrophy, hypercontractility, myofibre disarray and interstitial fibrosis (Marian & Roberts, 2001; Tsoutsman et al. 2006). We investigated whether this cytoskeletal disruption results in impaired communication between ICa‐L and mitochondria and, subsequently, altered metabolic function.
Methods
Ethical approval
The research was approved by The Animal Ethics Committee of The University of Western Australia in accordance with the Australian Code of Practice for the Care and Use of Animals for Scientific Purposes (NH&MRC, 8th edition, 2013).
Mouse models
Male 25‐ to 30‐week‐old and 10‐ to 15‐week‐old mice expressing the human cTnI gene encoding the human disease‐causing mutation cTnI‐G203S were generated and studied. The 25‐ to 30‐week‐old mice exhibit cardiomyopathy as evidenced by changes on echocardiography and measurements of heart weight to body weight ratio, whereas 10‐ to 15‐week‐old mice do not (Table 1). Male age‐matched mice expressing the normal human troponin I gene were used as wild‐type (wt). Experiments were performed using myocytes isolated from three to six mice for each experimental group.
Table 1.
Echocardiographic parameters of 10‐ to 15‐week‐old and 25‐ to 30‐week‐old wild‐type (wt) and cTnI‐G203S mice
| LVEDD (mm) | LVESD (mm) | FS (%) | LVDPW (mm) | LVSPW (mm) | IVDS (mm) | IVSS (mm) | HW:BW | HR (beats min−1) |
|---|---|---|---|---|---|---|---|---|
| 10‐ to 15‐week‐old mice | ||||||||
| wt (n = 3) | ||||||||
| 3.29 ± 0.02 | 2.12 ± 0.02 | 35.59 ± 0.40 | 0.90 ± 0.01 | 0.99 ± 0.02 | 0.75 ± 0.01 | 0.85 ± 0.01 | 5.13 ± 0.39 | 470 ± 10 |
| cTnI‐G203S (n = 3) | ||||||||
| 3.27 ± 0.01 | 2.09 ± 0.01 | 36.06 ± 0.42 | 0.90 ± 0.04 | 1.02 ± 0.01 | 0.74 ± 0.01 | 0.82 ± 0.01 | 5.84 ± 0.34 | 450 ± 13 |
| 25‐ to 30‐week‐old mice | ||||||||
| wt (n = 6) | ||||||||
| 3.24 ± 0.09 | 2.41 ± 0.16 | 31.24 ± 1.23 | 0.90 ± 0.01 | 0.82 ± 0.03 | 0.79 ± 0.03 | 0.74 ± 0.01 | 2.82 ± 0.14 | 530 ± 12 |
| cTnI‐G203S (n = 5) | ||||||||
| 2.45 ± 0.09* | 1.25 ± 0.05* | 50.74 ± 1.51* | 0.94 ± 0.01 | 0.87 ± 0.01 | 0.97 ± 0.01* | 0.88 ± 0.02* | 4.25 ± 0.40* | 528 ± 6 |
Abbreviations: FS, fractional shortening; HW:BW, heart weight to body weight ratio; IVDS, intraventricular septum in diastole; IVSS, intraventricular septum in systole; LVDPW, left ventricular posterior wall in diastole; LVEDD, left ventricular end‐diastolic diameter; LVESD, left ventricular end‐systolic diameter; and LVSPW, left ventricular posterior wall in systole. Values are means ± SEM. Student's unpaired two‐tailed t tests were used for comparisons (P < 0.05 compared with age‐matched wt mice).
Isolation of ventricular myocytes
Animals were anaesthetized by injection of pentobarbitone sodium (240 mg kg−1, i.p.) prior to excision of the heart, and cells were isolated based on methods described (O'Connell et al. 2007; Viola et al. 2013, 2014). Mouse hearts were excised, cannulated onto a Langendorff apparatus via the aorta and perfused with Krebs–Henseleit buffer containing (mm): 120 NaCl, 25 NaHCO3, 4.8 KCl, 2.2 MgSO4, 1.2 NaH2PO4 and 11 glucose (pH adjusted to 7.35 with 95% O2– 5% CO2 at 37°C) for 4 min at 37°C. The Krebs–Henseleit buffer was then supplemented with 2.4 mg ml−1 collagenase B and hearts were perfused for 6 min, followed by a further 10 min perfusion in the presence of 40 μm Ca2+. The aorta and atria were removed before the ventricles were gently teased apart and triturated to dissociate myocytes into suspension in Krebs–Henseleit buffer supplemented with 10% fetal calf serum. The myocyte suspension was then spun at 30 g for 3 min, supernatant discarded, and myocytes resuspended in Ca2+‐free Hepes‐buffered solution (HBS) containing (mm): 5.3 KCl, 0.4 MgSO4.7H2O, 139 NaCl, 5.6 Na2HPO4.2H2O, 5 glucose, 20 Hepes and 2 glutamine (pH 7.4 at 37°C). Calcium was then titrated back to achieve a final extracellular concentration of 2.5 mm. All experiments were performed on freshly isolated myocytes at 37°C.
Data acquisition for patch‐clamp studies
The whole‐cell configuration of the patch‐clamp technique was used to measure changes in ICa‐L currents in intact ventricular myocytes (Hool, 2000; Viola et al. 2007). Microelectrodes with tip diameters of 3–5 μm and resistances of 0.5–1.5 MΩ contained (mm): 115 CsCl, 10 Hepes, 10 EGTA, 20 tetraethylammonium chloride, 5 MgATP, 0.1 Tris‐GTP, 10 phosphocreatine and 1 CaCl2 (pH adjusted to 7.05 at 37°C with CsOH). Currents were measured in extracellular modified Tyrode solution containing (mm): 140 NaCl, 5.4 CsCl, 2.5 CaCl2, 0.5 MgCl2, 5.5 Hepes and 11 glucose (pH adjusted to 7.4 with NaOH). Barium currents were measured using internal solution containing (mm): 125 CsCl, 10 Hepes, 0.1 EGTA, 20 tetraethylammonium chloride, 5 MgATP, 0.1 Tris‐GTP and 10 phosphocreatine (pH adjusted to 7.05 at 37°C with CsOH), and external solution containing (mm): 152.5 tetraethylammonium chloride, 10 Hepes and 10 BaCl2 [pH adjusted to 7.4 with Ba(OH)2]. Macroscopic currents were recorded using an Axopatch 200B voltage‐clamp amplifier (Molecular Devices, Sunnyvale, CA, USA) and an IBM‐compatible computer with a Digidata 1322A interface and pClamp9 software (Molecular Devices). An Ag–AgCl electrode was used to ground the bath. Once the whole‐cell configuration was achieved, the holding potential was set at −80 mV. Na+ channels and T‐type Ca2+ channels were inactivated by applying a 50 ms prepulse to −30 mV immediately before each test pulse. The time course of changes in Ca2+ conductance was monitored by applying a 100 ms test pulse to 0 mV once every 10 s. Kinetics of calcium current inactivation was analysed by fitting current decay after channel activation with a bi‐exponential function (yielding τ1 and τ2). Current activation and inactivation were also assessed by calculating the integral or ‘area under the curve’ as the area between the graph of y = f(x) and the x‐axis.
Measurement of intracellular Ca2+
Intracellular calcium was monitored using the fluorescent indicator fura‐2 as described previously (Viola et al. 2007). The fluorescence signal was measured on a Hamamatsu Orca ER digital camera attached to an inverted Nikon TE2000‐U microscope. Fluorescent images were taken at 1 min intervals with 50 ms exposure. Metamorph 6.3 was used to quantify the signal by manually tracing myocytes. An equivalent region not containing cells was used as background and was subtracted. Calibrations were performed as previously described in five wt and three cTnI‐G203S myocytes (Haworth et al. 1987; Haworth & Redon, 1998). The medium was replaced with Ca2+‐free HBS supplemented with EGTA (3 mmol l−1) and ionomycin (5 μmol l−1) to obtain minimum 340 nm/380 nm ratiometric fluorescence (R min). Rotenone (4 μm), carbonyl cyanide‐4‐(trifluoromethoxy)phenylhydrazone (FCCP; 2 μm) and 5 mm Ca2+ were then added to produce maximum 340 nm/380 nm ratiometric fluorescence (R max). The 340 nm/380 nm ratiometric fluorescence values recorded over 3 min before and 7 min after addition of drugs were averaged and used to calculate [Ca2+]i pre‐ and post‐treatment. The [Ca2+]i was determined as described previously (Viola et al. 2007) according to the following equation: [Ca2+]i = K d × b(R − R min)/(R max − R); where R = 340 nm/380 nm ratiometric fluorescence, R min = 0.61 ± 0.04 (wt) or 0.74 ± 0.07 (cTnI‐G203S), R max = 13.81 ± 3.38 (wt) or 8.93 ± 0.54 (cTnI‐G203S), b (fluorescence intensity during illumination at 380 nm with 0 mm Ca2+ and 5 mm Ca2+) = 8.08 ± 1.63 (wt) or 3.91 ± 0.42 (cTnI‐G203S), and K d (dissociation constant) = 224 nm as determined previously (Haworth & Redon, 1998).
Measurement of superoxide
Superoxide generation was assessed using dihydroethidium (DHE) as previously described (Viola et al. 2007). The fluorescence signal was measured on a Hamamatsu Orca ER digital camera attached to an inverted Nikon TE2000‐U microscope. Fluorescent images were taken at 1 min intervals with 200 ms exposure. Metamorph 6.3 was used to quantify the signal by manually tracing myocytes. An equivalent region not containing cells was used as background and was subtracted. Fluorescence was reported as the slope of the signal measured at 1–20 min (basal) and 21–40 min (treatment).
Measurement of mitochondrial membrane potential
The fluorescent indicator 5,5′,6,6′‐tetrachloro‐1,1′,3,3′‐tetraethylbenzimidazolylcarbocyanine iodide (JC‐1) was used to measure mitochondrial membrane potential (Ψm) as described previously (Viola et al. 2007). The fluorescence signal was measured on a Hamamatsu Orca ER digital camera attached to an inverted Nikon TE2000‐U microscope. Fluorescent images were taken at 2 min intervals with 50 ms exposure. Metamorph 6.3 was used to quantify the signal by manually tracing myocytes. An equivalent region not containing cells was used as background and was subtracted. The 580 nm/535 nm ratiometric fluorescence values recorded over 6 min before and 4 min after addition of drugs were averaged and alterations in fluorescent ratios reported as the percentage increase from the basal average. To confirm that the JC‐1 signal was indicative of Ψm, 40 mm NaCN was added at the end of each experiment to collapse Ψm. In addition, individual 580 and 535 nm signals were assessed in each experiment to determine whether the fluorescent indicator was accurately measuring Ψm. For calcium‐free experiments, cells were exposed to Ca2+‐free HBS (supplemented with 3 mm EGTA and 200 nm JC‐1) for at least 3 h before measuring changes in Ψm.
Measurement of mitochondrial flavoprotein oxidation
Flavoprotein autofluorescence was used to measure flavoprotein oxidation based on previously described methods (Yaniv et al. 2011). Fluorescence at excitation 480 nm and emission 535 nm was measured on a Hamamatsu Orca ER digital camera attached to an inverted Nikon TE2000‐U microscope. Fluorescent images were taken at 1 min intervals with 1.5 s exposure. Metamorph 6.3 was used to quantify the signal by manually tracing myocytes. An equivalent region not containing cells was used as background and was subtracted. Fluorescence values recorded over 5 min before and 5 min after addition of drugs were averaged and alterations in fluorescent ratios reported as the percentage increase from the basal average. FCCP (50 μm) was added at the end of each experiment to achieve a maximal fluorescence value indicative of maximal flavoprotein oxidation.
MTT assay
The rate of cleavage of tetrazolium salt (MTT) to formazan by the mitochondrial electron transport chain was measured spectrophotometrically as previously described (Viola et al. 2009, 2014). Reduction of 3‐(4,5‐dimethyl‐2‐thiazolyl)‐2,5‐diphenyl‐2H‐tetrazolium bromide (MTT) is dependent upon the presence of NADH and NADPH, as well as intact mitochondrial electron transport (Berridge & Tan, 1993). Reduction of MTT occurs predominantly at the mitochondria in cardiomyocytes (Grazette et al. 2004). The basis for this assay is the cleavage of the yellow tetrazolium salt (MTT) to purple formazan crystals by the electron transport chain within the mitochondria (Mosmann, 1983). An increase in absorbance represents an increase in formazan production and therefore an increase in metabolic activity. Myocytes in suspension in 96‐well plates were treated with relevant agonists/antagonists. MTT was then added to each well (final concentration 0.5 mg ml−1). The rate of increase in absorbance was measured immediately using a spectrophotometer (PowerWave XS) at 570 nm with a reference wavelength of 620 nm at 37°C. The rate of increase in absorbance of treated myocytes was expressed as a percentage of the rate of increase in absorbance of untreated myocytes. Each n represents the number of replicates for each treatment group from myocytes isolated from a total of four cTnI‐G203S and four wt hearts.
Extraction of L‐type Ca2+ channel protein from membrane fractions
Membrane fractions were prepared from crude heart homogenates as previously described (Sun et al. 2006). Ventricular tissue was homogenized three times for 5 s each time at 22,000g on ice in a buffer containing (mm): 300 sucrose, 20 imidazole‐hydrochloride (pH 7.0), 1 EDTA and an EDTA‐free protease inhibitor tablet. Homogenates were centrifuged for 15 min at 3800g at 4°C and the supernatant was ultra centrifuged for 2 h at 100,000g at 4°C. The pellet was resuspended on ice in 1.5 ml of buffer containing (mm): 600 KCl, 300 sucrose, 20 imidazole‐hydrochloride (pH 7.0), 1 EDTA, 0.025 leupeptin and 0.25 Pefabloc. The resuspended pellet was incubated on ice for 1 h, then placed in the ultracentrifuge for 2 h at 100,000g at 4°C. The membrane fraction was obtained by resuspension of the pellet in 0.5 ml of homogenization buffer.
Immunoblot of L‐type Ca2+ channel protein
Immunoblots were performed as previously described (Tang et al. 2011; Viola et al. 2014). ICa‐L protein was treated with sample buffer (62.5 mm Tris‐HCl, pH 6.8, 2% SDS, 10% glycerol, 100 mm DTT, 0.002% Bromophenol Blue) for 45 min at room temperature. Sample proteins were separated on a 10% SDS‐PAGE pH 8.8, at 25 V until the dye front passed through the stacking gel, then at 120 V until the dye front ran off the bottom of the gel. Proteins were electrophoretically transferred from the SDS‐PAGE to a nitrocellulose membrane (Hybond ECL 0.45 mm; GE HealthCare Life Sciences) in transfer buffer (40 mm Tris‐Cl, 20 mm sodium acetate, 2 mm EDTA, 0.15% SDS and 5% methanol, pH 7.4) at 4°C for 5 h, 45 V, 0.9 A, 100 W (L‐type Ca2+ channel) or 1 h, 20 V, 0.2 A, 100 W (porin). Following transfer, the membrane was incubated in blocking buffer (5% BSA and 0.05% Tween‐20 in PBS, pH 7.5) for 1 h at room temperature. The membrane was then incubated with primary antibody overnight at 4°C. Primary antibodies used were anti‐CaVpan α1 subunit antibody (ACC‐004; Alomone Labs; 1:400 dilution), anti‐CaV β2 subunit antibody (ACC‐105; Alomone Labs; 1:400 dilution) or anti‐porin antibody (ab14734; Abcam; 1:1000 dilution). Following incubation with primary antibodies, membranes were rinsed three times for 10 min then incubated with secondary antibody for 1 h at room temperature. Secondary antibodies used were goat anti‐rabbit IgG (H+L)‐HRP conjugate (ab97051; Abcam; 1:10,000 dilution) or goat anti‐mouse IgG (H+L)‐HRP conjugate (172‐1011; Bio‐Rad; 1:10,000 dilution). Signal was detected using Luminata Crescendo Western HRP Substrate (Merck‐Millipore) and visualized using a Bio‐Rad gel documentation system. Expression of α1 subunit protein or β2 subunit protein was normalized for lane loading against porin using quantitative densitometry. No difference in expression of porin was measured between wt hearts (n = 3) and cTnI‐G203S hearts (n = 3).
Immunoprecipitation of L‐type Ca2+ channel protein
Immunoprecipitation of ICa‐L protein was performed as previously described (Nichols et al. 2010; Viola et al. 2014). One milligram of ICa‐L protein was diluted into 500 μl of immunoprecipitation (IP) buffer containing (mm): 10 Na2HPO4.2H2O, 150 NaCl, 5 EGTA, 5 EDTA, 5 NaF, 0.1% Triton X‐100 and an EDTA‐free mini‐protease inhibitor tablet (added immediately before use). Four micrograms of anti‐CaV pan‐α1 subunit antibody (ACC‐004; Alomone Labs) was added to the protein–IP buffer mix and incubated overnight at 4°C. Following overnight incubation, 100 μl PureProteome™ Protein G Magnetic Beads were washed according to the manufacturer's instructions (Millipore, Billerica, MA, USA), added to the protein–IP buffer mix and incubated for 10 min at room temperature with continuous stirring to capture the protein–antibody complex. The beads were then allowed to migrate towards a magnetic stand, upon which supernatant was removed, and beads were washed three times with 500 μl PBS containing 0.1% Tween 20. Following the last wash, 60 μl of 0.2 m glycine (pH 2.5; elution buffer) was added to the beads and incubated for 2 min at room temperature. The beads were then allowed to migrate towards a magnetic stand, upon which supernatant was removed and neutralized by adding 5 μl 1 m Tris (pH 8.5). As a control, the immunoprecipitation process was also performed on ICa‐L protein in the absence of anti‐CaVpan α1 subunit antibody.
Mass spectrometry analysis of immunoprecipitated L‐type Ca2+ channel protein
Mass spectrometric analysis was carried out on immunoprecipitated ICa‐L protein from four wt and four cTnI‐G203S hearts at the Bioanalytical Mass Spectrometry Facility, University of New South Wales, Australia. Gels that contained protein bands of interest for mass spectrometric analysis were first washed with deionized water for 5 min. The bands of interest were excised using a fresh scalpel blade, with excision being made as close as possible to the boundary of the band. Gel pieces were then placed into a 1.5 ml screwcap tube, with a small amount of liquid left to keep the gel slice hydrated. Coomassie stain was removed by incubating gel bands in 200 μl NH4HCO3 (25 mm) in acetonitrile (ACN) until clear. After removal of the solvent, the bands were incubated with 40 μl iodoacetamide (25 mm) in NH4HCO3 (50 mm) for 30 min at 37°C. The bands were then washed with 50 μl ACN twice, for 10 min each, and 40 μl trypsin (∼100 ng) in NH4HCO3 (20 mm) was added, after which the solution was incubated at 37°C for 14 h. The bands were then washed with 50 μl deionized water with 1% v/v formic acid and 100 μl of ACN for 15 min. The extracted peptides were then dried and dissolved in 10 μl deionized water with 0.05% v/v heptafluorobutyric acid and 0.1% v/v formic acid.
Digested peptides were separated by nano‐LC using an Ultimate 3000 HPLC and autosampler system (Dionex, Amsterdam, The Netherlands). Samples (2.5 μl) were concentrated and desalted onto a micro‐C18 precolumn (300 μm × 5 mm; Dionex) with H2O:CH3CN (98:2, 0.05% trifluoroacetic acid) at 15 μl min−1. After a 4 min wash, the pre‐column was switched (Valco 10 port valve; Dionex) into line with a fritless nano‐column (75 μm × ∼10 cm) containing C18 media (1.9 μm, 120 Å; Dr Maisch, Ammerbuch‐Entringen, Germany) manufactured according to previously described methods (Gatlin et al. 1998). Peptides were eluted using a linear gradient of H2O:CH3CN (98:2, 0.1 % formic acid) to H2O:CH3CN (64:36, 0.1% formic acid) at 200 nl min−1 over 30 min. High voltage (2000 V) was applied to low‐volume tee (Upchurch Scientific) and the column tip positioned ∼0.5 cm from the heated capillary (T = 275°C) of an Orbitrap Velos mass spectrometer (Thermo Electron, Bremen, Germany). Positive ions were generated by electrospray, and the Orbitrap operated in data‐dependent acquisition mode.
A survey scan m/z 350–1750 was acquired in the Orbitrap (resolution = 30,000 at m/z 400, with an accumulation target value of 1,000,000 ions) with lockmass enabled. Up to the 10 most abundant ions (>4000 counts) with charge states >+2 were sequentially isolated and fragmented within the linear ion trap using collisionally induced dissociation with an activation q = 0.25 and activation time of 30 ms at a target value of 30,000 ions. The m/z ratios selected for MS/MS were dynamically excluded for 30 s. All MS/MS spectra were searched against NCBI database using MASCOT (version 2.3; Matrix Science, London, UK) with the following search criteria: enzyme specificity was trypsin; precursor and product ion tolerances were at 4 p.p.m. and ±0.4 Da, respectively; variable modification of methionine oxidation; and one missed cleavage was allowed. The ions score significance threshold was set to 0.5, and each protein was provided with a probability‐based Mowse (Molecular Weight Search) score. Rigorous practices were implemented to ensure that protein or peptide ‘carry‐over’ did not occur. This included running standards before each sample to ensure that a clean and correctly optimized system was used for each sample; injecting samples in the order of low to high protein concentration; running three technical repeats of each sample; and avoiding over‐injection of samples. For this study, 5 μl of sample was assessed for each mass spectrometry run. Non‐specific proteins identified from mass spectrometry analysis performed on control immunoprecipitated L‐type Ca2+ channel protein (in the absence of anti‐CaVpan α1 subunit antibody) were disregarded. Spectra have been provided for α1C and α2δ subunits of the ICa‐L, and mitochondrial voltage‐dependent anion channel (VDAC), that exhibit single peptide‐based identifications (Supporting information Table S1).
Mitochondrial respiration studies and DNA copy number
Mitochondrial respiration was measured in mitochondria isolated from three pooled wt mouse hearts and three pooled cTnI‐G203S mouse hearts (Davies et al. 2001). Approximately 2 mg of mitochondria was resuspended in 0.25 ml mitomedium B [containing (mm): 0.5 EGTA, 3 MgCl2, 20 taurine, 10 KH2PO4, 20 Hepes, 60 lactobionate, 110 mannitol, 0.3 DTT and 1 g l−1 fatty acid‐free BSA; pH adjusted to 7.1 with KOH] and added to 0.5 ml mitomedium B in a 1 ml OROBOROS high‐resolution respirometer thermostatically maintained at 37°C. The system was left to equilibrate for 5 min for the oxygen consumption to decline. Respiration on 0.5 mm N,N,N',N'‐Tetramethyl‐p‐Phenylenediamine and 2 mm ascorbate was measured in the permeabilized membranes. All respiration data are normalized to mitochondrial protein content. Mitochondrial DNA copy number was determined by qRT‐PCR as previously described (Ruzzenente et al. 2012).
Tissue preparation for transmission electron microscopy
Tissue samples were fixed and then rinsed in sodium cacodylate (0.1 m, pH 7.4) before being postfixed in 1% osmium tetroxide. Samples were then dehydrated through graded alcohol and propylene oxide before embedding in epoxy resin. Tissue was sectioned on an Ultratome NOVA microtome. Ultrathin sections were collected onto copper grids and stained with uranyl acetate and then Reynold's lead citrate. Samples were imaged at 120 kV on a JEOL JEM‐2100 electron microscope.
Echocardiography
Echocardiographic studies to measure left ventricular function were performed on mice under light methoxyflurane anaesthesia with the use of an i13L probe on a Vivid 7 Dimension (GE Healthcare). Echocardiographic measurements were taken in M mode in triplicate from separate mice. The quantitative measurements represent the average of 25‐ to 30‐week‐old wt (n = 6) and cTnI‐G203S (n = 5) mice, and 10‐ to 15‐week‐old wt (n = 3) and cTnI‐G203S (n = 3) mice. The M mode recordings were made at a sweep speed of 200 mm s−1. Measurements of left ventricular end‐diastolic diameter (LVEDD), left ventricular end‐systolic diameter (LVESD), fractional shortening (FS), left ventricular posterior wall in diastole (LVDPW), left ventricular posterior wall in systole (LVSPW), intraventricular septum in diastole (IVDS), intraventricular septum in systole (IVSS) and end‐diastolic diameter (EDD) were made. Fractional shortening was calculated by the formula [(LVEDD − LVESD)/EDD] × 100. The ratio of heart weight to body weight was calculated by dividing the weight of excised, blotted hearts by the total mouse body weight.
Statistical analysis
Results are reported as means ± SEM or means ± SD where indicated. Statistical significance was accepted at P < 0.05 using either Student's unpaired t test or two‐way ANOVA for unbalanced data (Prism version 5.04, GraphPad, San Diego, CA, USA).
Results
Myocytes isolated from cTnI‐G203S hearts exhibit altered ICa‐L inactivation kinetics
Using the patch‐clamp technique, we measured ICa‐L currents in myocytes isolated from hearts of cTnI‐G203S mice. In cTnI‐G203S myocytes, the inactivation of the current was significantly faster compared with wt myocytes (cTnI‐G203S: τ1 = 40.68 ± 3.22 ms and τ2 = 10.86 ± 0.76 ms, n = 10 vs. wt: τ1 = 59.05 ± 6.40 ms and wt: τ2 = 17.46 ± 2.46 ms, n = 6, P < 0.05; Fig. 1 A and B). Similar results were obtained when barium was used as the charge carrier (Fig. 1 I and J). However, no difference in ICa‐L current density was recorded in myocytes from cTnI‐G203S vs. wt myocytes (cTnI‐G203S: 4.09 ± 0.40 pA pF−1, n = 10 vs. wt: 4.42 ± 0.40 pA pF−1, n = 6, P = n.s.) (Fig. 1 C, G and K). These data indicate that channel expression is not altered in cTnI‐G203S myocytes. Densitometry analysis of immunoblots of ICa‐L protein isolated from hearts of cTnI‐G203S mice probed with anti‐Cavpan α1C subunit antibody confirmed that there was no increase in channel expression in cTnI‐G203S hearts (Fig. 2 A and C). Consistent with a faster inactivation rate, we found that the inactivation integral of current and total integral of current were significantly less in cTnI‐G203S vs. wt myocytes (Fig. 1 D and E). The activation integral of current in cTnI‐G203S myocytes was also significantly less compared with wt myocytes (Fig. 1 F). No difference in steady‐state inactivation was observed between cTnI‐G203S and wt myocytes (Fig. 1 H).
Figure 1. Myocytes isolated from cTnI‐G203S hearts exhibit altered inactivation kinetics .

A, representative L‐type Ca2+ (ICa‐L) current traces from cTnI‐G203S (120 pF) and wt myocytes (120 pF). Inset: pulse protocol. Mean ± SEM of rate of inactivation (τ, calculated bi‐exponentially; B), current density (C), 50 ms inactivation integral of current (D), total integral of current (E) and activation integral of current (F) for cTnI‐G203S myocytes and wt myocytes. G, current–voltage (I–V) relationship measured in cTnI‐G203S (n = 10) and wt myocytes (n = 7; P = n.s.). Inset above: pulse protocol. H, voltage dependency of steady‐state inactivation measured in cTnI‐G203S (n = 10) and wt myocytes (n = 7; P = n.s.). Inset above: pulse protocol. I, representative ICa‐L current traces recorded from cTnI‐G203S (95 pF) and wt myocytes (90 pF) with barium as the charge carrier. Inset above: pulse protocol. Mean ± SEM of rate of inactivation (τ; J) and current density (K) for cTnI‐G203S myocytes and wt myocytes with barium as the charge carrier. n, number of myocytes.
Figure 2. Immunoblot analysis of L‐type Ca2+ channel α1C and β2 subunit protein expression .
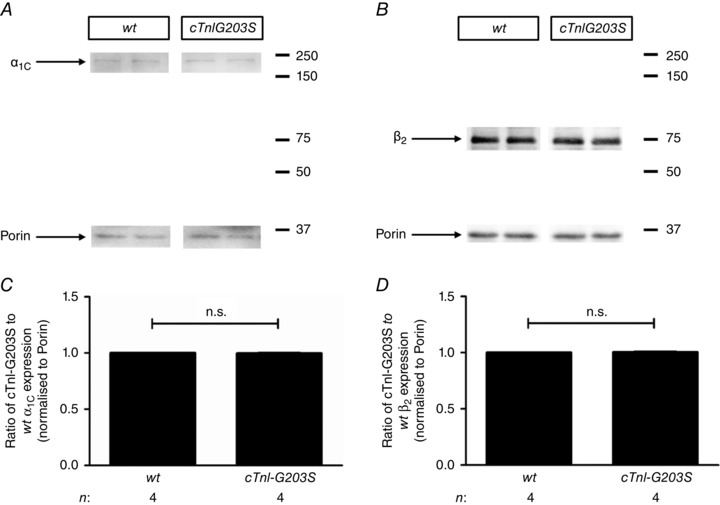
L‐type Ca2+ channel (ICa‐L) protein was extracted and pooled from three 25‐ to 30‐week‐old wt hearts and and three 25‐ to 30‐week‐old cTnI‐G203S hearts. A and B, representative immunoblots of ICa‐L protein extracted from wt and cTnI‐G203S hearts probed with ICa‐L α1C subunit antibody (α1C) and porin monoclonal antibody (A) or β2 subunit antibody (β2) and porin monoclonal antibody (B). Four experimental repeats were run against α1C and porin, or β2 and porin for both wt and cTnI‐G203S. C and D, densitometry analysis of α1C (C) and β2 (D) protein expression for wt and cTnI‐G203S presented as a ratio of wt α1C and β2 protein expression, respectively, each normalized to associated porin expression.
The β2 subunit of ICa‐L is bound to the α1C subunit of the channel and plays an important role in ICa‐L kinetics (Dolphin, 2003). We probed immunoblots of ICa‐L protein with an antibody directed against the β2 subunit of ICa‐L (Fig. 2 B and D). No significant change in β2 subunit expression was observed in cTnI‐G203S vs. wt hearts. Given that the β2 subunit of ICa‐L is tethered to F‐actin filaments that also tightly regulate the function of the channel (Lader et al. 1999; Rueckschloss & Isenberg, 2001; Hohaus et al. 2002), cytoskeletal architecture rather than β2 subunit expression may be involved in altered inactivation of ICa‐L in cTnI‐G203S myocytes.
Wild‐type and cTnI‐G203S cardiac myocytes exhibit similar alterations in [Ca2+]i and mitochondrial superoxide production following activation of the L‐type Ca2+ channel
We measured [Ca2+]i in quiescent myocytes isolated from cTnI‐G203S hearts with consistent ATP utilization because this allowed us more readily to explore the effects of channel activation on mitochondrial function. We found no difference in resting [Ca2+]i in cTnI‐G203S vs. wt myocytes (Fig. 3 A and B). Application of BayK(−) resulted in a significant increase in [Ca2+]i in cTnI‐G203S and wt myocytes (Fig. 3 A and B). The increases in [Ca2+]i were similar, consistent with no difference in channel expression or peak Ca2+ influx in cTnI‐G203S myocytes (Figs 1 and 2). In cTnI‐G203S and wt myocytes, the increase in [Ca2+]i in response to BayK(−) could be prevented by application of ICa‐L antagonist nisoldipine but was unaffected by the ryanodine receptor antagonist ryanodine (5 μm), indicating that the source of Ca2+ was ICa‐L (Fig. 3 B). Myocytes were also exposed to the (+)enantiomer of BayK that does not act as an agonist [BayK(+)]. Application of BayK(+) did not significantly alter [Ca2+]i in cTnI‐G203S or wt myocytes (Fig. 3 A and B).
Figure 3. Wild‐type and cTnI‐G203S cardiac myocytes exhibit similar alterations in intracellular Ca2+ concentrations and mitochondrial superoxide production following activation of the L‐type Ca2+ channel .

A, representative traces of intracellular calcium recorded in wt and cTnI‐G203S myocytes before and after exposure to 10 μm BayK(−) or BayK(+). Vertical arrow indicates when drug was added. B, mean ± SEM of intracellular Ca2+ for all myocytes exposed to treatments as indicated. Abbreviations: Nisol, 15 μm nisoldipine; RyR, 5 μm ryanodine. C, representative traces of DHE fluorescence recorded in wt and cTnI‐G203S myocytes before and after exposure to 10 μm BayK(−) or BayK(+). Addition of drugs is indicated by the vertical arrow. Slopes of signals are as indicated. D, mean ± SEM of changes in DHE fluorescence for all myocytes exposed to treatments as indicated. Abbreviations: Nisol, 15 μm nisoldipine; 2 μm Ru360; Myx, 7 nm myxothiazol; n, number of myocytes.
We have previously demonstrated that an increase in mitochondrial superoxide production occurs as a result of increased activation of ICa‐L (and an associated rise in intracellular calcium) in isolated cardiac myocytes (Viola et al. 2007, 2009). Therefore, we measured cellular superoxide production in myocytes isolated from cTnI‐G203S hearts before and after activation of ICa‐L with BayK. We found no difference in resting superoxide production in cTnI‐G203S vs. wt myocytes (assessed as changes in DHE fluorescence; Fig. 3 C and D). Application of BayK(−) resulted in a significant increase in superoxide production in cTnI‐G203S and wt myocytes (Fig. 3 C and D). The increases in superoxide production were similar. In cTnI‐G203S and wt myocytes, the increase in superoxide production in response to BayK(−) could be prevented by application of nisoldipine, the mitochondrial Ca2+ uniporter blocker Ru360 and complex III inhibitor myxothiazol (7 nm; Fig. 3 D), indicating that the source of superoxide was mitochondrial. Application of BayK(+) did not significantly alter superoxide production in cTnI‐G203S or wt myocytes (Fig. 3 C and D). Therefore, we conclude that α‐induced changes in Ca2+ and superoxide production do not appear to differ in cTnI‐G203S hearts.
cTnI‐G203S cardiac myocytes exhibit a significantly larger increase in Ψm in response to activation of the L‐type Ca2+ channel
Elevated mitochondrial calcium concentrations are associated with an increase in Ψm; however, Ψm can function independent of changes in [Ca2+]i in the range of 0–400 nm (Territo et al. 2000). We have previously shown that incubating guinea‐pig ventricular myocytes in Ca2+‐free and EGTA‐containing Hepes‐buffered solution for at least 3 h, followed by intracellular perfusion with EGTA and BAPTA to deplete [Ca2+]i stores, does not alter the increase in Ψm following activation of ICa‐L (Viola et al. 2009). We have also shown that the response is dependent on an intact cytoskeletal architecture because depolymerization of actin with latrunculin A attenuates the increase in Ψm following activation of ICa‐L (Viola et al. 2009).
We examined whether alterations in Ψm in response to BayK(−) were calcium dependent in cTnI‐G203S myocytes. We incubated myocytes in Ca2+‐free and EGTA‐containing HBS (Ca2+‐free HBS) for at least 3 h. In Ca2+‐free HBS, application of BayK(−) resulted in a significant increase in Ψm in cTnI‐G203S and wt myocytes, assessed as changes in JC‐1 fluorescence (Fig. 4 A–C). The ratio of the increase in Ψm was significantly larger in cTnI‐G203S vs. wt myocytes (Fig. 4 D). The responses were similar to those recorded in 2.5 mm calcium‐containing HBS (Fig. 4 A–C insets). In cTnI‐G203S and wt myocytes, the increase in Ψm in response to BayK(−) could be prevented by application of ICa‐L antagonists nisoldipine and diltiazem (Fig. 4 A–C). Application of BayK(+) did not significantly alter Ψm in cTnI‐G203S or wt myocytes (Fig. 4 A–C). A collapse in JC‐1 signal after exposure of myocytes to NaCN demonstrated that the signal was indicative of Ψm. These data indicate that activation of ICa‐L results in a significantly greater increase in Ψm in myocytes isolated from cTnI‐G203S hearts compared with wt myocytes and that the response does not require Ca2+.
Figure 4. cTnI‐G203S cardiac myocytes exhibit a significantly larger increase in Ψm in response to activation of the L‐type Ca2+ channel compared with wt myocytes .

Representative traces of ratiometric JC‐1 fluorescence recorded in wt (A) and cTnI‐G203S (B) myocytes before and after exposure to 10 μm BayK(+) or BayK(−) with or without 15 μm nisoldipine (Nisol) or 15 μM diltiazem (Dilt) in Ca2+‐free conditions (0 mm Ca2+). Vertical arrow indicates addition of drugs. Abbreviation: NaCN, 40 mm sodium cyanide. Insets show representative ratiometric JC‐1 fluorescence recorded in wt (A) and cTnI‐G203S (B) myocytes exposed to BayK(+) and BayK(−) in the presence of 2.5 mm calcium. C, mean ± SEM of JC‐1 fluorescence for all myocytes exposed to treatments as indicated. Inset shows mean ± SEM of JC‐1 fluorescence for all myocytes exposed to treatments in the presence of 2.5 mm calcium. D, ratio of increase in JC‐1 fluorescence after addition of BayK(−) for wt and cTnI‐G203S myocytes compared with wt BayK(+) response. n, number of myocytes.
cTnI‐G203S cardiac myocytes exhibit a significantly larger increase in metabolic activity in response to activation of the L‐type Ca2+ channel
We examined changes in mitochondrial electron transport and oxygen consumption by measuring alterations in flavoprotein oxidation (as autofluorescence) in myocytes isolated from cTnI‐G203S hearts in response to activation of ICa‐L. Application of BayK(−) resulted in a significant increase in flavoprotein oxidation in cTnI‐G203S and wt myocytes (Fig. 5 A–C). However, the ratio of the increase in flavoprotein oxidation was significantly larger in cTnI‐G203S vs. wt myocytes (Fig. 5 D). In cTnI‐G203S and wt myocytes, the increase in flavoprotein oxidation in response to BayK(−) could be prevented by application of nisoldipine (Fig. 5 C). Application of BayK(+) did not significantly alter flavoprotein oxidation in cTnI‐G203S or wt myocytes (Fig. 5 C). FCCP was added at the end of each experiment to achieve a maximal fluorescence value indicative of maximal flavoprotein oxidation (Fig. 5 A–C).
Figure 5. cTnI‐G203S cardiac myocytes exhibit a significantly larger increase in metabolic activity in response to activation of the L‐type Ca2+ channel compared with wt myocytes .

A and B, representative traces of flavoprotein fluorescence recorded in wt (A) and cTnI‐G203S (B) myocytes before and after exposure to 10 μm BayK(−) or BayK(+). Addition of drugs is indicated by the arrow. Abbreviation: FCCP, 50 μm carbonyl cyanide‐4‐(trifluoromethoxy)phenylhydrazone. C, mean ± SEM of flavoprotein fluorescence for all myocytes exposed to treatments as indicated. Abbreviation: Nisol, 15 μm nisoldipine. D, ratio of increase in flavoprotein fluorescence after addition of BayK(−) for wt and cTnI‐G203S myocytes compared with wt BayK(+) response. n, number of myocytes. E, formation of formazan measured as the change in absorbance in wt and cTnI‐G203S myocytes after addition of 10 μm BayK(+) or BayK(−). F, mean ± SEM of increases in absorbance for all myocytes exposed to treatments as indicated. Abbreviations: Nisol, 10 μm nisoldipine; 5 μm Ru360; 5 μm ryanodine; Oligo, 20 μm oligomycin. G, ratio of increase in formation of formazan after addition of BayK(−) for wt and cTnI‐G203S myocytes compared with wt BayK(+) response. n represents the number of replicates for each treatment group.
We examined whether activation of ICa‐L altered metabolic activity in myocytes isolated from cTnI‐G203S hearts. Consistent with previous results (Viola et al. 2009), exposure of cardiac myocytes to BayK(−) caused a significant increase in metabolic activity (assessed as formation of formazan from tetrazolium salt) in myocytes isolated from wt hearts (Fig. 5 E and F). Application of BayK(−) also caused a significant increase in metabolic activity in cTnI‐G203S myocytes (Fig. 5 E and F). However, the ratio of the increase in metabolic activity was significantly larger in cTnI‐G203S vs. wt myocytes (Fig. 5 G). In cTnI‐G203S and wt myocytes, the increase in metabolic activity in response to BayK(−) could be prevented by application of nisoldipine or Ru360, but not ryanodine (Fig. 5 F). Application of BayK(+) did not significantly alter metabolic activity in cTnI‐G203S or wt myocytes (Fig. 5 E and F). Application of the ATP synthase blocker oligomycin caused a significant decrease in metabolic activity in cTnI‐G203S and wt myocytes, indicating that the cells were metabolically active (Fig. 5 F). These data suggest that activation of ICa‐L results in a significantly greater increase in metabolic activity in myocytes isolated from cTnI‐G203S hearts compared with wt myocytes.
Elevated Ψm in response to activation of the L‐type Ca2+ channel involves F‐actin and mitochondrial VDAC in cTnI‐G203S cardiac myocytes
The β2 subunit of the ICa‐L is tightly bound to F‐actin (Hohaus et al. 2002). Mitochondria also associate with F‐actin (Drubin et al. 1993; Morris & Hollenbeck, 1995; Levine et al. 2000). We have previously demonstrated that ICa‐L regulates mitochondrial function as the result of an association between the channel and the mitochondria via the cytoskeletal protein F‐actin (Viola et al. 2009, 2014). Here, we examined whether alterations in Ψm in response to BayK(−) were dependent upon F‐actin in cTnI‐G203S myocytes. We exposed myocytes to the F‐actin depolymerizing agent latrunculin A for 20 min. In calcium‐free HBS, the increase in Ψm in response to BayK(−) was significantly decreased in cTnI‐G203S and wt myocytes (Fig. 6 A and B), suggesting that elevated Ψm in response to activation of ICa‐L is dependent on F‐actin in cTnI‐G203S myocytes.
Figure 6. Regulation of mitochondrial membrane potential (Ψm) by the L‐type Ca2+ channel involves F‐actin and mitochondrial voltage‐dependent anion channel (VDAC) .

A, representative traces of ratiometric JC‐1 fluorescence recorded from wt and cTnI‐G203S myocytes before and after addition of 10 μm BayK(−) in the presence or absence of 5 μm latrunculin A (Latrunc) in calcium‐free conditions (0 mm Ca2+). Vertical arrow indicates when drug was added. Abbreviation: NaCN, 40 mm sodium cyanide. B, mean ± SEM of JC‐1 fluorescence for all myocytes exposed to treatments as indicated. n, number of myocytes. C, exposure of wt myocytes to an inhibitor of actin–myosin interaction mimics the increase in Ψm observed in cTnI‐G203S myocytes. Representative traces of ratiometric JC‐1 fluorescence recorded from wt and cTnI‐G203S myocytes before and after exposure to BayK(−) with or without 10 μm blebbistatin (Blebb) in 0 mm Ca2+ conditions. D, mean ± SEM of JC‐1 fluorescence for all myocytes exposed to treatments as indicated. E, exposure of wt myocytes to a peptide that blocks VDAC mimics the increase in Ψm observed in cTnI‐G203S myocytes. Representative traces of ratiometric JC‐1 fluorescence recorded from wt and cTnI‐G203S myocytes before and after exposure to BayK(−), 10 μm VDAC peptide (VDAC) or 10 μm VDAC scrambled peptide [VDAC (S)] in 0 mm Ca2+ conditions. Inset shows ratiometric JC‐1 fluorescence recorded from cTnI‐G203S myocytes before and after exposure to BayK(−) plus VDAC. F, mean ± SEM of JC‐1 fluorescence for all myocytes exposed to treatments as indicated. G and H, ICa‐L associates with mitochondrial VDAC via cytoskeletal proteins. Mass spectrometry analysis of immunoprecipitated ICa‐L protein from wt (n = 4) and cTnI‐G203S (n = 4) hearts. Abbreviations: AKAP, A‐kinase anchor protein; CaMKII, Ca2+/calmodulin‐dependent protein kinase II; LTCC, L‐type Ca2+ channel; MAPK, mitogen‐activated protein kinase; PKC, protein kinase C; TK, tyrosine kinase; VDAC, voltage‐dependent anion channel.
There is good evidence that the cTnI‐G203S mutation is associated with enhanced actin–myosin cross‐bridge cycling (Kohler et al. 2003; Parmacek & Solaro, 2004). We investigated the role of dynamic movement of actin in regulation of mitochondrial function by ICa‐L. We assessed alterations in Ψm in wt and cTnI‐G203S cardiac myocytes that were exposed to an inhibitor of actin–myosin interaction (blebbistatin, 10 μm; Dou et al. 2007). In these conditions, BayK(−) elicited an increase in Ψm in both wt and cTnI‐G203S myocytes (Fig. 6 C and D). Both responses were comparable to the increase observed in cTnI‐G203S cardiac myocytes in response to BayK(−) only. These data suggest that elevated Ψm in response to activation of ICa‐L is associated with a lack of dynamic movement of actin–myosin in cTnI‐G203S myocytes.
Regulation of Ψm is in part dependent on the function of the mitochondrial VDAC (Das et al. 2008; Zhai & Sadoshima, 2008). The VDAC resides in the outer mitochondrial membrane and plays an important role in mitochondrial ATP/ADP trafficking and anion transport (Rostovtseva & Colombini, 1996; Crompton et al. 1998). We have previously demonstrated that directly blocking anion transport from the outer mitochondrial membrane mimics the effect of BayK(−) on Ψm (Viola & Hool, 2014; Viola et al. 2014). Here, we investigated whether regulation of Ψm by I Ca‐L involves the VDAC in cTnI‐G203S myocytes. We exposed myocytes to a peptide directed toward VDAC (VDAC peptide). In calcium‐free HBS, VDAC peptide elicited an increase in Ψm in both wt and cTnI‐G203S myocytes (Fig. 6 E and F). The responses were comparable to the increase in Ψm in response to BayK(−) in cTnI‐G203S myocytes. We also simultaneously exposed myocytes to both BayK(−) and VDAC peptide. BayK(−) and VDAC peptide elicited an increase in Ψm in both wt and cTnI‐G203S myocytes (Fig. 6 E and F). The responses were comparable to the increase in Ψm in response to BayK(−) or VDAC peptide alone in cTnI‐G203S myocytes. These data suggest that elevated Ψm in response to activation of ICa‐L is associated with block of VDAC anion transport in cTnI‐G203S myocytes.
We propose that ICa‐L alters metabolic activity through movement of cytoskeletal proteins. If this is true, then it is reasonable to assume that ICa‐L protein directly associates with cytoskeletal proteins. We analysed immunoprecipitated ICa‐L protein from wt and cTnI‐G203S hearts by mass spectrometry on a Velos Orbitrap. The α1C and α2δ subunits of ICa‐L were identified in immunoprecipitated ICa‐L protein from wt and cTnI‐G203S hearts (Fig. 6 G and H, and Supporting information Tables S2 and S3). An additional 957 and 950 proteins were also ‘pulled out’ from wt and cTnI‐G203S hearts. Thirteen per cent of proteins identified were cytoskeletal in origin (including F‐actin), whereas 13% were mitochondrial (including VDAC). Additionally, known regulators of ICa‐L function were identified, including β‐tubulin, Ca2+/calmodulin‐dependent protein kinase II and A‐kinase anchor protein (Galli & DeFelice, 1994; Lader et al. 1999; Nakamura et al. 2000; Rueckschloss & Isenberg, 2001; Hao et al. 2008; Nichols et al. 2010). These data confirm that ICa‐L associates with mitochondrial VDAC via cytoskeletal proteins, including F‐actin, and supports the notion that elevated Ψm in response to activation of ICa‐L is dependent on F‐actin and block of VDAC anion transport in cTnI‐G203S myocytes.
Oxygen consumption in mitochondria isolated from hearts of cTnI‐G203S and wt mice is similar
We isolated mitochondria from hearts of cTnI‐G203S and wt mice and assessed mitochondrial function and morphology. We did not observe differences in mitochondrial respiration between wt and cTnI‐G203S mice (Fig. 7 A), suggesting that alterations in mitochondrial function observed in cTnI‐G203S myocytes in the intact cell were cell intrinsic and not secondary to hypertrophic remodelling of the ventricle. Mitochondrial DNA copy number was increased in hearts from cTnI‐G203S mice (Fig. 7 B). In addition, analysis of TEM imaging demonstrated disordered mitochondrial distribution and increased mitochondrial size and density in cTnI‐G203S vs. wt hearts (Fig. 7 C–F). These data are consistent with our findings that mitochondrial function is significantly altered in cTnI‐G203S myocytes.
Figure 7. Respiration is normal but mitochondrial characteristics are altered in mitochondria isolated from cTnI‐G203S hearts .

A, respiration and mitochondrial electron transport chain complex activity in mitochondria isolated from 25‐ to 30‐week‐old wt and cTnI‐G203S hearts. Measurements were performed in triplicate. B, mitochondrial (Mt) DNA copy number in wt and cTnI‐G203S hearts, normalized to 18S rDNA. Data are represented as means ± SD. C and D, representative transmission electron microscopy sections from ventricles of wt (C) and cTnI‐G203S hearts (D). Abbreviations: M, mitochondria; S, sarcomere. Scale bars represent 0.5 μm. E, mitochondrial (Mt) surface area in wt and cTnI‐G203S hearts measured from 11 sections from each of four wt and four cTnI‐G203S hearts. F, number of mitochondria (Mt) per square micrometre determined from 11 sections from each of four wt and four cTnI‐G203S hearts.
cTnI‐G203S cardiac myocytes isolated from precardiomyopathic mice exhibit altered L‐type Ca2+ channel inactivation kinetics and a significantly larger increase in Ψm and mitochondrial electron transport in response to activation of the channel
To investigate whether the alterations in ICa‐L kinetics, Ψm and metabolic activity observed in myocytes isolated from 25‐ to 30‐week‐old cardiomyopathic mice occurred before or after the development of the cardiomyopathy, we assessed alterations in ICa‐L inactivation kinetics and mitochondrial responses in myocytes isolated from 10‐ to 15‐week‐old precardiomyopathic cTnI‐G203S hearts (assessed with echocardiography and measurements of heart weight to body weight ratio; Table 1; Tsoutsman et al. 2006). Using the whole‐cell patch‐clamp technique, we recorded ICa‐L currents in the myocytes (Fig. 8 A). The inactivation rate of the current was significantly faster in myocytes isolated from 10‐ to 15‐week‐old cTnI‐G203S mice vs. age‐matched wt myocytes (cTnI‐G203S: τ1 = 30.97 ± 3.80 ms, n = 5 vs. wt: τ1 = 49.79 ± 5.93 ms, n = 4, P < 0.05; Fig. 8 A and B), while no difference was observed in ICa‐L density (Fig. 8 C). These data were similar to results recorded in myocytes from 25‐ to 30‐week‐old cTnI‐G203S hearts, suggesting that altered ICa‐L inactivation kinetics precedes the development of cTnI‐G203S cardiomyopathy. Additionally, exposure of 10‐ to 15‐week myocytes to BayK(−) elicited a significantly larger ratio increase in Ψm in cTnI‐G203S vs. wt myocytes (Fig. 8 D–F). The responses could be prevented by application of ICa‐L antagonist nisoldipine. Exposure of myocytes from 10‐ to 15‐week‐old mice to BayK(−) also elicited a significantly larger increase in flavoprotein oxidation in cTnI‐G203S vs. wt myocytes (Fig. 8 G–I). These responses could also be prevented by application of nisoldipine. These data were similar to results recorded in myocytes from 25‐ to 30‐week‐old cTnI‐G203S hearts (Figs 4 and 5), suggesting that altered communication between ICa‐L and the mitochondria precedes the development of cTnI‐G203S cardiomyopathy.
Figure 8. cTnI‐G203S cardiac myocytes from young (10‐ to 15‐week‐old) precardiomyopathic mice exhibit altered inactivation kinetics and a significantly larger increase in Ψm and metabolic activity in response to activation of the L‐type Ca2+ channel compared with wt myocytes .
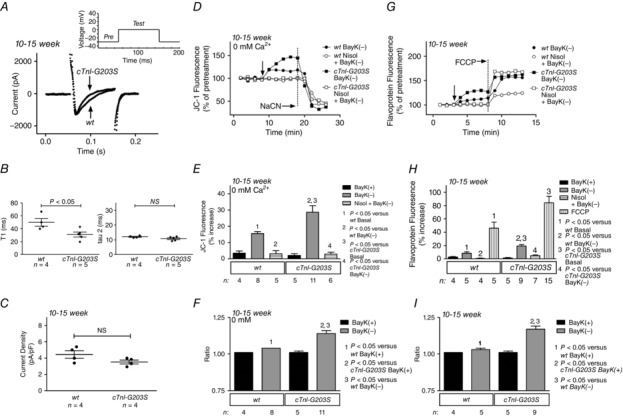
A, representative ICa‐L traces recorded from cTnI‐G203S (350 pF) and wt myocytes (400 pF). Inset: pulse protocol. B and C, mean ± SEM of rate of inactivation (τ, calculated bi‐exponentially; B) and current density (C) for cTnI‐G203S myocytes and cTnI‐G203S myocytes. D, representative traces of ratiometric JC‐1 fluorescence recorded in wt and cTnI‐G203S myocytes before and after exposure to 10 μm BayK(−) with or without 15 μm nisoldipine (Nisol) in Ca2+‐free conditions (0 mm Ca2+). Vertical arrow indicates when the drug was added. Abbreviation: NaCN, 40 mm sodium cyanide. E, mean ± SEM of JC‐1 fluorescence for all myocytes exposed to treatments as indicated. F, ratio of increase in JC‐1 fluorescence after addition of BayK(−) for wt and cTnI‐G203S myocytes compared with wt BayK(+) response. n, number of myocytes. G, representative traces of flavoprotein fluorescence recorded in wt and cTnI‐G203S myocytes before and after exposure to 10 μm BayK(−) or BayK(+). Addition of drugs is indicated by the arrow. FCCP: 50 μm. H, mean ± SEM of flavoprotein fluorescence for all myocytes exposed to treatments as indicated. Abbreviation: Nisol, 15 μm nisoldipine. I, ratio of increase in flavoprotein fluorescence after addition of BayK(−) for wt and cTnl‐G203S myocytes compared with wt BayK(+) response. wt, number of myocytes.
Discussion
The cytoskeletal environment plays an important role in stabilizing cell proteins and determining position. The cytoskeleton also influences protein function. The ICa‐L is anchored to F‐actin networks by subsarcolemmal stabilizing proteins that also tightly regulate the function of the channel (Lader et al. 1999; Rueckschloss & Isenberg, 2001; Hohaus et al. 2002). It is also proposed that docking proteins on mitochondria bind to cytoskeletal elements that are capable of mediating alterations in mitochondrial function (Rappaport et al. 1998; Capetanaki, 2002; Maloyan et al. 2005). We have previously demonstrated that ICa‐L influences metabolic activity through transmission of movement of the channel via cytoskeletal proteins (Viola et al. 2009). The Gly203Ser mutation in cardiac troponin I results in marked myofibre disarray and interstitial fibrosis (Tsoutsman et al. 2006). Here, we investigated whether ventricular myocytes isolated from cTnI‐G203S mice result in impaired communication between ICa‐L and mitochondria and, subsequently, altered metabolic function.
We found that myocytes from cTnI‐G203S hearts exhibited a more rapid inactivation of ICa‐L compared with myocytes isolated from wt hearts (Fig. 1). Based on our patch‐clamping and immunoblot data (Figs 1 and 2), this appears to occur as a result of the tethering of the channel to the cytoskeleton and is consistent with previous studies that have demonstrated that dissociation of microtubules or depolymerization of actin alters the inactivation rate of ICa‐L (Galli & DeFelice, 1994; Lader et al. 1999; Rueckschloss & Isenberg, 2001; Sadeghi et al. 2002). Peak inward current and current density were unchanged (Fig. 1). Channel expression was also not significantly altered (Fig. 2). Consistent with this and with previous findings (Tsoutsman et al. 2006), we found that basal and BayK(−)‐stimulated increases in [Ca2+]i did not differ in myocytes isolated from cTnI‐G203S hearts vs. wt hearts (Fig. 3 A and B). We also found that basal and BayK(−)‐stimulated increases in superoxide production did not differ in cTnI‐G203S vs. wt myocytes (Fig. 3 C and D). Therefore, the cTnI‐G203S mutation does not appear to be associated with significant changes in diastolic Ca2+ or oxidative stress in aged cTnI‐G203S hearts.
The cTnI‐G203S mutation results in reduced protein–protein interactions with cTnC and cTnT, leading to dysfunctional sarcomeres. Although diastolic Ca2+ does not appear to differ in cTnI‐G203S myocytes, we have previously found that Ca2+ cycling is abnormal as early as 8 weeks (Tsoutsman et al. 2006). Calcium uptake by sarco(endo)plasmic Ca2+‐ATPase appears to be altered, because a significant increase in the decay constant of calcium transients occurs in cTnI‐G203S myocytes. However, the release and storage of Ca2+ by the sarcoplasmic reticulum is normal (Tsoutsman et al. 2006). Therefore, in addition to altering sarcomere function, the cTnI‐G203S mutation appears to influence protein–protein interactions.
Production of ATP is dependent upon electron flow down the mitochondrial inner membrane and oxygen consumption. We demonstrated that cTnI‐G203S cardiac myocytes exhibited a significantly larger increase in Ψm in response to activation of ICa‐L compared with wt myocytes, which could be attenuated by ICa‐L antagonists nisoldipine and diltiazem (Fig. 4). These responses did not appear to require Ca2+. cTnI‐G203S myocytes also exhibited a significantly larger increase in flavoprotein oxidation and metabolic activity (Fig. 5) in response to activation of ICa‐L compared with wt myocytes. These data suggest that metabolic activity in cTnI‐G203S myocytes is significantly higher than in wt myocytes.
We demonstrated that this was dependent upon the environment in the intact cell, because respiration was normal in mitochondria isolated from hearts of 25‐ to 30‐week‐old cTnI‐G203S mice (Fig. 7). In support of this argument, previous studies in desmin‐null mice have demonstrated normal rates of maximal respiration in isolated mitochondria, but in vivo mitochondrial respiration was abnormal (Capetanaki, 2002). Given that alterations in mitochondrial function are observed in the intact myocyte but not in isolated mitochondria, we conclude that the intrinsic environment of the cell results in altered communication between ICa‐L and mitochondria, contributing to a hypermetabolic state in cTnI‐G203S hearts.
We also demonstrated that ICa‐L co‐immunoprecipitates with many cytoskeletal and mitochondrial proteins in the cTnI‐G203S heart, including F‐actin and mitochondrial VDAC (Fig. 6 G and H, and Supporting information Tables S2 and S3). The identities of the co‐immunoprecipitated proteins were similar between wt and cTnI‐G203S hearts, but our data indicate that they differ in their functional coupling. We found that the mutation in the cTnI gene led to alterations in protein–protein interactions through the cytoskeletal network. The β2 subunit of ICa‐L is tethered to F‐actin (Hohaus et al. 2002). Mitochondria also associate with actin (Drubin et al. 1993; Morris & Hollenbeck, 1995; Levine et al. 2000). Alterations in F‐actin have been demonstrated to alter ICa‐L and mitochondrial function (Rappaport et al. 1998; Lader et al. 1999; Nakamura et al. 2000; Rueckschloss & Isenberg, 2001). We demonstrated that elevated Ψm in response to activation of ICa‐L was dependent on cytoskeletal protein F‐actin in the cTnI‐G203S cardiac myocyte, because exposure of myocytes to the F‐actin depolymerizing agent latrunculin A attenuated the elevated Ψm in response to activation of ICa‐L (Fig. 6 A and B). We also demonstrated that elevated Ψm in response to activation of ICa‐L was associated with a lack of dynamic movement of actin–myosin in cTnI‐G203S myocytes, because inhibiting actin–myosin interaction with blebbistatin elicited an increase in Ψm in both wt and cTnI‐G203S myocytes in response to BayK(−) that was comparable to the increase in Ψm in response to BayK(−) alone in cTnI‐G203S myocytes (Fig. 6 C and D). Regulation of Ψm is also in part dependent on the function of VDAC (Das et al. 2008; Zhai & Sadoshima, 2008). We demonstrated that elevated Ψm in response to activation of ICa‐L was dependent on VDAC in cTnI‐G203S myocytes, because blocking anion transport via VDAC with a peptide directed toward VDAC elicited an increase in Ψm in both wt and cTnI‐G203S myocytes that was comparable to the increase in Ψm in response to BayK(−) alone in cTnI‐G203S myocytes (Fig. 6 E and F). We propose that altered functional communication between ICa‐L and mitochondria contributes to a hypermetabolic state in the cTnI‐G203S cardiac myocyte. This appears to involve a lack of dynamic movement of actin–myosin in cTnI‐G203S myocytes, and block of mitochondrial VDAC.
Furthermore, as similar responses are observed in cardiac myocytes isolated from young cTnI‐G203S hearts that have not yet established cardiomyopathy (Fig. 8), we conclude that altered communication between I Ca‐L and mitochondria may contribute to the pathophysiology. These data are the first to provide functional insight into the relationship between ICa‐L, the cTnI Gly203Ser gene mutation and phenotype. Given that alterations in ICa‐L kinetics, Ψm and metabolic activity occurred prior to the development of the cardiomyopathy, we propose that ICa‐L antagonists, such as diltiazem, might be effective in reducing the cardiomyopathy by normalizing mitochondrial metabolic activity.
Additional information
Competing interests
None declared.
Author contributions
H.V. performed all fura‐2, DHE, JC‐1, flavoprotein and MTT assays, patch‐clamp acquisition and analysis on aged hearts and assisted with writing the manuscript. V.J. performed JC‐1 and flavoprotein studies in young hearts. H.C.S. performed immunoblots on isolated channel protein. T.R. performed experiments involving mitochondrial DNA copy number and respiration. A.F. conceived and planned the mitochondrial experiments, and performed and interpreted the analyses of the data. T.T. bred cTnI‐G203S mice and performed genotyping to determine cTnI‐G203S‐positive animals. C.S. supervised breeding and provided cTnI‐G203S‐positive animals. L.H. assisted with analysis of patch‐clamp experiments in myocytes, conceived and planned the experiments and wrote the manuscript. All authors discussed and edited the manuscript. All authors approved the final version of the manuscript and agree to be accountable for all aspects of the work in ensuring that questions related to the accuracy or integrity of any part of the work are appropriately investigated and resolved. All persons designated as authors qualify for authorship, and all those who qualify for authorship are listed.
Funding
This study was supported by grants from the National Health and Medical Research Council of Australia (APP1023460, APP1041582 and 634501) and Australian Research Council. Livia Hool is an Australian Research Council Future Fellow (FT100100756) and National Health and Medical Research Council Senior Research Fellow (APP1002207). Aleksandra Filipovska is a National Health and Medical Research Council Senior Research Fellow (APP1058442). Helena Viola is recipient of a National Heart Foundation of Australia Postdoctoral Fellowship (PF 11P 6024). Tara Richman is a recipient of a National Health and Medical Research Council Dora Lush scholarship (APP1039101). Chris Semsarian is the recipient of a National Health and Medical Research Council Practitioner Fellowship (APP1059516).
Supporting information
Table S1. Additional data for single peptide‐based identifications from immunoprecipitated ICa‐L protein from wt and cTnI‐G203S hearts using mass spectrometry analysis.
Table S2. Peptides identified from immunoprecipitated ICa‐L protein from wt hearts using mass spectrometry analysis.
Table S3. Peptides identified from immunoprecipitated ICa‐L protein from cTnI‐G203S hearts using mass spectrometry analysis.
References
- Berridge MV & Tan AS (1993). Characterization of the cellular reduction of 3‐(4,5‐dimethylthiazol‐2‐yl)‐2,5‐diphenyltetrazolium bromide (MTT): subcellular localization, substrate dependence, and involvement of mitochondrial electron transport in MTT reduction. Arch Biochem Biophys 303, 474–482. [DOI] [PubMed] [Google Scholar]
- Capetanaki Y (2002). Desmin cytoskeleton: a potential regulator of muscle mitochondrial behavior and function. Trends Cardiovasc Med 12, 339–348. [DOI] [PubMed] [Google Scholar]
- Crompton M, Virji S & Ward JM (1998). Cyclophilin‐D binds strongly to complexes of the voltage‐dependent anion channel and the adenine nucleotide translocase to form the permeability transition pore. Eur J Biochem 258, 729–735. [DOI] [PubMed] [Google Scholar]
- Das S, Wong R, Rajapakse N, Murphy E & Steenbergen C (2008). Glycogen synthase kinase 3 inhibition slows mitochondrial adenine nucleotide transport and regulates voltage‐dependent anion channel phosphorylation. Circ Res 103, 983–991. [DOI] [PMC free article] [PubMed] [Google Scholar]
- Davies SMK, Poljak A, Duncan MW, Smythe GA & Murphy MP (2001). Measurements of protein carbonyls, ortho‐ and meta‐tyrosine and oxidative phosphorylation complex activity in mitochondria from young and old rats. Free Radic Biol Med 31, 181–190. [DOI] [PubMed] [Google Scholar]
- Dolphin AC (2003). β subunits of voltage‐gated calcium channels. J Bioenerg Biomembr 35, 599–620. [DOI] [PubMed] [Google Scholar]
- Doolan A, Tebo M, Ingles J, Nguyen L, Tsoutsman T, Lam L, Chiu C, Chung J, Weintraub RG & Semsarian C (2005). Cardiac troponin I mutations in Australian families with hypertrophic cardiomyopathy: clinical, genetic and functional consequences. J Mol Cell Cardiol 38, 387–393. [DOI] [PubMed] [Google Scholar]
- Dou Y, Arlock P & Arner A (2007). Blebbistatin specifically inhibits actin‐myosin interaction in mouse cardiac muscle. Am J Physiol Cell Physiol 293, C1148–C1153. [DOI] [PubMed] [Google Scholar]
- Drubin DG, Jones HD & Wertman KF (1993). Actin structure and function: roles in mitochondrial organization and morphogenesis in budding yeast and identification of the phalloidin‐binding site. Mol Biol Cell 4, 1277–1294. [DOI] [PMC free article] [PubMed] [Google Scholar]
- Galli A & DeFelice LJ (1994). Inactivation of L‐type Ca channels in embryonic chick ventricle cells: dependence on the cytoskeletal agents colchicine and taxol. Biophys J 67, 2296–2304. [DOI] [PMC free article] [PubMed] [Google Scholar]
- Gatlin CL, Kleemann GR, Hays LG, Link AJ & Yates JR 3rd (1998). Protein identification at the low femtomole level from silver‐stained gels using a new fritless electrospray interface for liquid chromatography–microspray and nanospray mass spectrometry. Anal Biochem 263, 93–101. [DOI] [PubMed] [Google Scholar]
- Grazette LP, Boecker W, Matsui T, Semigran M, Force TL, Hajjar RJ & Rosenzweig A (2004). Inhibition of ErbB2 causes mitochondrial dysfunction in cardiomyocytes: implications for herceptin‐induced cardiomyopathy. J Am Coll Cardiol 44, 2231–2238. [DOI] [PubMed] [Google Scholar]
- Hao LY, Xu JJ, Minobe E, Kameyama A & Kameyama M (2008). Calmodulin kinase II activation is required for the maintenance of basal activity of L‐type Ca2+ channels in guinea‐pig ventricular myocytes. J Pharmacol Sci 108, 290–300. [DOI] [PubMed] [Google Scholar]
- Haworth RA, Goknur AB, Hunter DR, Hegge JO & Berkoff HA (1987). Inhibition of calcium influx in isolated adult rat heart cells by ATP depletion. Circ Res 60, 586–594. [DOI] [PubMed] [Google Scholar]
- Haworth RA & Redon D (1998). Calibration of intracellular Ca transients of isolated adult heart cells labelled with fura‐2 by acetoxymethyl ester loading. Cell Calcium 24, 263–273. [DOI] [PubMed] [Google Scholar]
- Hohaus A, Person V, Behlke J, Schaper J, Morano I & Haase H (2002). The carboxyl‐terminal region of ahnak provides a link between cardiac L‐type Ca2+ channels and the actin‐based cytoskeleton. FASEB J 16, 1205–1216. [DOI] [PubMed] [Google Scholar]
- Hool LC (2000). Hypoxia increases the sensitivity of the L‐type Ca2+ current to β‐adrenergic receptor stimulation via a C2 region‐containing protein kinase C isoform. Circ Res 87, 1164–1171. [DOI] [PubMed] [Google Scholar]
- Kimura A, Harada H, Park JE, Nishi H, Satoh M, Takahashi M, Hiroi S, Sasaoka T, Ohbuchi N, Nakamura T, Koyanagi T, Hwang TH, Choo JA, Chung KS, Hasegawa A, Nagai R, Okazaki O, Nakamura H, Matsuzaki M, Sakamoto T, Toshima H, Koga Y, Imaizumi T & Sasazuki T (1997). Mutations in the cardiac troponin I gene associated with hypertrophic cardiomyopathy. Nat Genet 16, 379–382. [DOI] [PubMed] [Google Scholar]
- Kohler J, Chen Y, Brenner B, Gordon AM, Kraft T, Martyn DA, Regnier M, Rivera AJ, Wang CK & Chase PB (2003). Familial hypertrophic cardiomyopathy mutations in troponin I (K183D, G203S, K206Q) enhance filament sliding. Physiol Genomics 14, 117–128. [DOI] [PubMed] [Google Scholar]
- Lader AS, Kwiatkowski DJ & Cantiello HF (1999). Role of gelsolin in the actin filament regulation of cardiac L‐type calcium channels. Am J Physiol Cell Physiol 277, C1277–C1283. [DOI] [PubMed] [Google Scholar]
- Levine TB, Bernink PJ, Caspi A, Elkayam U, Geltman EM, Greenberg B, McKenna WJ, Ghali JK, Giles TD, Marmor A, Reisin LH, Ammon S & Lindberg E (2000). Effect of mibefradil, a T‐type calcium channel blocker, on morbidity and mortality in moderate to severe congestive heart failure: the MACH‐1 study. Mortality Assessment in Congestive Heart Failure Trial. Circulation 101, 758–764. [DOI] [PubMed] [Google Scholar]
- Maloyan A, Sanbe A, Osinska H, Westfall M, Robinson D, Imahashi K, Murphy E & Robbins J (2005). Mitochondrial dysfunction and apoptosis underlie the pathogenic process in α‐B‐crystallin desmin‐related cardiomyopathy. Circulation 112, 3451–3461. [DOI] [PMC free article] [PubMed] [Google Scholar]
- Marian AJ & Roberts R (2001). The molecular genetic basis for hypertrophic cardiomyopathy. J Mol Cell Cardiol 33, 655–670. [DOI] [PMC free article] [PubMed] [Google Scholar]
- Mogensen J, Murphy RT, Kubo T, Bahl A, Moon JC, Klausen IC, Elliott PM & McKenna WJ (2004). Frequency and clinical expression of cardiac troponin I mutations in 748 consecutive families with hypertrophic cardiomyopathy. J Am Coll Cardiol 44, 2315–2325. [DOI] [PubMed] [Google Scholar]
- Morris RL & Hollenbeck PJ (1995). Axonal transport of mitochondria along microtubules and F‐actin in living vertebrate neurons. J Cell Biol 131, 1315–1326. [DOI] [PMC free article] [PubMed] [Google Scholar]
- Mosmann T (1983). Rapid colorimetric assay for cellular growth and survival: application to proliferation and cytotoxicity assays. J Immunol Methods 65, 55–63. [DOI] [PubMed] [Google Scholar]
- Nakamura M, Sunagawa M, Kosugi T & Sperelakis N (2000). Actin filament disruption inhibits L‐type Ca2+ channel current in cultured vascular smooth muscle cells. Am J Physiol Cell Physiol 279, C480–C487. [DOI] [PubMed] [Google Scholar]
- Nichols CB, Rossow CF, Navedo MF, Westenbroek RE, Catterall WA, Santana LF & McKnight GS (2010). Sympathetic stimulation of adult cardiomyocytes requires association of AKAP5 with a subpopulation of L‐type calcium channels. Circ Res 107, 747–756. [DOI] [PMC free article] [PubMed] [Google Scholar]
- O'Connell TD, Rodrigo MC & Simpson PC (2007). Isolation and culture of adult mouse cardiac myocytes. Methods Mol Biol 357, 271–296. [DOI] [PubMed] [Google Scholar]
- Parmacek MS & Solaro RJ (2004). Biology of the troponin complex in cardiac myocytes. Prog Cardiovasc Dis 47, 159–176. [DOI] [PubMed] [Google Scholar]
- Penman S (1995). Rethinking cell structure. Proc Natl Acad Sci USA 92, 5251–5257. [DOI] [PMC free article] [PubMed] [Google Scholar]
- Rappaport L, Oliviero P & Samuel JL (1998). Cytoskeleton and mitochondrial morphology and function. Mol Cell Biochem 184, 101–105. [PubMed] [Google Scholar]
- Richard P, Charron P, Carrier L, Ledeuil C, Cheav T, Pichereau C, Benaiche A, Isnard R, Dubourg O, Burban M, Gueffet JP, Millaire A, Desnos M, Schwartz K, Hainque B & Komajda M (2003). Hypertrophic cardiomyopathy: distribution of disease genes, spectrum of mutations, and implications for a molecular diagnosis strategy. Circulation 107, 2227–2232. [DOI] [PubMed] [Google Scholar]
- Rostovtseva T & Colombini M (1996). ATP flux is controlled by a voltage‐gated channel from the mitochondrial outer membrane. J Biol Chem 271, 28006–28008. [DOI] [PubMed] [Google Scholar]
- Rueckschloss U & Isenberg G (2001). Cytochalasin D reduces Ca2+ currents via cofilin‐activated depolymerization of F‐actin in guinea‐pig cardiomyocytes. J Physiol 537, 363–370. [DOI] [PMC free article] [PubMed] [Google Scholar]
- Ruzzenente B, Metodiev MD, Wredenberg A, Bratic A, Park CB, Cámara Y, Milenkovic D, Zickermann V, Wibom R, Hultenby K, Erdjument‐Bromage H, Tempst P, Brandt U, Stewart JB, Gustafsson CM & Larsson NG (2012). LRPPRC is necessary for polyadenylation and coordination of translation of mitochondrial mRNAs. EMBO J 31, 443–456. [DOI] [PMC free article] [PubMed] [Google Scholar]
- Sadeghi A, Doyle AD & Johnson BD (2002). Regulation of the cardiac L‐type Ca2+ channel by the actin‐binding proteins α‐actinin and dystrophin. Am J Physiol Cell Physiol 282, C1502–C1511. [DOI] [PubMed] [Google Scholar]
- Semsarian C, Ingles J, Maron MS & Maron BJ (2015). New perspectives on the prevalence of hypertrophic cardiomyopathy. J Am Coll Cardiol 65, 1249–1254. [DOI] [PubMed] [Google Scholar]
- Sun J, Picht E, Ginsburg KS, Bers DM, Steenbergen C & Murphy E (2006). Hypercontractile female hearts exhibit increased S‐nitrosylation of the L‐type Ca2+ channel α1 subunit and reduced ischemia/reperfusion injury. Circ Res 98, 403–411. [DOI] [PubMed] [Google Scholar]
- Tang H, Viola HM, Filipovska A & Hool LC (2011). Cav1.2 calcium channel is glutathionylated during oxidative stress in guinea pig and ischemic human heart. Free Radic Biol Med 51, 1501–1511. [DOI] [PubMed] [Google Scholar]
- Territo PR, Mootha VK, French SA & Balaban RS (2000). Ca2+ activation of heart mitochondrial oxidative phosphorylation: role of the F0/F1‐ATPase. Am J Physiol Cell Physiol 278, C423–C435. [DOI] [PubMed] [Google Scholar]
- Thornell LE, Eriksson A, Johansson B, Kjörell U, Franke WW, Virtanen I & Lehto VP (1985). Intermediate filament and associated proteins in heart Purkinje fibers: a membrane‐myofibril anchored cytoskeletal system. Ann N Y Acad Sci 455, 213–240. [DOI] [PubMed] [Google Scholar]
- Tokuyasu KT, Dutton AH & Singer SJ (1983). Immunoelectron microscopic studies of desmin (skeletin) localization and intermediate filament organization in chicken cardiac muscle. J Cell Biol 96, 1736–1742. [DOI] [PMC free article] [PubMed] [Google Scholar]
- Tsoutsman T, Chung J, Doolan A, Nguyen L, Williams IA, Tu E, Lam L, Bailey CG, Rasko JE, Allen DG & Semsarian C (2006). Molecular insights from a novel cardiac troponin I mouse model of familial hypertrophic cardiomyopathy. J Mol Cell Cardiol 41, 623–632. [DOI] [PubMed] [Google Scholar]
- Viola HM, Adams AM, Davies SMK, Fletcher S, Filipovska A & Hool LC (2014). Impaired functional communication between the L‐type calcium channel and mitochondria contributes to metabolic inhibition in the mdx heart. Proc Natl Acad Sci USA 111, E2905–E2914. [DOI] [PMC free article] [PubMed] [Google Scholar]
- Viola HM, Arthur PG & Hool LC (2007). Transient exposure to hydrogen peroxide causes an increase in mitochondria‐derived superoxide as a result of sustained alteration in L‐type Ca2+ channel function in the absence of apoptosis in ventricular myocytes. Circ Res 100, 1036–1044. [DOI] [PubMed] [Google Scholar]
- Viola HM, Arthur PG & Hool LC (2009). Evidence for regulation of mitochondrial function by the L‐type Ca2+ channel in ventricular myocytes. J Mol Cell Cardiol 46, 1016–1026. [DOI] [PubMed] [Google Scholar]
- Viola HM, Davies SMK, Filipovska A & Hool LC (2013). The L‐type Ca2+ channel contributes to alterations in mitochondrial calcium handling in the mdx ventricular myocyte. Am J Physiol Heart Circ Physiol 304, H767–H775. [DOI] [PubMed] [Google Scholar]
- Viola HM & Hool LC (2010). Crosstalk between L‐type Ca2+ channels and mitochondria. Clin Exp Pharmacol Physiol 37, 229–235. [DOI] [PubMed] [Google Scholar]
- Viola HM & Hool LC (2014). How does calcium regulate mitochondrial energetics in the heart? – new insights. Heart Lung Circ 23, 602–609. [DOI] [PubMed] [Google Scholar]
- Yaniv Y, Juhaszova M, Lyashkov AE, Spurgeon HA, Sollott SJ & Lakatta EG (2011). Ca2+‐regulated‐cAMP/PKA signaling in cardiac pacemaker cells links ATP supply to demand. J Mol Cell Cardiol 51, 740–748. [DOI] [PMC free article] [PubMed] [Google Scholar]
- Zhai P & Sadoshima J (2008). Overcoming an energy crisis?: an adaptive role of glycogen synthase kinase‐3 inhibition in ischemia/reperfusion. Circ Res 103, 910–913. [DOI] [PMC free article] [PubMed] [Google Scholar]
Associated Data
This section collects any data citations, data availability statements, or supplementary materials included in this article.
Supplementary Materials
Table S1. Additional data for single peptide‐based identifications from immunoprecipitated ICa‐L protein from wt and cTnI‐G203S hearts using mass spectrometry analysis.
Table S2. Peptides identified from immunoprecipitated ICa‐L protein from wt hearts using mass spectrometry analysis.
Table S3. Peptides identified from immunoprecipitated ICa‐L protein from cTnI‐G203S hearts using mass spectrometry analysis.