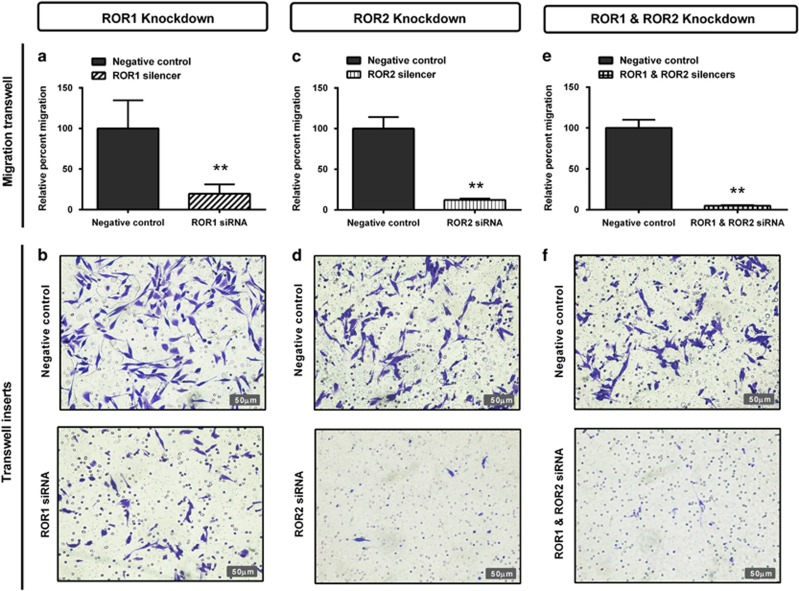
Figure 4.
ROR1 and ROR2 silencing inhibits cell migration through transwells. (a) Relative cell migration performed using the transwell migration assay is significantly decreased following ROR1 knockdown in A2780-cis cells. Results represent an average of three experiments. Error bars represent the s.d. of the mean. **P<0.01. (b) Representative images of transwell membranes stained with crystal violet shows decreased number of cells after ROR1 knockdown. (c) Relative cell migration is significantly decreased following ROR2 knockdown in A2780-cis cells. Results represent an average of three experiments. Error bars represent the s.d. of the mean. **P<0.01. (d) Representative images of transwell membranes stained with crystal violet shows decreased number of cells after ROR2 knockdown. (e) Relative cell migration is most significantly decreased following double ROR1 and ROR2 knockdown in A2780-cis cells. Results represent an average of three experiments. Error bars represent the s.d. of the mean. **P<0.01. (f) Representative images of transwell membranes stained with crystal violet shows the strongest decrease in cell number after double ROR1 and ROR2 knockdown.

