Abstract
Human macrophage migration inhibitory factor (MIF) is both a keto–enol tautomerase and a cytokine associated with numerous inflammatory diseases and cancer. Consistent with observed correlations between inhibition of the enzymatic and biological activities, discovery of MIF inhibitors has focused on monitoring the tautomerase activity using l-dopachrome methyl ester or 4-hydroxyphenyl pyruvic acid as substrates. The accuracy of these assays is compromised by several issues including substrate instability, spectral interference, and short linear periods for product formation. In this work, we report the syntheses of fluorescently labeled MIF inhibitors and their use in the first fluorescence polarization-based assay to measure the direct binding of inhibitors to the active site. The assay allows the accurate and efficient identification of competitive, noncompetitive, and covalent inhibitors of MIF in a manner that can be scaled for high-throughput screening. The results for 22 compounds show that the most potent MIF inhibitors bind with Kd values of ca. 50 nM; two are from our laboratory, and the other is a compound from the patent literature. X-ray crystal structures for two of the most potent compounds bound to MIF are also reported here. Striking combinations of protein–ligand hydrogen bonding, aryl–aryl, and cation−π interactions are responsible for the high affinities. A new chemical series was then designed using this knowledge to yield two more strong MIF inhibitors/binders.
Introduction
Macrophage migration inhibitory factor (MIF) is a proinflammatory cytokine that is involved in numerous inflammatory and autoimmune diseases including rheumatoid arthritis, diabetes, sepsis, and acute respiratory distress syndrome.1−4 Release of MIF from activated cells such as macrophages and T-cells in turn promotes release of other inflammatory cytokines. MIF is also overexpressed in many cancer cells where it enhances cell proliferation by inhibiting accumulation of the tumor suppressor p53.5 The complex biological activities of MIF as a cytokine are modulated by its binding to the cell-surface receptors CD74, CXCR2, and CXCR4. MIF is a homotrimeric protein with 342 residues, which also displays enzymatic activity as a keto–enol tautomerase. There are three identical active sites at the interfaces of the monomer subunits. The enzymatic activity appears to be vestigial in humans; however, nonphysiological substrates including d-dopachrome methyl ester (DOPA) and hydroxyphenyl pyruvic acid (HPP) have been identified and form the bases for the most common assays.6,7 Although inhibition of the tautomerase activity does not guarantee inhibition of biological function, many studies have supported a correlation.8,9 A recent report has further strengthened the view that MIF-CD74 binding occurs near the tautomerase sites and that the protrusion of inhibitors outside the active sites leads to reduced biological activity.10
Most studies to identify
MIF inhibitors have screened compound
libraries using the DOPA or HPP tautomerase assays.4,9,11−14 IC50 or Ki values are reported for inhibition of the tautomerization
of these substrates. As discussed previously,15 execution of these assays is complicated by multiple factors including
the light sensitivity of DOPA, the slow rate of tautomerization of
HPP, spectral interference of inhibitors and products, choice of protein
concentration, and short times for the linear range of product formation
in both cases. There has been limited report on activities of consensus
reference compounds in the screening studies except for the isoxazoline
(R)-ISO-1.16 The IC50 results for it, which range from 7 μM to >100 μM,
reflect the difficulties in obtaining consistency.9,16,17 We also reinvestigated the chromenone Orita-13,
which had been the most active compound in the  journal literature with a reported Ki of 0.038 μM in the DOPA assay.11 However, while Ki results should be
independent of the substrate, repeated testing in our HPP assay yielded
modest Ki values of 13–22 μM.15 Extension of the comparisons to additional compounds
from the literature has revealed a pattern of substantial inconsistencies
in reports of activities from MIF tautomerase assays.18 Therefore, we decided to pursue development of a direct
binding assay that can overcome the problems with the tautomerase
assays. Based on our recent finding of biaryltriazoles as potent MIF
tautomerase inhibitors, we were able to design and synthesize fluorescent
ligands that can be used as effective tracers in a fluorescence polarization
(FP) assay.19 Displacement of a ligand
by a fluorescent probe yields a readily quantified increase in fluorescent
polarization that reflects the fraction of bound ligand. The usual
advantages of FP assays apply including use of standard microplate
readers, direct determination of Kd values
with no need for substrates or radiolabeled reagents, and the ability
to reanalyse the assay plates.19 In contrast,
for the tautomerase assays, the measurements of product formation
can only be made once in the first seconds after the addition of the
substrates. Furthermore, since the present tracers have low-nanomolar
affinity for MIF, only small amounts of the protein are required.
In the course of this work, we also determined the crystal structures
of the complexes for two MIF ligands with particularly high affinities.
The results reveal common structural features for achieving strong
binding with MIF.
Experimental Section
Chemistry
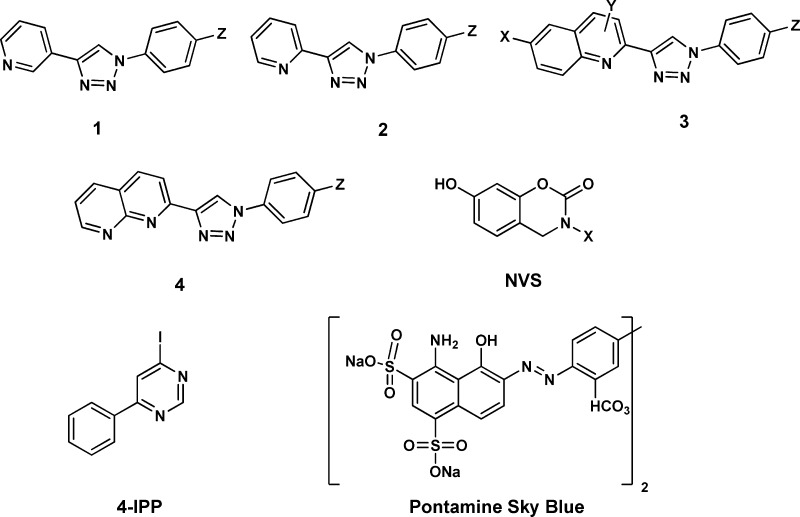
We previously reported biaryltriazoles with the general structures 1–4 as MIF tautomerase inhibitors with Ki values as low as 0.057 μM in the HPP assay.15 X-ray crystal structures for complexes of the parent quinoline 3a (X = Y = H, Z = OH) and its analogue with X = MOEO (methoxyethoxy) were also reported and confirmed the expected binding in the MIF active sites with the X group on C6 of the quinoline protruding into the solvent.15 The analogues of 1–4 utilized here were reported previously with the exception of 3j;15 their syntheses feature a 1,3-dipolar cycloaddition of a phenylazide with a substituted ethynylheterocycle obtained via a Sonogashira coupling. We have also examined the journal and patent literature for other potential strong binders. Compounds reported in a patent from workers at Novartis appeared particularly promising.20 Twenty two benzoxazinones were exemplified, and it was stated that they had activities of 20 nM–20 μM in an HPP tautomerase assay. The second example, which we refer to as NVS-2 (X = p-methoxyphenyl), was singled out as having an IC50 of 20 nM. We resynthesized it along with examples 1 and 6, NVS-1 (X = cyclohexyl), and NVS-6 (X = p-hydroxyphenyl). As described in the Supporting Information, the general procedure from the patent was followed; however, the details on the protection of the 7-hydroxy group were unclear. It was found that a tert-butyldimethylsilyloxy group worked well (Scheme 1). NVS-6 was obtained from 4-methoxy-2-hydroxybenzaldehyde and 4-methoxyaniline upon treatment with sodium borohydride, followed by demethylation of both methoxy groups using pyridinium hydrochloride. Additional reference compounds, ISO-1, Orita-13, 4-IPP, and Pontamine Sky Blue (PSB), were obtained from commercial sources (Alfa-Aesar, Tocris, Santa Cruz Biotechnology). Compound identity was confirmed by NMR and mass spectrometry, and >95% purity of all assayed compounds was established by HPLC.
Scheme 1. Synthesis of NVS-2.
Biology
The expression and purification of human MIF followed the previous procedures.15 The protein has been prepared on two occasions and stored at −80 °C. Aliquots are thawed for the assaying and crystal growth, and never refrozen. Activities were shown to be consistent for different samples using multiple control compounds. The HPP tautomerase assay was carried out as described before.15 Inhibitory activity is monitored by measuring formation of the borate complex of the enol product at 305 nm using a Tecan Infinite F500 plate reader. Details for the FP assay are described below and in the Supporting Information.
Crystallography
X-ray crystal structures at 1.8-Å resolution were obtained for complexes of NVS-2 and 3-((2-(1-(3-fluoro-4-hydroxyphenyl)-1H-1,2,3-triazol-4-yl)quinolin-5-yl)oxy)benzoic acid (3i) with human MIF. Crystals of apo MIF were obtained by the hanging drop method. Subsequently, 2 μL drops containing the apo MIF crystals were treated with 10 mM suspensions of the ligands in DMSO. In both cases, after several weeks, the initial protein crystals cracked and dissolved, and new crystals formed (Figure S1). The crystals were cryoprotected, and data collection was performed on a Rigaku 007HF+ X-ray source with a Saturn 944+ CCD detector at Yale. Data processing, phasing, model building, and refinement were carried out as described previously.15 Crystals of NVS-2 were found to occupy the P3121 space group, while those of 3i were I222. Full details are provided in the Supporting Information. The structures have been deposited with the RCSB Protein Data Bank with PDP IDs 5HVT and 5HVS, respectively.
Results and Discussion
Design of Fluorescent Ligands
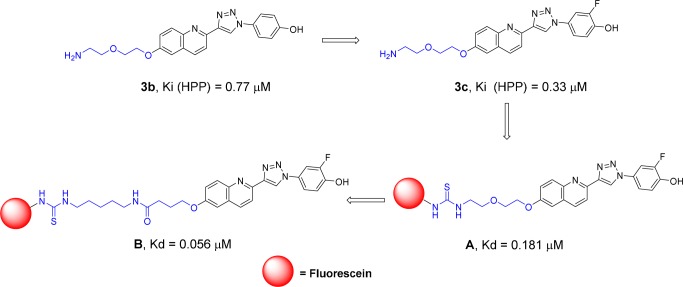
The fluorescent ligands were designed based on the biaryltriazoles previously reported by our group.15 As summarized in Scheme 2, starting with 3b, which has a Ki of 0.77 μM in the HPP assay, a fluorine was added adjacent to the hydroxyl group to yield 3c and a Ki of 0.33 μM. The improvement can be attributed to the fluorine enhancing the acidity of the hydroxyl group, which forms a hydrogen bond with Asn97, and/or filling a small hydrophobic space contacting Met101. Compound 3c also bears an amino group that was reacted with the isothiocyanate derivative of fluorescein (FITC) to yield the fluorescent analogue A, which was subsequently found in saturation experiments described below to have a Kd of 0.181 μM. Exploration to further improve the affinity of the fluorescent ligand included expansion of the spacer between the quinoline ring and the fluorophore. This led to the fluorescent ligand B, which has a Kd of 0.056 μM and was prepared from the carboxylic acid 3j (Scheme 3). The increased potency is beneficial in allowing use of a lower protein concentration in the FP assay. Based on the previous15 and current crystallographic results and the consistent structure–activity data (SAR), it is fully expected that these fluorescent ligands, derived from competitive inhibitors, bind to the active sites of MIF. Therefore, they can be used to identify not only compounds that competitively bind to the tautomerase sites but also compounds that can bind to allosteric sites that may disrupt or block the active site and keep the tracer from binding.
Scheme 2. Design of Fluorescent Ligands A and B.
Scheme 3. Complete Structure of Fluorescent MIF Ligand B Used in the FP Assays.
FP Assay Development
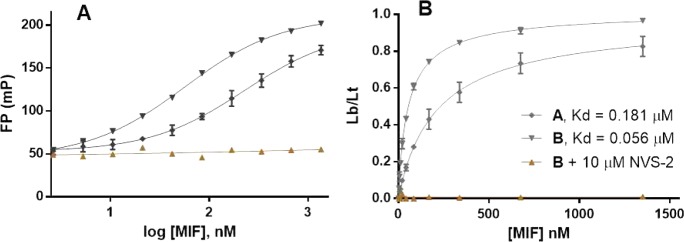
The assay was developed in a 96-well format. To determine if the fluorescent ligands bind to the protein and their affinity, binding saturation experiments were carried out. After determination of the lowest concentration of the tracer that gives a consistent FP value, this concentration (0.004 μM) was fixed and increasing amounts of MIF (0 to 1.35 μM) were added, which caused an increase in the FP values by around 4-fold (Figure 1A). In order to determine if any nonspecific binding occurs, the assay was also carried out in the presence of a high concentration of a high-affinity ligand (NVS-2), which binds to the active site based on the crystal structure presented below. Ligand B shows very high specificity since there is no variation in the FP value from that of the free tracer in the presence of 10 μM NVS-2 (Figure 1A, bottom curve). At high MIF and NVS-2 concentrations there is no indication that the tracer participates in any binding that would be signaled by an increase in the FP value. Thus, the fluorescent ligand binds to the tautomerase sites, and the fraction of ligand bound to ligand total can be calculated with the highest and lowest FP values obtained in the saturation experiments. Using GraphPad Prism 6, Kd values are readily determined by plotting this fraction vs the concentration of the protein and fitting the results to the Hill equation. From Figure 1B, tracer B has greater affinity (Kd = 0.056 ± 0.002 μM) than tracer A (Kd = 0.181 ± 0.034 μM).
Figure 1.
Determination of binding affinity of tracers A and B through saturation experiments. (A) Variation of FP values for both tracers as a function of MIF concentration. Bottom curve indicates the high specificity of ligand B toward the active site of MIF. (B) Kd determination for ligands A and B. Lb/Lt = ratio of ligand bound to the total. Data shown from quadruplicate experiments in three independent assays. Mean ± SEM plotted for all data.
Competition Assays
In order to develop a competitive FP assay to determine the affinities of unlabeled compounds, tracer B was selected since its higher affinity allows use of a smaller amount of protein to give a sufficient difference in FP values. At 0.056 μM MIF, the ΔmP between positive and negative controls is ca. 80 mP. Thus, we settled on standard assay conditions of 0.004 μM tracer B and 0.056 μM MIF.
The compounds listed in Table 1 were assayed. Most are known noncovalent tautomerase inhibitors of MIF including 11 biaryltriazoles,15 (R)-ISO-1,16 and Orita-13.11 In addition, we added an inactive analogue 3e, where the 4-methoxy group disrupts the characteristic hydrogen bond with Asn-97,153j, and the three NVS compounds.20 We also assayed 4-IPP, a well-known covalent MIF inhibitor,21 and the azo dye pontamine sky blue (PSB), which is reported to bind on the surface of MIF and inhibit both the tautomerase activity of MIF and its binding to CD74 (IC50 = 0.81 μM).22
Table 1. Results for Tautomerase Inhibition (Ki) from the HPP Assay and for Binding (Kd) from the Fluorescence Polarization Assaya.
| compd | X | Y | Z | Ki (μM) | Kd (μM)b |
|---|---|---|---|---|---|
| 1a | – | – | OH | 37 | 30% (25 μM) |
| 2a | – | – | OH | 8.8 | 1.75 |
| 3a | H | H | OH | 0.59 | 0.260 |
| 3b | AEOEO | H | OH | 0.77 | 0.348 |
| 3c | AEOEO | H | 3-F,4-OH | 0.33 | 0.163 |
| 3d | MOEO | H | F | 8.9 | (>1.5) |
| 3e | MOEO | H | OMe | NA | NA |
| 3f | MrEOEO | H | OH | 0.41 | 0.211 |
| 3g | MrEOEO | H | 3-F,4-OH | 0.15 | 0.152 |
| 3h | H | 5-p-COOH-OPh | 3-F,4-OH | 0.11 | 0.110 |
| 3i | H | 5-m-COOH-OPh | 3-F,4-OH | 0.057 | 0.071 |
| 3j | O(CH2)3COOH | H | 3-F,4-OH | 0.034 | 0.063 |
| 4a | H | H | OH | 1.48 | 0.347 |
| 5a | OCH3 | – | – | 1.90 | 1.71 |
| 5b | COOH | – | – | 1.70 | 1.15 |
| Orita-13 | – | – | – | 17 | 20% (100 μM) |
| (R)-ISO-1 | – | – | – | 24 | 24 |
| NVS-1 | cyclohexyl | – | – | 0.569 | 0.456 |
| NVS-2 | p-OMe-Ph | – | – | 0.027 | 0.055 |
| NVS-6 | p-OH-Ph | – | – | 0.185 | 0.159 |
| 4-IPP | – | – | – | (4.5)c,d | (0.446)c |
| PSB | – | – | – | ND | 49% (200 μM) |
MOEO = methoxyethoxy; AEOEO = aminoethoxyethoxy; Mr = N-morpholinyl. NA = not active.
Kd or % bound at indicated concentration in parentheses.
Covalent inhibitor: result is time-dependent.
IC50 from ref (9).
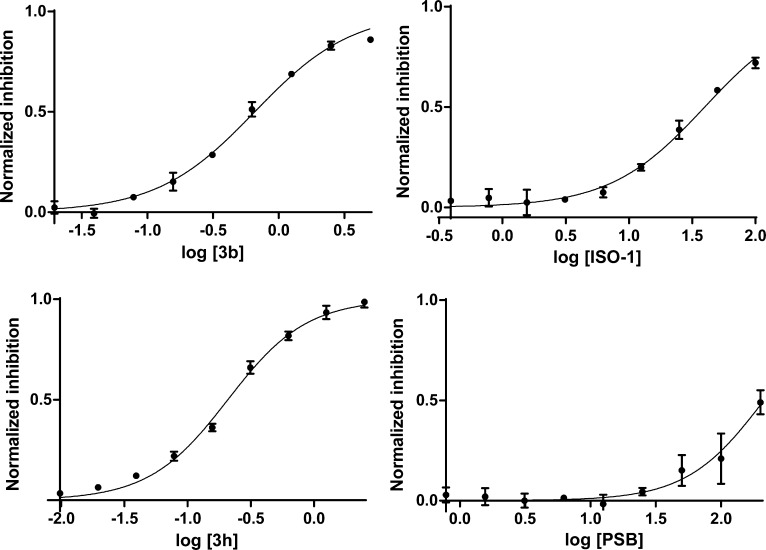
For the FP assay, compounds were incubated at room temperature with human MIF for 20 min, followed by the addition of tracer B. This order of addition is preferred because of the high affinity of the tracer; otherwise, it takes modest inhibitors such as ISO-1 1–2 h to reach equilibrium for displacing the bound tracer. A standard buffer solution was used composed of 20 mM HEPES, 150 mM NaCl, and 0.01% Tween-20 with a pH of 7.4. Fluorescence polarization was monitored for 1 h with λexc = 485 ± 20 nm and λem = 535 ± 25 nm. The IC50 of each compound for reducing the fluorescence polarization was determined by fitting the data to a nonlinear regression for log concentration vs response (Figure 2). The IC50 is then transformed into the corresponding Kd via eq 1,23 where Kdt is the Kd of the tracer (0.056 μM), Lt and Lb are the total and bound concentrations of the tracer, and Pt is the total MIF concentration. Full experimental details are provided in the Supporting Information.
| 1 |
Figure 2.
Determination of IC50 for representative compounds. Plotted data from quadruplicate experiments in three independent assays, mean ± SEM.
The results from the HPP and FP assays are recorded in Table 1. In principle, the Ki and Kd values for a noncovalent inhibitor that binds to the tautomerase sites should be the same under identical assay conditions. However, variations can arise from multiple sources. For example, allosteric binding might or might not lead to tautomerase inhibition and/or displacement of the fluorescent ligand. In addition, the assay conditions are not identical. An important consideration is the pH. The tautomerase assays with both HPP and DOPA are carried out at pH 6–6.1, the optimal conditions for the substrates, while we have performed the FP assay at physiological pH, 7.4. The pH affects the protonation of functional groups in fluorophores and, therefore, the amount of fluorescence. In general, an acidic pH is worse than an alkaline pH for fluorescence assays. pH 7.4 keeps the fluorescecent properties of fluorescein in an optimal range and enhances the biological relevance.24 There is also influence of the pH on the protein–ligand binding, which we examined for tracer A (Figure 3). As shown, increasing the pH from 5.1 to 7.4 clearly enhances the binding of A, and presumably the other biaryltriazoles, to MIF; the effect is likely associated with progressive deprotonation of the catalytic Pro1, which has a pKa of ca. 5.6.25
Figure 3.
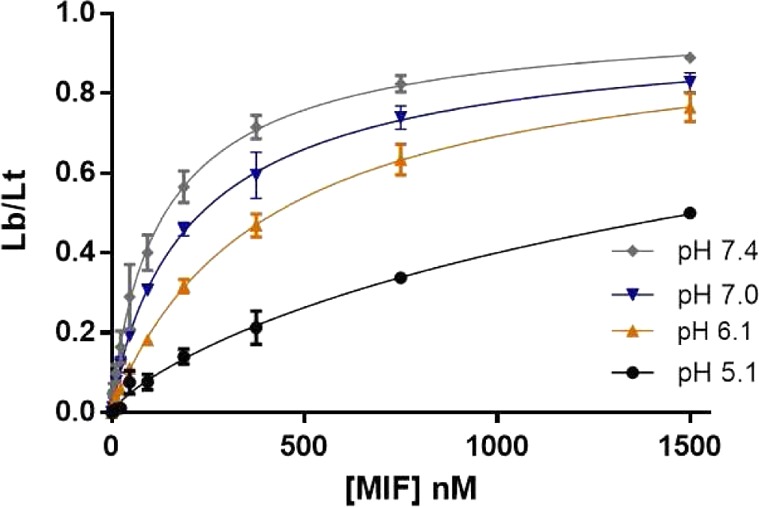
Influence of the pH in the binding of tracer A to MIF. Lb/Lt = ratio of ligand bound to the total. Data shown from quadruplicate experiments in two independent assays. Mean ± SEM plotted for all data.
Another issue in FP assays is possible alteration of the fluorescence by test compounds. The fluorescent properties of the tracer in the presence of the compounds, but in the absence of protein, should be checked before assaying. In the present cases, some compounds have no effect on FP values even at high concentrations, e.g., ISO-1 and PSB. However, other compounds, specifically 1a, 3d, and Orita-13, did yield effects. In general, the undesirable effects decrease with the concentration such that concentrations of test compounds below 1–3 μM do not cause interference. However, this modulation of the fluorescence does not allow determination of the affinity of those compounds for which the limiting concentration is lower than their Kd values. Another issue that can affect fluorescence is aggregation. Compounds that form aggregates or precipitates can yield misleading FP values. Overall, the high concentrations needed to determine the affinity of weak ligands can be problematic due to potential nonspecific binding of the ligand to the tracer.24 The use of detergents in the FP buffers such as Tween-20 helps to avoid aggregation; however, at high concentrations, this issue may still arise. Other assays including the tautomerase one are also prone to aggregation problems at high concentrations.26
In spite of the caveats, we do observe similar results with our tautomerase and FP assays for the compounds in Table 1. This is especially true for the most potent compounds including 3g–3j and the three NVS compounds, and the order of activities is well preserved. The consistency between the present Ki and Kd results supports the accuracy of both assays and contrasts the inconsistencies in prior reports for the tautomerase activities of reference compounds.18 Progression from 1a (3-pyridinyl) to 2a (2-pyridinyl) to 3a (2-quinolinyl) increases tautomerase inhibition in parallel with binding to MIF. The effects of substituents for the quinoline series, 3a–3i, are also in good accord. The replacement of the phenolic hydroxyl group by a methoxy group in 3e abolishes the binding and tautomerse inhibition, while the addition of a fluorine next to the hydroxyl group improves the Ki and Kd values by a factor of 2 for 3b/3c and 3f/3g. For compound 3d the phenolic OH is replaced by F leading to weaker inhibition, again due to loss of hydrogen bonding with Asn97.15 In this case for the FP assay, no inhibition is evident up to 1.5 μM. Above this point, there is interference with the fluorescence, so a Kd value could not be determined. The two assays also agree essentially quantitatively that the most potent triazole derivatives, 3i and 3j, incorporate an oxybenzoic acid substituent at the 5-position in the quinoline ring or an oxybutanoic acid substituent at the 6-position yielding Ki and Kd values of 0.034–0.071 μM. Insights on the structural origins of this effect are provided below.
Turning to the reference compounds, as noted above, Orita-13 with a Ki of 17 μM is much less active in our HPP assay15 than expected from the original report of 0.038 μM in the DOPA assay.11 The modest activity is supported by the present FP results in which only 20% binding is found at 100 μM. (R)-ISO-1 is unequivocally more active in the FP assay with an average Kd of 24 μM, from three separate measurements of 21, 22, and 30 μM. Our group and others have assayed (R)-ISO-1 multiple times yielding IC50 and Ki values ranging from 7 to >100 μM. In three separate measurements with the present protocols, we obtained Ki values of 21, 24, and 28 μM for (R)-ISO-1, also averaging 24 μM. These two cases reflect that significant variations are more probable for reports of activities of less potent compounds, likely for the pH, aggregation, and spectral interference issues noted above.
In view of the previous inconsistencies with published results,15,18 it was gratifying to find that, in our HPP assay, the NVS compounds are indeed potent tautomerase inhibitors with Ki values of 0.569, 0.027, and 0.185 μM for NVS-1, NVS-2, and NVS-6, respectively. The activities of NVS-2 and 3j are essentially identical at 0.03 μM, which establishes them as the most potent tautomerase inhibitors to our knowledge. The Ki of 0.027 μM for NVS-2 is very similar to the previously reported IC50 of 0.020 μM (20 nM).20 In addition, the Kd values from the FP assay are quantitatively similar to the Ki results. NVS-2, 3i, and 3j with Kd values of 0.055–0.071 μM bind the most strongly to MIF among the compounds studied here.
Covalent and Allosteric Inhibition
The FP assay also allows discrimination of covalent and noncovalent inhibitors. The formation of a covalent bond between an inhibitor and a residue in a binding site is expected to occur more slowly than establishment of a noncovalent complex. Consequently, the activity of the covalent binder will appear to increase with increasing time. We monitored the FP for 1 h after the 20 min incubation period with a noncovalent inhibitor (2a) and the covalent inhibitor 4-IPP.21 As seen in Figure 4, there is a clear difference between the results. The noncovalent interactions of 2a are formed quickly, and the equilibrium between the bound and unbound tracer is time independent. On the other hand, in the case of 4-IPP the FP results are time dependent showing the expected decrease in fluorescence polarization (increase in unbound tracer) with increasing time.
Figure 4.
Contrasting FP results for a noncovalent inhibitor 2a (left) and a covalent one, 4-IPP (right). The results for the covalent inhibitor depend on the detection time showing increasing amounts of unbound tracer with increasing time. Mean ± SEM plotted for all data.
Finally, PSB has been reported as an allosteric inhibitor of MIF tautomerase activity as well as an agent able to block the binding of MIF to CD74 with an IC50 value of 0.81 μM.22 Crystallographic results show PSB bound to the interface between two MIF trimers.22 According to our FP results, the affinity of this compound is low with 49% binding of PSB at 200 μM.
However, concern can be expressed that the compound is aggregating at such concentrations; when the amount of Tween-20 was reduced below 0.01%, the FP signal was lost. Though PSB does not bind in the active site, in some multimeric form it may cover the active site and cause partial exclusion of the tracer.
Assay Quality
In order to provide a measure of the quality of HTS assays, Zhang et al. introduced the Z′ factor, which is calculated from the mean signals of the positive and negative controls (μc+ and μc–) and their standard deviations (σc+ and σc–) using the formula Z′ = 1 – [3(σc+ + σc–)/|μc+ – μc–|].27 As the signal range increases and the variations decrease, Z′ tends to the ideal limit of 1, while Z′ values above 0.5 are considered “excellent”.27 From four independent measurements of the positive (tracer B plus MIF) and negative (tracer B alone) controls for the present FP assay, the Z′ factor is 0.69.
Crystal Structures
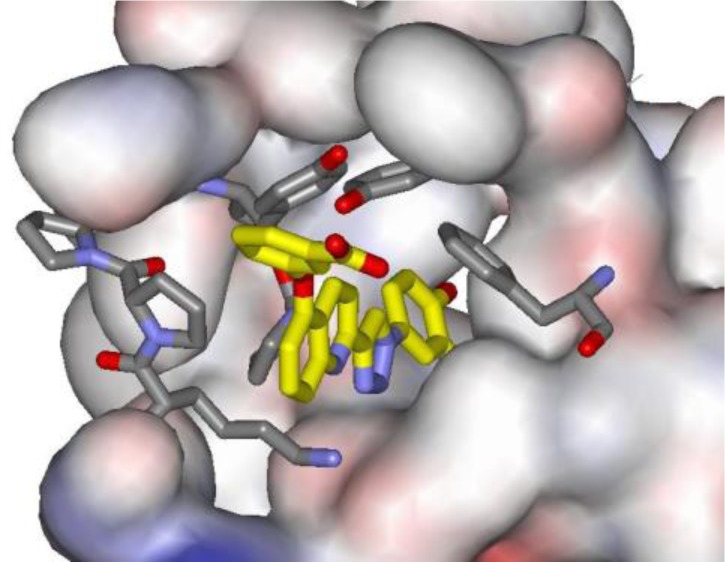
X-ray structures were obtained for crystals of two of the most potent inhibitors identified here with human MIF. A close-up of the structure in the vicinity of the tautomerase site is shown for 3i in Figure 5. The general features are as expected from the prior reports for 3a and its analogue with an MOEO group at C6 of the quinoline ring.15 The protein–ligand complexation features multiple hydrogen bonds and aryl–aryl interactions. All three tautomerase sites of the MIF trimer are occupied by 3i. The ammonium group of Lys32 is coordinated by the quinoline nitrogen, N3 of the triazole, and the carbonyl oxygen of Ile64 at distances of 3.14, 3.97, and 2.79 Å, respectively. N2 of the triazole is also in a hydrogen bond with the backbone nitrogen of Ile64 (2.93 Å), and the phenolic oxygen is 2.59 Å from the side chain nitrogen or oxygen atom of Asn97. The new feature is the accommodation of the phenoxy group on C5 of the quinoline ring. It is partially tucked into the pocket between Pro33 and Tyr36. The added van der Waals contacts can account to some extent for the increased potency of 3i over 3c and 3g, whose substituents at C6 of the quinoline are solvent-exposed. There is also an electrostatic benefit of the negative carboxylate group on the phenoxy ring in view of its proximity to Lys32. Decreases in potency of 2- to 10-fold are found when the carboxylate group is replaced by neutral or positively charged alternatives.15 Another new feature is that the fluorine atom adjacent to the phenolic hydroxyl group is oriented down between Ile64 and Asn97, making closest contact with Cγ of Met101 (3.07 Å). This was expected from molecular modeling studies,15 but the ligands in the previous crystal structures lacked the fluorine atom. As noted above, the 2-fold increases in potency obtained by addition of the fluorine atom may be attributed to inductive enhancement of the hydrogen bond between the hydroxyl group and Asn-97 and/or the hydrophobic contact with Met101.
Figure 5.
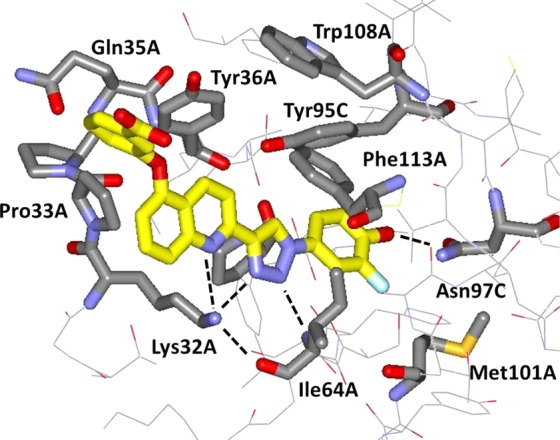
Rendering from the 1.8-Å X-ray crystal structure of 3i bound to human MIF. Residues near the active site are illustrated with carbon atoms of 3i in yellow. Dashed lines indicate hydrogen bonds. The PDB code is 5HVS.
The corresponding structure for NVS-2 is illustrated in Figure 6. The interaction themes are similar to the case for 3i with coordination of the Lys32 ammonium group by the carbonyl groups of NVS-2 (2.80 Å) and Ile64 (2.86 Å), a bifurcated hydrogen bond between the backbone NH of Ile64 and the NVS-2 carbonyl (3.20 Å) and ring oxygen (3.12 Å) atoms, and a hydrogen bond between the hydroxyl group of NVS-2 and Asn97 (2.62 Å). A striking additional feature is a cation−π interaction between the anisyl group of NVS-2 and Lys32; the ammonium group is positioned below the ring center with distances of 4.5–5.5 Å to all six carbon atoms, typical of cation−π interactions.28,29 As for 3i, there are also multiple aryl–aryl interactions between the inhibitors and Tyr36, Tyr95, and Phe113. The complementarity between NVS-2 and the MIF tautomerase site appears almost ideal with the remarkable multidentate coordination of Lys32, satisfaction of the hydrogen-bonding demands of Ile64 and Asn97, and the aryl–aryl interactions for Tyr36, Tyr95, and Phe113. The only part of the ligand that appears to not be engaged in beneficial interactions is the terminal methoxy group, though its electron-donating character may enhance the hydrogen-bond accepting character of the carbonyl group in the oxazinone ring. This notion is consistent with the 3-fold stronger binding for NVS-2 than for NVS-6 in which the solvent-exposed methoxy group is replaced by hydroxy. The ca. 10-fold weaker binding for the cyclohexyl analogue NVS-1 clearly results from loss of the cation−π interaction with Lys-32. In view of its small size with a heavy atom count (HAC) of only 20, the ligand efficiency for NVS-2 is high at 0.50 ((−2.3RT/HAC) log Kd).30 For the much larger 3i, the ligand efficiency is 0.30.
Figure 6.
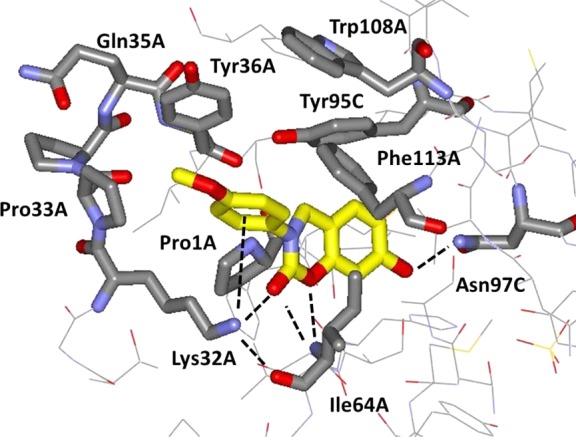
Rendering from the 1.8-Å X-ray crystal structure of NVS-2 bound to human MIF. The PDB code is 5HVT.
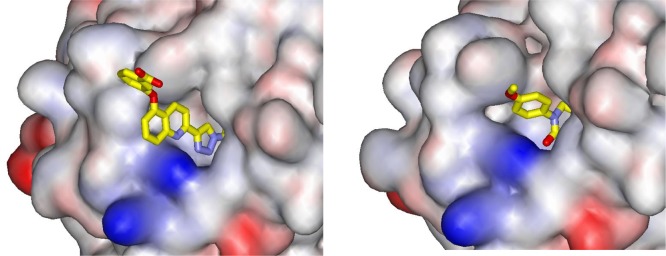
It should also be noted that, as in the case of 3i, all three tautomerase sites are occupied by copies of NVS-2. This may reflect the strength of the interactions, or it may be regulated by protein–protein packing. In the crystal structure for 3a bound to MIF (PDB ID: 4WR8),15 there is only one tautomerase site occupied per MIF trimer; however, the protein–protein interface has tight contact between the quinoline rings of the inhibitors protruding from the surfaces of pairs of MIF trimers. For the present cases, 3i extends much farther than NVS-2 from the active site (Figure 7), so it is likely that MIF signaling via binding to cell-surface receptors including CD74 will be more impaired in the presence of 3i.22 Thus, higher ligand efficiency may not be desirable in this case. We have also used the substituents at C5 and C6 of the quinoline to enhance the solubility of the biaryltriazoles.15
Figure 7.
Renderings from the crystal structures for 3i (left) and NVS-2 (right) illustrating the difference in protrusion from the MIF binding site. The protein is shown as a space-filling surface. The orientation of the terminal methoxy group of NVS-2 varies depending on the binding site of the MIF trimer.
Combined Design
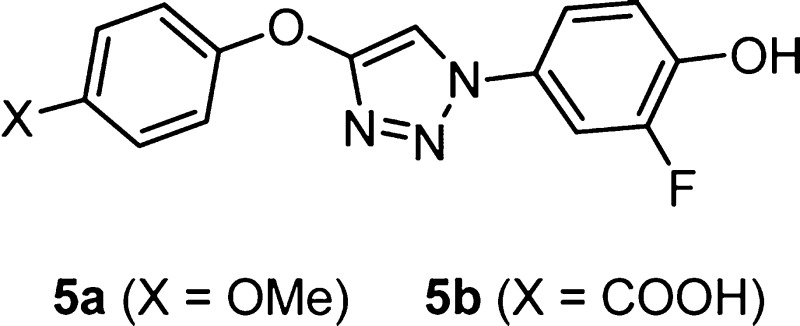
In view of the striking cation−π interaction for NVS-2 in Figure 6, a new molecular design was sought to merge this feature with the triazolylphenol core of 3. Structure building with the BOMB program31 suggested that replacement of the quinolinyl group of 3 with a phenoxy group as in 5 would be appropriate (Figure 8). It is expected that the cation−π interaction is enhanced by substituents that would further increase the electron-richness of the phenoxy group. Thus, we had interest in preparing the 4-methoxy (5a) and carboxylic acid (5b) derivatives. 5b is expected to be ionized to the carboxylate above pH 5.
Figure 8.
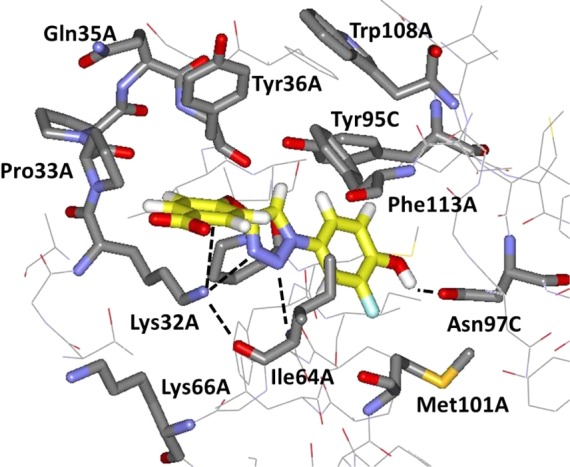
Computed structure for the complex of MIF and 5b as modeled with the BOMB program. Anticipated hydrogen bonds and the cation−π interaction are indicated with dashed lines.
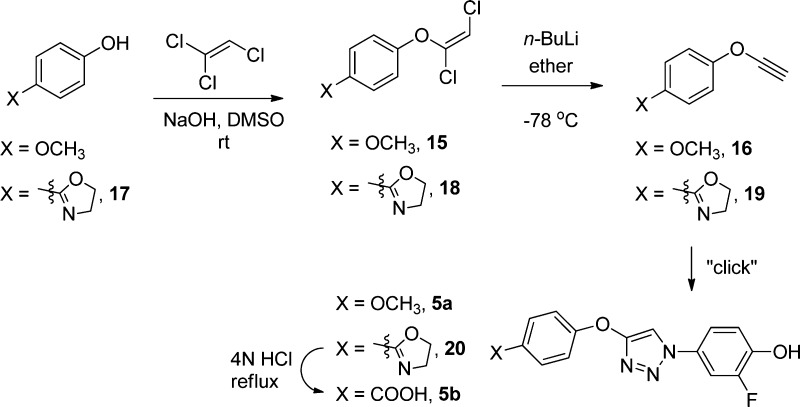
The synthesis of compounds 5 is outlined in Scheme 4; full details are in the Supporting Information. Treatment of 4-methoxyphenol with trichloroethylene and base, followed by dehydrohalogenation with n-butyl lithium, yielded the ethynyl ether,32 which was converted to 5a by a one-pot Cu(I)-catalyzed “click” reaction using 4-azido-2-fluorophenol generated in situ.15 However, synthesis of 5b required an oxazoline protecting group33 in view of the step using n-butyl lithium. The two compounds were then assayed and show good potency with Ki and Kd values of 1–2 μM (Table 1). They are significantly more potent than (R)-ISO-1 and the parent 2-pyridyl analogue 2a. The small difference in the Ki values for the acid (5b) and ether (5a) derivatives is consistent with what was observed for 3i (0.057 μM) and its methoxyethoxy analogue (0.082 μM).15 Thus, the quinolinyl and phenoxy motifs of 3 and 5 provide interesting polydentate alternatives for accommodation of Lys32 by incorporating azine coordination or a cation−π interaction (Figures 5 and 8).
Scheme 4. Synthesis of Compounds 5a and 5b.
Conclusion
In this work, a fluorescence polarization assay was developed by designing and synthesizing two fluorescein-labeled inhibitors of MIF. The high affinity of tracer B permits use of low concentrations of both the tracer (0.004 μM) and the protein (0.056 μM) in the FP assay. The FP assay shows multiple advantages over the traditional HPP and DOPA tautomerase assays used for discovery of molecules that bind to MIF including ease of use and detection, stability of reagents, and ready expansion to HTS formats. Both the HPP and FP assays were applied to 22 compounds including known noncovalent, covalent, and allosteric inhibitors of MIF. The results for the noncovalent inhibitors show excellent accord between the measured Ki and Kd values giving confidence in the viability of the present protocols for both assays. We also synthesized a particularly interesting compound from the patent literature, NVS-2; it and 3j are the most potent inhibitors/binders in our assays. With Ki values of 0.03 μM, they are roughly 1000-fold more potent than the prototypical MIF inhibitor (R)-ISO-1.
Furthermore, the FP assay was shown to perform well for the covalent inhibitor 4-IPP, which demonstrated the expected time-dependence for its binding results. The weak allosteric inhibitor PSB also yielded a response in the FP assay showing some interference with binding of the tracer at high concentrations. The assay results were much enhanced by obtaining X-ray crystal structures at 1.8-Å resolution for two of the most potent MIF inhibitors/binders, 3i and NVS-2. The structures confirmed that the anticipated binding of these molecules and the closely related tracers occurs in the MIF tautomerase active sites. The structures also illustrate the exquisite binding of these potent compounds to MIF featuring extensive hydrogen-bonding and aryl–aryl interactions along with a cation−π interaction for the anisyl group of NVS-2. A new chemical series was then designed merging the triazolylphenol core of 3 with the cation−π feature of NVS-2 to yield additional strong MIF inhibitors/binders, 5a and 5b. The present structural and activity results along with the availability of the FP assay place further work on seeking regulators of the activity of MIF on a firm foundation.
Acknowledgments
Gratitude is expressed to the National Institutes of Health (GM32136) for research support and to the National Science Foundation (DGE-1122492) for a fellowship to M.J.R. The authors also thank Dr. Julian Tirado-Rives and Prof. Richard H. G. Baxter for technical advice.
Supporting Information Available
The Supporting Information is available free of charge on the ACS Publications website at DOI: 10.1021/jacs.6b04910.
Full synthetic procedures and spectral characterization data for all intermediates and final compounds; crystallographic data; experimental details of the HPP and FP assays (PDF)
The authors declare no competing financial interest.
Supplementary Material
References
- Morand E. F.; Leech M.; Bernhagen J. Nat. Rev. Drug Discovery 2006, 5, 399–411. 10.1038/nrd2029. [DOI] [PubMed] [Google Scholar]
- Garai J.; Lorand T. Curr. Med. Chem. 2009, 16, 1091–1114. 10.2174/092986709787581842. [DOI] [PubMed] [Google Scholar]
- Asare Y.; Schmitt M.; Bernhagen J. Thromb. Haemostasis 2013, 109, 391–398. 10.1160/TH12-11-0831. [DOI] [PubMed] [Google Scholar]
- Xu L.; Li Y.; Sun H.; Zhen X.; Qiao C.; Tian S.; Hou T. Drug Discovery Today 2013, 18, 592–600. 10.1016/j.drudis.2012.12.013. [DOI] [PubMed] [Google Scholar]
- Conroy H.; Mawhinney L.; Donnelly S. C. QJM 2010, 103, 831–836. 10.1093/qjmed/hcq148. [DOI] [PMC free article] [PubMed] [Google Scholar]
- Rosengren E.; Bucala R.; Aman P.; Jacobsson L.; Odh G.; Metz C. N.; Rorsman H. Mol. Med. 1996, 2, 143–149. [PMC free article] [PubMed] [Google Scholar]
- Rosengren E.; Aman P.; Thelin S.; Hansson C.; Ahlfors S.; Björk P.; Jacobsson L.; Rorsman H. FEBS Lett. 1997, 417, 85–88. 10.1016/S0014-5793(97)01261-1. [DOI] [PubMed] [Google Scholar]
- Senter P. D.; Al-Abed Y.; Metz C. N.; Benigni F.; Mitchell R. A.; Chesney J.; Han J.; Gartner C. G.; Nelson S. D.; Todaro G. J.; Bucala R. Proc. Natl. Acad. Sci. U. S. A. 2002, 99, 144–149. 10.1073/pnas.011569399. [DOI] [PMC free article] [PubMed] [Google Scholar]
- Cournia Z.; Leng L.; Gandavadi S.; Du X.; Bucala R.; Jorgensen W. L. J. Med. Chem. 2009, 52, 416–424. 10.1021/jm801100v. [DOI] [PMC free article] [PubMed] [Google Scholar]
- Pantouris G.; Syed M. A.; Fan C.; Rajasekaran D.; Cho T. Y.; Rosenberg E. M. Jr; Bucala R.; Bhandari V.; Lolis E. J. Chem. Biol. 2015, 22, 1197–1205. 10.1016/j.chembiol.2015.08.006. [DOI] [PMC free article] [PubMed] [Google Scholar]
- Orita M.; Yamamoto S.; Katayama N.; Aoki M.; Takayama K.; Yamagiwa Y.; Seki N.; Suzuki H.; Kurihara H.; Sakashita H.; Takeuchi M.; Fujita S.; Yamada T.; Tanaka A. J. Med. Chem. 2001, 44, 540–547. 10.1021/jm000386o. [DOI] [PubMed] [Google Scholar]
- Ouertatani-Sakouhi H.; El-Turk F.; Fauvet B.; Cho M.-K.; Karpinar D. P.; Le Roy D.; Dewor M.; Roger T.; Bernhagen J.; Calandra T.; Zweckstetter M.; Lashuel H. A. J. Biol. Chem. 2010, 285, 26581–26598. 10.1074/jbc.M110.113951. [DOI] [PMC free article] [PubMed] [Google Scholar]
- Xu L.; Zhang Y.; Zheng L.; Qiao C.; Li Y.; Li D.; Zhen X.; Hou T. J. Med. Chem. 2014, 57, 3737–3745. 10.1021/jm401908w. [DOI] [PubMed] [Google Scholar]
- Tsai L.-T.; Lin T.-H. J. Biomol. Screening 2014, 19, 1116–1123. 10.1177/1087057114523317. [DOI] [PubMed] [Google Scholar]
- Dziedzic P.; Cisneros J. A.; Robertson M. J.; Hare A. A.; Danford N. E.; Baxter R. H.; Jorgensen W. L. J. Am. Chem. Soc. 2015, 137, 2996–3003. 10.1021/ja512112j. [DOI] [PMC free article] [PubMed] [Google Scholar]
- Al-Abed Y.; Dabideen D.; Aljabari B.; Valster A.; Messmer D.; Ochani M.; Tanovic M.; Ochani K.; Bacher M.; Nicoletti F.; Metz C.; Pavlov V. A.; Miller E. J.; Tracey K. J. J. Biol. Chem. 2005, 280, 36541–36544. 10.1074/jbc.C500243200. [DOI] [PubMed] [Google Scholar]
- Balachandran S.; Rodge A.; Gadekar P. K.; Yadav V. N.; Kamath D.; Chetrapal-Kunwar A.; Bhatt P.; Srinivasan S.; Sharma S.; Vishwakarma R. A.; Dagia N. M. Bioorg. Med. Chem. Lett. 2009, 19, 4773–4776. 10.1016/j.bmcl.2009.06.052. [DOI] [PubMed] [Google Scholar]
- Cisneros J. A.; Robertson M. J.; Valhondo M.; Jorgensen W. L. Bioorg. Med. Chem. Lett. 2016, 26, 2764–2767. 10.1016/j.bmcl.2016.04.074. [DOI] [PubMed] [Google Scholar]
- For a review, see:Lea W. A.; Simeonov A. Expert Opin. Drug Discovery 2011, 6, 17–32. 10.1517/17460441.2011.537322. [DOI] [PMC free article] [PubMed] [Google Scholar]
- Billich A.; Lehr P.; Gstach H.. PCT/EP2005/011233, WO2006/045505 A1, 2006.
- Winner M.; Meier J.; Zierow S.; Rendon B. E.; Crichlow G. V.; Riggs R.; Bucala R.; Leng L.; Smith N.; Lolis E.; Trent J. O.; Mitchell R. A. Cancer Res. 2008, 68, 7253–7257. 10.1158/0008-5472.CAN-07-6227. [DOI] [PMC free article] [PubMed] [Google Scholar]
- Bai F.; Asojo O. A.; Cirillo P.; Ciustea M.; Ledizet M.; Aristoff P. A.; Leng L.; Koski R. A.; Powell T. J.; Bucala R.; Anthony K. G. J. Biol. Chem. 2012, 287, 30653–30663. 10.1074/jbc.M112.385583. [DOI] [PMC free article] [PubMed] [Google Scholar]
- Rossi A. M.; Taylor C. W. Nat. Protoc. 2011, 6, 365–87. 10.1038/nprot.2011.305. [DOI] [PMC free article] [PubMed] [Google Scholar]
- Smart P. L.; Laidlaw I. M. S. Water Resour. Res. 1977, 13, 15–33. 10.1029/WR013i001p00015. [DOI] [Google Scholar]
- Stamps S. L.; Fitzgerald M. C.; Whitman C. P. Biochemistry 1998, 37, 10195–10202. 10.1021/bi9806955. [DOI] [PubMed] [Google Scholar]
- Seidler J.; McGovern S. L.; Doman T. N.; Shoichet B. K. J. Med. Chem. 2003, 46, 4477–4486. 10.1021/jm030191r. [DOI] [PubMed] [Google Scholar]
- Zhang J. H.; Chung T. D.; Oldenburg K. R. J. Biomol. Screening 1999, 4, 67–73. 10.1177/108705719900400206. [DOI] [PubMed] [Google Scholar]
- Burley S. K.; Petsko G. A. FEBS Lett. 1986, 203, 139–143. 10.1016/0014-5793(86)80730-X. [DOI] [PubMed] [Google Scholar]
- Ma J. C.; Dougherty D. A. Chem. Rev. 1997, 97, 1303–1324. 10.1021/cr9603744. [DOI] [PubMed] [Google Scholar]
- Hopkins A. L.; Groom C. R.; Alex A. Drug Discovery Today 2004, 9, 430–431. 10.1016/S1359-6446(04)03069-7. [DOI] [PubMed] [Google Scholar]
- Barreiro G.; Kim J. T.; Guimarães C. R. W.; Bailey C. M.; Domaoal R. A.; Wang L.; Anderson K. S.; Jorgensen W. L. J. Med. Chem. 2007, 50, 5324–5329. 10.1021/jm070683u. [DOI] [PMC free article] [PubMed] [Google Scholar]
- a Moyano A.; Charbonnier F.; Greene A. E. J. Org. Chem. 1987, 52, 2919–2922. 10.1021/jo00389a048. [DOI] [Google Scholar]; b Graf K.; Rühl C. L.; Rudolph M.; Rominger F.; Hashmi A. S. Angew. Chem., Int. Ed. 2013, 52, 12727–12731. 10.1002/anie.201304813. [DOI] [PubMed] [Google Scholar]
- Meyers A. I.; Mihelich E. D. Angew. Chem., Int. Ed. Engl. 1976, 15, 270–281. 10.1002/anie.197602701. [DOI] [Google Scholar]
Associated Data
This section collects any data citations, data availability statements, or supplementary materials included in this article.


