

Abstract
Objective
To examine the effect of a change in U.S. Preventive Services Task Force (USPSTF) screening guidelines on mammography rates in the United States.
Principal Findings
In 2010, the year following the change in guidelines, 12‐month mammography prevalence among women aged 40–49 years fell by 2.09 percentage points (95 percent confidence interval [CI]: −2.87 to −1.31) from 54.63 percent in 2008. For women aged 50–74 years, and aged 75 years and older, 12‐month screening rates were 2.21 (95 percent CI: −2.65 to −1.77) and 3.60 (95 percent CI: −4.48 to −2.70) percentage points lower than those in 2008. In 2012, for women aged 40–49 years, 12‐month prevalence fell to 52.51 percent, a decline of 2.12 percentage points (95 percent CI: −2.79 to −1.32) relative to screening rates prior the USPSTF announcement. For women aged 50–74 years and aged 75 years and older screening rates were 2.45 (95 percent CI: −2.96 to −2.07) and 5.71 (95 percent CI: −6.61 to −4.81) percentage points lower, respectively, in 2012 than in 2008.
Conclusion
This study demonstrates an immediate and lasting reduction in the rates of breast cancer screening among women of all age groups after the 2009 revision of screening guidelines by the USPSTF.
Keywords: Mammography, screening prevalence, change in guidelines
In 2002, the U.S. Preventive Services Task Force (USPSTF) recommended that all women over age 40 years have a screening mammography every 1–2 years. On November 16, 2009, the USPSTF updated their recommendations and proposed a less aggressive approach to breast cancer screening. The new 2009 guidelines recommended against routine screening mammography for women aged 40–49 years and women aged 75 years and older, and recommended biennial breast cancer screening for women aged 50–74 years, instead of every 1–2 years (U.S. Preventive Services Task Force, 2009c).
The new USPSTF screening mammography recommendations were not received well by the U.S. cancer societies, public advocacy groups, politicians, and medical community leaders. Many who had stated their support for annual screening called the newest recommendations “ill‐advised” (American Medical Association, 2010). During the development of the 2010 U.S. health reform, many were concerned that the USPSTF recommendations were an example of how health care would be rationed under the Affordable Care Act if the legislation were to pass (Squiers et al. 2011). In response to the public criticism, the U.S. Senate passed amendments to its proposed health care reform, that compelled the government to ignore the 2009 USPSTF recommendations and required insurance companies to cover annual breast cancer screening for all women over age 40 years with no‐cost sharing to the patient as part of the Affordable Care Act (The Patient Protection and Affordable Care Act, 2010).
On December 4, 2009, the USPSTF updated the recommendation regarding women under age 50 years. The updated guidelines stated: “The decision to start regular, biennial screening mammography before the age of 50 years should be an individual one and take patient context into account, including the patient's values regarding specific benefits and harms” (U.S. Preventive Services Task Force, 2009a). In addition, the USPSTF concluded that the evidence was insufficient to recommend for or against routine screening mammography in women older than 75 years (U.S. Preventive Services Task Force, 2009a).
Prior research is inconclusive as to whether the revision of breast cancer screening recommendations had positive or negative impact on screening rates in the United States (Howard and Adams 2012; Block et al. 2013; Wang et al. 2014; Yao, Bradley, and Miranda 2014). Using the Behavioral Risk Factors Surveillance System (BRFSS) 2006–2012, cross‐sectional population‐based surveys with 2 years of follow‐up data, this paper reexamines the effect of the changed guidelines by comparing 12‐month mammography prevalence rates in the United States in 2008, 2010, and 2012. We hypothesize that the 2009 USPSTF revised guidelines had both an initial and long‐term negative impact on breast cancer screening rates among women of all age groups.
Relevant Literature
Howard and Adams (2012) examined the effect of the 2009 USPSTF change in breast cancer screening guidelines on receipt of mammography. They used close to 30,000 observations from the Medical Expenditure Panel Survey (MEPS) for 2006–2010 and employed a logistic regression approach to estimate the probability of mammography use in the past 1 and 2 years. The impact of the revised recommendations was estimated by comparing regression‐adjusted screening rates for 2006–2009 and 2010. The study concluded that neither annual nor biennial mammography rates were significantly affected by the new recommendations. In addition, Yao, Bradley, and Miranda (2014), also using the Medical Expenditure Panel Survey, examined self‐reported annual and biennial mammography screening rates in 2008, 2009, and 2010. They concluded that following the USPSTF change in guidelines, screening rates in the United States exhibited slightly positive, if any, response, especially among younger women. However, the use of longitudinal data may not necessarily be valuable in studying the effect of the revised recommendations of screening rates as age, time period, and cohort effects are inherently confounded with each other, and the three are difficult to separate statistically (Baltes 1968; Mason et al. 1973). In the case of breast cancer screening, it is possible that estimates of the effects based on panel data may be higher than expected due to natural aging on the cohort as the risk of the disease and the probability of screening increases with a woman's age. Block et al. (2013) examined mammography use in 2010 versus 2006–2008 period among women aged 40–49 years in Washington, DC, relative to women aged 50–74 years using BRFSS. The study concluded there was no reduction in mammography among women aged 40–49 years relative to women aged 50–74 years, suggesting noncompliance with the 2009 USPSTF recommendations among the former group. On the other hand, a few published studies demonstrated a reduction in screening rates following the revision of screening guidelines in 2009. Among such studies, Wang et al. (2014) detected a modest temporary reduction in the mammography rates among women aged 40–49 years after the change in the USPSTF guidelines using IMS LifeLink Health Plan Claims Databases 2006–2011 and conducting an interrupted time‐series analysis. In addition, Finney Rutten et al. (2014) found a substantially large decline in screening among women of all age groups postchange in guidelines in a study of mammography rates from 2004 to 2013 in Olmsted County, MN. Our paper improves on these previously published studies by analyzing a large, nationally representative, cross‐sectional sample of mammography rates using BRFSS surveys for 2006–2012.
Data and Methods
In this study, we used nationally representative cross‐sectional surveys from BRFSS for 2006–2012 to examine the effect of the 2009 USPSTF updated recommendations on the prevalence of mammography in the United States among women of all age groups. The BRFSS is an ongoing nationally representative annual cross‐sectional survey of adults regarding their health practices and health‐related risky behaviors. The surveys were conducted by state health departments under the administration of the Centers for Disease Control and Prevention (CDC) to monitor the nation's progress toward the Healthy People 2020 objectives. At the time this research was conducted, BRFSS was the largest ongoing multimode (mail, landline phone, and cell phone) survey in the world and was publicly available online for 1983–2012. Each year of the BRFSS surveys included three parts: (1) the core component; (2) optional modules; and (3) state‐added questions. Since 2000, questions regarding women's health, including history of mammography visits, were asked in the even years in all of the states as part of the BRFSS fixed core questionnaire.
Mammography rates were calculated as a proportion of women who reported they had a mammogram within (1) 1 and (2) 2 years of the interview. As the BRFSS conducted nation‐wide mammography surveys only in the even years since 2000, we were able to include 2 years of follow‐up data after the USPSTF revised the screening recommendation: 2010 and 2012 (no nationally representative surveys were conducted in 2011 or 2013). In this case, using BRFSS, a population‐based cross‐sectional survey, presented a couple of advantages. First, we were able to avoid the issue associated with the natural aging of the cohort affecting the screening behavior. Second, respondents of the BRFSS surveys were women themselves, which was not necessarily the case in the MEPS: any member of the household answered the question about mammography use, which might not have been as accurate as women's direct responses.
We used logistic regression and employed the same specification as in Howard and Adams (2012) for comparability of the results. In particular, the regression model estimated the probability that a woman had a mammogram in the past 12 months as a function of age, race, marital status, health insurance, college degree, and employment status. We controlled for regional unobserved effects by constructing four regions (Northeast, Midwest, South, and West) using states' FIPS codes that came with the BRFSS and the U.S. Census Region Codes and Names. To account for time‐specific influences on mammography rates, we used year dummy variables for 2006–2012, with 2006 being the omitted category, again to make the results comparable to Howard and Adams (2012). Finally, to control for general economic conditions, we included state‐level gross domestic product by year obtained from the Bureau of Economic Analysis website. The analysis was stratified by age group: women aged 40–49 years, aged 50–75 years, and 75 years and older, with a total of 570,360 survey participants. Summary statistics for the variables are presented in Table 1.
Table 1.
Summary Statistics of Variables, BRFSS 2006–2012
| Age 40–49 | Age 50–75 | Age 75 and Older | |
|---|---|---|---|
| Mean (SD) | Mean (SD) | Mean (SD) | |
| Mammogram use the past 12 months | 53.46 (0.50) | 64.84 (0.48) | 53.46 (0.49) |
| Sociodemographic characteristics | |||
| Age | 44.71 (2.88) | 60.90 (6.89) | 80.96 (4.70) |
| Any Insurance | 0.86 (0.34) | 0.92 (0.28) | 0.98 (0.11) |
| Married | 0.66 (0.48) | 0.54 (0.49) | 0.24 (0.43) |
| College degree | 0.41 (0.49) | 0.33 (0.47) | 0.20 (0.40) |
| Employed | 0.74 (0.44) | 0.47 (0.49) | 0.05 (0.22) |
| Race | |||
| White | 0.76 (0.43) | 0.82 (0.38) | 0.88 (0.32) |
| Black | 0.10 (0.30) | 0.09 (0.28) | 0.06 (0.23) |
| Hispanic | 0.08 (0.27) | 0.04 (0.21) | 0.03 (0.16) |
| Asian | 0.02 (0.14) | 0.01 (0.12) | 0.01 (0.11) |
| Indian/Alaskan | 0.01 (0.11) | 0.01 (0.10) | 0.006 (0.08) |
| Other | 0.02 (0.15) | 0.02 (0.15) | 0.02 (0.13) |
| Region | |||
| Northeast | 0.13 (0.34) | 0.12 (0.33) | 0.12 (0.33) |
| Midwest | 0.30 (0.46) | 0.29 (0.46) | 0.33 (0.47) |
| South | 0.33 (0.47) | 0.35 (0.46) | 0.33 (0.47) |
| West | 0.23 (0.42) | 0.24 (0.43) | 0.23 (0.42) |
| State GDP (in trillions) | 0.38 (0.40) | 0.37 (0.39) | 0.39 (0.41) |
| N | 127,556 | 350,908 | 91,911 |
Statistics reported are mean coefficients; standard deviations in parentheses.
We used weighted BRFSS data which represented the actual responses of each woman adjusted for the probability of selection of population subgroups and nonresponse rate. The use of the final weights provided by the CDC for each year was necessary if generalizations were to be made from the sample to the population (Behavioral Risk Factors Surveillance System, 2011). As in 2011 a different weighting methodology was applied to BRFSS to better reflect state‐level sociodemographics, final weights for 2012 were constructed according to the procedures outlined by the CDC (Behavioral Risk Factors Surveillance System, 2013). Using unweighted data did not significantly change the findings and the conclusion of this study.
Results
Results of the logistic regressions of 12‐month screening prevalence indicated that the odds ratios on the 2010 and 2012 year dummies were significantly below unity across all of the age groups (Table 2). In particular, in 2010, women aged 40–49 years were 6.0 percentage points less likely to report screening in the past 12 months in 2010, whereas women aged 50–75 years and those older than 75 years were less likely to report a mammogram by 10.1 and 11.4 percentage points, respectively. The reduction in screening rates across all age groups was sizeable with none of the 95 percent confidence intervals (95 percent CIs) including unity. In addition, in 2012, 2 years after the 2009 USPSTF announcement, the use of mammography within 12 months of interview declined even further among women of all age groups.
Table 2.
Odds of Mammography Use in the Past 12 Months of Interview by Age Group, 2006–2012
| Age 40–49 | Age 50–75 | Age 75 and Older | |
|---|---|---|---|
| OR (95% CI) | OR (95% CI) | OR (95% CI) | |
| Age | 1.086*** (1.081–1.090) | 1.015*** (1.014–1.017) | 0.930*** (0.927–0.933) |
| Any insurance | 3.179*** (3.062–3.300) | 3.314*** (3.229–3.401) | 1.583*** (1.405–1.783) |
| Married | 1.210*** (1.181–1.241) | 1.396*** (1.376–1.417) | 1.296*** (1.254–1.339) |
| College degree | 1.279*** (1.249–1.311) | 1.335*** (1.314–1.356) | 1.313*** (1.269–1.359) |
| Employ | 1.183*** (1.152–1.214) | 1.061*** (1.044–1.078) | 0.965 (0.907–1.027) |
| Black | 1.445*** (1.387–1.505) | 1.502*** (1.462–1.543) | 1.195*** (1.127–1.268) |
| Hispanic | 1.318*** (1.259–1.379) | 1.181*** (1.140–1.224) | 0.929* (0.853–1.011) |
| Asian/Pacific | 1.007 (0.931–1.089) | 1.119*** (1.051–1.191) | 1.299*** (1.150–1.467) |
| Indian/Alaskan Native | 0.908* (0.818–1.009) | 0.862*** (0.806–0.923) | 0.778*** (0.652–0.929) |
| Other | 0.959 (0.889–1.035) | 0.838*** (0.799–0.880) | 0.875** (0.789–0.970) |
| 2008 | 1.010 (0.978–1.043) | 0.995 (0.973–1.018) | 1.020 (0.977–1.065) |
| 2010 | 0.940*** (0.909–0.971) | 0.899*** (0.879–0.918) | 0.886*** (0.850–0.924) |
| 2012 | 0.943*** (0.911–0.975) | 0.878*** (0.859–0.897) | 0.823*** (0.790–0.858) |
| Northeast | 1.735*** (1.667–1.807) | 1.741*** (1.696–1.788) | 1.528*** (1.454–1.605) |
| Midwest | 1.270*** (1.229–1.311) | 1.168*** (1.145–1.192) | 1.123*** (1.081–1.165) |
| South | 1.249*** (1.210–1.289) | 1.157*** (1.135–1.180) | 1.153*** (1.111–1.197) |
| State GDP | 1.119*** (1.086–1.153) | 1.153*** (1.132–1.175) | 1.148*** (1.110–1.187) |
| Constant | 0.006*** (0.005–0.007) | 0.151*** (0.139–0.164) | 236.606*** (179.739–311.464) |
| Observations | 127,556 | 350,908 | 91,896 |
Omitted categories: 2006 (year), West (region), white (race), uninsured.
***p < .01, **p < .05, *p < .1.
In 2010, regression‐adjusted screening rates within the past 12 months among women aged 40–49 years fell to 52.55 percent, a reduction of 2.09 percentage points (95 percent CI: −2.87 to −1.31) in comparison to 2008 (Figure 1 and Table 3). For women aged 50–74 years, the 12‐month mammography prevalence decreased from 66.69 to 64.47 percent, a reduction of 2.21 percentage points (95 percent CI: −2.65 to −1.77), while for women aged 75 years and older, screening rates fell by 3.59 percentage points (95 percent CI: −4.48 to −2.70) from 59.60 to 56.00 percent.
Figure 1.
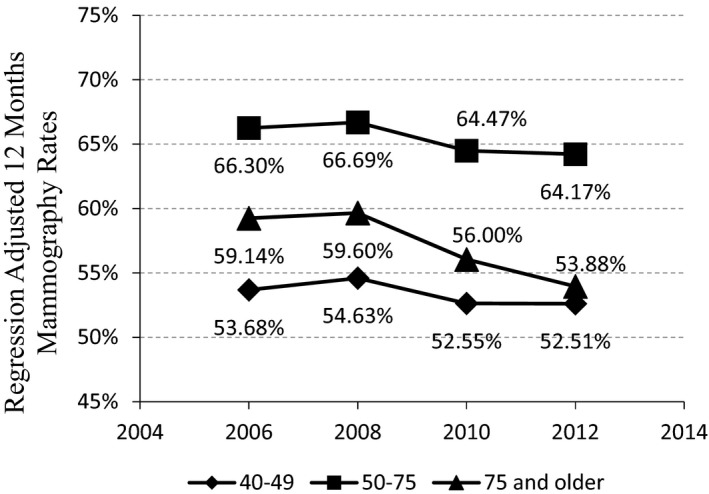
Regression‐Adjusted 12‐Month Mammography Rates, 2006–2012
Notes. The graph displays the proportion of women who reported having a mammogram in the past 12 months of the interview, adjusted for demographics, socioeconomic status, region, and change in state‐level GDP. Each one of the nodes was calculated by predicting marginal effects at the means of the explanatory variables for each year using the above regression coefficients.
Table 3.
Contrast of Predicted Rates of Mammography Use within 12 Months of Interview, 2008–2012
| Year | Contrast | Delta Method Standard Error | 95% Confidence Interval |
|---|---|---|---|
| Age 40–49 years | |||
| 2010 vs. 2008 | −0.0209 | 0.0040 | (−0.0287 to −0.0131) |
| 2012 vs. 2008 | −0.0212 | 0.0041 | (−0.0292 to −0.0132) |
| Age 50–74 years | |||
| 2010 vs. 2008 | −0.0221 | 0.0022 | (−0.0265 to −0.0177) |
| 2012 vs. 2008 | −0.0252 | 0.0023 | (−0.0296 to −0.0207) |
| Age 75 years and older | |||
| 2010 vs. 2008 | −0.0360 | 0.0045 | (−0.0448 to −0.0270) |
| 2012 vs. 2008 | −0.0571 | 0.0046 | (−0.0661 to −0.0481) |
The contrasts were obtained by pairwise comparison of predicted mammography rates, by year and age group, using the regression coefficients. Standard errors and 95% confidence intervals were obtained using Delta method.
In 2012, the 12‐month prevalence of screening decreased even further among women of all age groups. For women aged 40–49 years, regression‐adjusted screening rates fell to 52.51 percent, a decline of 2.12 percentage points (95 percent CI: −2.92 to −1.32) relative to screening rates before the USPSTF announcement. For women aged 50–74 years and aged 75 years and older screening rates were 2.52 (95 percent CI: −2.96 to −2.07) and 5.71 (95 percent CI: −6.61 to −4.81) percentage points lower respectively in 2012 than in 2008.
Comparing the 95 percent CIs of mean predicted mammography rates within 12 months of the interview for 2008, 2010, and 2012 revealed that the means before and after the changes in guidelines were statistically different from one another for women across all age groups as the 95 percent CIs of 2008 and 2010 did not overlap (Figure 2).
Figure 2.
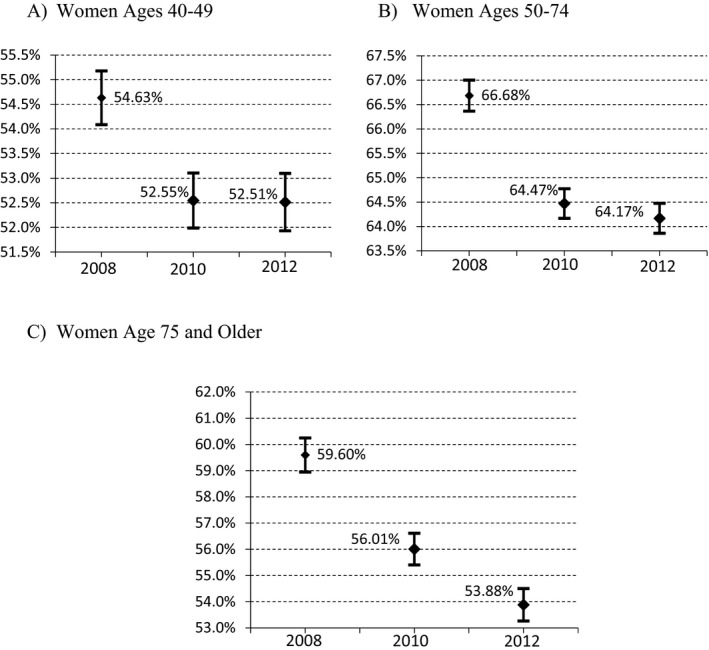
Regression‐Adjusted 12‐Month Mammography Rates and 95 percent Confidence Intervals for Women by Age Group for 2008, 2010, and 2012
Results based on biennial mammography prevalence were consistent with our finding of the initial and lasting negative effect of the 2009 USPSTF revised recommendations (results presented in the Appendix).
Discussion and Conclusion
This study found that women over age 40 years responded to the 2009 USPSTF revised breast cancer screening guidelines by reducing the frequency of mammograms. During the period analyzed, there were no changes in insurance coverage, and annual mammogram screenings were covered by private insurers and Part B Medicare for all women aged 40 years and older at little or no cost to them. Furthermore, of the eight organizations in the United States making breast cancer screening recommendations, USPSTF was the only one that recommended biennial, rather than annual, mammography for women aged 50–74 years and advised against routine screening for women aged 40–49 years and women aged 75 years and older (Tables A3 and A4). Still, women changed their screening behavior. One possible explanation of this phenomenon may be the public's sensitivity to extensive media coverage of the revised guidelines and the evidence that led to the USPSTF decision, specifically potential harms of false positive tests and overdiagnosis. Given that USPSTF has always enjoyed the reputation of independence and quality (Gusmano and Gray 2010), and that the new guidelines were also embraced by several other respectable health groups (Breast Cancer Action, The National Women's Health Network, the National Breast Cancer Coalition, and Our Bodies Ourselves), the fact that women were sensitive to the 2009 update of recommendations is perhaps not so astounding.
One potential concern for policy makers is that the reduction in breast cancer screening rates may have led to fewer cancers being diagnosed at earlier stages, which in turn may have increased breast cancer mortality rates. Using online data and applications from the Surveillance, Epidemiology, and End Results (SEER) program of the National Cancer Institute (seer.cancer.gov), we calculated the incidence rates of in situ and invasive breast cancer as well as deaths rates from breast cancer for women of similar age groups during the years of our study (Table A5). Not surprisingly, we observed declines in the incidence rates of in situ breast cancer for all age groups after the 2009 USPSTF revision of guidelines. For example, in situ incidence declined from 23.8 in 2009 to 22.6 in 2012 for women younger than 49 years and fell from 82.6 in 2009 to 71.0 in 2012 for women older than 75 years (rates are per 100,000). Although the number of cases diagnosed at earlier stages of cancer declined after 2009, it is important to note that early detection through screening does not always mean prolonged survival or improved quality of life. In fact, the new USPSTF recommendations were based on the evidence that routine annual screening of women aged 40–49 years resulted in a very small net benefit due to high rates of false‐positive results, unnecessary additional imaging tests and biopsies, overdiagnosis, and increased anxiety—all of which are associated with their own health risks and lower quality of life (U.S. Preventive Services Task Force, 2009b).
Although in situ incidence declined for all age groups, this was not the case with invasive breast cancer diagnosis rates after the 2009 announcement. Incidence rates for invasive breast cancer for women younger than 49 years old declined from 162.1 in 2009 to 154.6 in 2012. However, for women aged 75 years and older the incidence increased from 438.6 to 443.2. Interestingly, this pattern is consistent with our logit results showing that the greatest decline in the probability of having a mammogram occurred among women aged 75 years or older (5.71 percentage points) between 2008 and 2012 (Figure 1).
Finally, breast cancer death rates maintained the declining trend after the 2009 USPSTF changes in recommendations for all age groups. For example, deaths rates from breast cancer declined from 18.0 in 2006 to 17.1 in 2008 to 16.7 in 2012 for women aged 40–49 years. Similarly, death rates were 134.8 in 2006, 130.2 in 2008, and 124.3 in 2012 for women aged 75 years or older. Although a thorough analysis of the impact of lower screening rates after 2009 on breast cancer health outcomes is an interesting topic for future research, the focus of this study was on the effects of the 2009 revised guidelines on screening rates. However, it is important for policy makers to know that the decline in mammography rates was not correlated with an increase in breast cancer mortality during the study period.
These findings must be interpreted with some caution. First, the nature of the data does not allow for distinguishing between routine screenings versus diagnostic mammography, which may result in the overestimation of the rate of screening mammograms. Second, although many relevant variables were included in the analysis, we were unable to control for family history of breast cancer or past individual screening experiences, which may have led to biased regression estimates. Unfortunately, BRFSS does not allow for such factors to be taken into account. The third limitation stems from the fact that annual mammography is perceived to be a socially desirable behavior, and that telephone respondents may be more likely to present themselves in socially desirable ways than face‐to‐face interview respondents (Holbrook, Green, and Krosnick 2003). Moreover, prior research suggested that women, especially non‐Hispanic and non‐white, tend to overreport mammography participation (Fiscella et al. 2006; Holt et al. 2006). However, we would not expect any of these biases to change over time. Lastly, the effect of the changes in recommendations were measured by including year indicator variables in the regression analysis, which may also reflect other influences on mammography rates, such as changes in screening technology.
Among the strengths of this study was the use of nationally representative cross‐sectional data, which allowed us to draw conclusions about population‐wide screening behavior while avoiding the problem of the natural aging of cohorts. In addition, by extending the study period to 2012, we were able to provide information about the long‐term effects of the 2009 USPSTF revised screening guidelines on national mammography rates.
Supporting information
Appendix SA1: Author Matrix.
Figure A1: Regression‐Adjusted 24‐Month Mammography Rates, 2006–2012. The graph displays the proportion of women who reported having a mammogram in the past 24 months of the interview, adjusted for demographics, socioeconomic status, region, and state‐level GDP. Each one of the nodes was calculated by predicting marginal effects at the means of the explanatory variables for each year using the above regression coefficients.
Figure A2: Regression‐Adjusted 24‐Month Mammography Rates and 95 percent Confidence Intervals for Women by Age Group for 2008, 2010, and 2012.
Table A1: Odds of Mammography Receipt within 24 Months of Interview by Age Group, 2006–2012.
Table A2: Contrast of Predicted Rates of Mammography Receipt within 24 Months of Interview, 2008–2012.
Table A3: The USPSTF Breast Cancer Screening Recommendations in Chronological Order.
Table A4: Summary of Current Breast Cancer Recommendations.
Table A5: Breast Cancer Incidence and Death Rates by Age Group, 2006–2012.
Acknowledgments
Joint Acknowledgment/Disclosure Statement: The authors worked on this publication as employees of their respective public institutions: Natallia Gray, Southeast Missouri State University; Gabriel Picone, University of South Florida.
Disclosures: None.
Disclaimers: None.
References
- American Medical Association . 2010. “Report 6 of the Council on Science and Public Health” [accessed on July 6, 2013]. Available at http://www.ama-assn.org//resources/doc/csaph/a12-csaph6-screeningmammography.pdf
- Baltes, P. B. 1968. “Longitudinal and Cross‐Sectional Sequences in the Study of Age and Generation Effects.” Human Development 11 (3): 145–71. [DOI] [PubMed] [Google Scholar]
- Behavioral Risk Factors Surveillance System . 2011. ”Survey Data Information: Comparability of Data” [accessed on January 19, 2015]. Available at http://www.cdc.gov/brfss/annual_data/annual_2011.html
- Behavioral Risk Factors Surveillance System . 2013. ”Module Data for Analysis for 2012 BRFSS” [accessed on January 19, 2015]. Available at http://www.cdc.gov/brfss/annual_data/2012/pdf/AnalysisofModules_2012.pdf
- Block, L. D. , Jarlenski M. P., Wu A. W., and Bennett W. L.. 2013. “Mammography Use among Women Ages 40‐49 after the 2009 U.S. Preventive Services Task Force recommendation.” Journal of General Internal Medicine 28 (11): 1447–53. doi:10.1007/s11606‐013‐2482‐5. [DOI] [PMC free article] [PubMed] [Google Scholar]
- Finney Rutten, L. J. , Ebbert J. O., Jacobson D. J., Squiers L. B., Fan C., Breitkopf C. R., and St Sauver J. L.. 2014. “Changes in U.S. Preventive Services Task Force Recommendations: Effect on Mammography Screening in Olmsted County, MN 2004‐2013.” Preventive Medicine 69: 235–8. doi:10.1016/j.ypmed.2014.10.024. [DOI] [PMC free article] [PubMed] [Google Scholar]
- Fiscella, K. , Holt K., Meldrum S., and Franks P.. 2006. “Disparities in Preventive Procedures: Comparisons of Self‐Report and Medicare Claims Data.” BMC Health Services Research 6 (1): 122. [DOI] [PMC free article] [PubMed] [Google Scholar]
- Gusmano, M. K. , and Gray B. H.. 2010. “Evidence and Fear: Navigating the Politics of Evidence Based Medicine.” Academy Health Reports 38: 1–5. [Google Scholar]
- Holbrook, A. L. , Green M. C., and Krosnick J. A.. 2003. “Telephone versus Face‐to‐Face Interviewing of National Probability Samples with Long Questionnaires: Comparisons of Respondent Satisficing and Social Desirability Response Bias.” Public Opinion Quarterly 67 (1): 79–125. [Google Scholar]
- Holt, K. , Franks P., Meldrum S., and Fiscella K.. 2006. “Mammography Self‐Report and Mammography Claims: Racial, Ethnic, and Socioeconomic Discrepancies among Elderly Women.” Medical Care 44 (6): 513–8. [DOI] [PubMed] [Google Scholar]
- Howard, D. H. , and Adams E. K.. 2012. “Mammography Rates after the 2009 US Preventive Services Task Force Breast Cancer Screening Recommendation.” Preventive Medicine 55 (5): 485–7. [DOI] [PubMed] [Google Scholar]
- Mason, K. O. , Mason W. M., Winsborough H. H., and Poole W. K.. 1973. “Some Methodological Issues in Cohort Analysis of Archival Data.” American Sociological Review 38 (2): 242–58. [Google Scholar]
- Squiers, L. B. , Holden D. J., Dolina S. E., Kim A. E., Bann C. M., and Renaud J. M.. 2011. “The Public's Response to the US Preventive Services Task Force's 2009 Recommendations on Mammography Screening.” American Journal of Preventive Medicine 40 (5): 497–504. [DOI] [PubMed] [Google Scholar]
- The Patient Protection and Affordable Care Act, 42 U.S.C. § 18001 et seq . 2010. [accessed on January 23, 2015]. Available at http://www.gpo.gov/fdsys/pkg/BILLS-111hr3590enr/pdf/BILLS-111hr3590enr.pdf
- U.S. Preventive Services Task Force . 2009a. “Screening for Breast Cancer Recommendations Statement” [accessed on July 6, 2013]. Available at http://www.uspreventiveservicestaskforce.org/uspstf09/breastcancer/brcanrs.htm
- U.S. Preventive Services Task Force . 2009b. “Final Recommendation Statement Breast Cancer: Screening, November 2009” [accessed on June 11, 2015]. Available at http://www.uspreventiveservicestaskforce.org/Page/Document/RecommendationStatementFinal/breast-cancer-screening#rationale
- U.S. Preventive Services Task Force . 2009c. “Screening for Breast Cancer: U.S. Preventive Services Task Force Recommendation Statement.” Annals of Internal Medicine 151 (10): 716–26. doi:10.7326/0003‐4819‐151‐10‐200911170‐00008. [DOI] [PubMed] [Google Scholar]
- Wang, A. T. , Fan J., Van Houten H. K., Tilburt J. C., Stout N. K., Montori V. M., and Shah N. D.. 2014. “Impact of the 2009 US Preventive Services Task Force Guidelines on Screening Mammography Rates on Women in Their 40s.” PLoS ONE 9 (3): e91399. [DOI] [PMC free article] [PubMed] [Google Scholar]
- Yao, N. , Bradley C. J., and Miranda P. Y.. 2014. “Mammography Use after the 2009 Debate.” Journal of Clinical Oncology 32 (35): 4023–4. [DOI] [PMC free article] [PubMed] [Google Scholar]
Associated Data
This section collects any data citations, data availability statements, or supplementary materials included in this article.
Supplementary Materials
Appendix SA1: Author Matrix.
Figure A1: Regression‐Adjusted 24‐Month Mammography Rates, 2006–2012. The graph displays the proportion of women who reported having a mammogram in the past 24 months of the interview, adjusted for demographics, socioeconomic status, region, and state‐level GDP. Each one of the nodes was calculated by predicting marginal effects at the means of the explanatory variables for each year using the above regression coefficients.
Figure A2: Regression‐Adjusted 24‐Month Mammography Rates and 95 percent Confidence Intervals for Women by Age Group for 2008, 2010, and 2012.
Table A1: Odds of Mammography Receipt within 24 Months of Interview by Age Group, 2006–2012.
Table A2: Contrast of Predicted Rates of Mammography Receipt within 24 Months of Interview, 2008–2012.
Table A3: The USPSTF Breast Cancer Screening Recommendations in Chronological Order.
Table A4: Summary of Current Breast Cancer Recommendations.
Table A5: Breast Cancer Incidence and Death Rates by Age Group, 2006–2012.