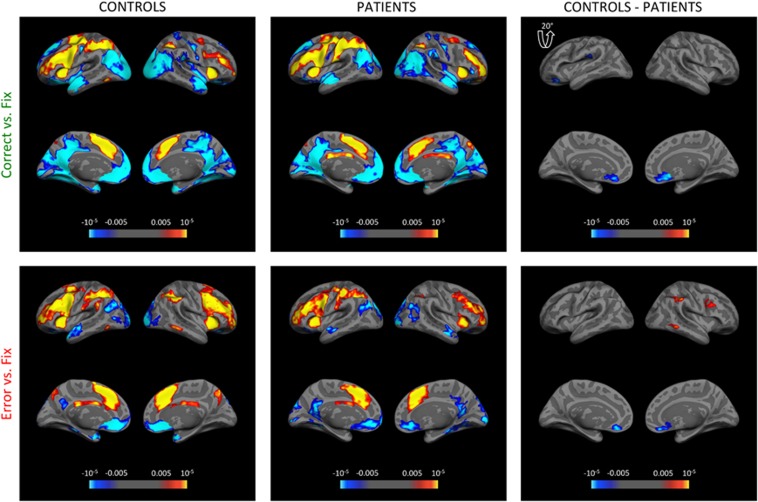
Figure 2.
Brain regions showing parametric activation in response to increasing task load during correct and error epochs. Each surface map is represented by four images with lateral and medial views on the left and right hemisphere. Maps for both control (left) and patient (middle) groups are shown together with group difference maps (right). Left lateral view of the group difference map for Correct vs Fix was tilted 20° for a better view of the postcentral gyrus. Both controls and patients demonstrated load-dependent activation in FPCN and deactivation in the DMN during correct epochs. Deactivation in mPFC was stronger in controls during both conditions. During error epochs, activation in the right dlPFC, SMG, and MTG was selectively stronger in controls. Colorbar denotes the p-value. All clusters displayed on maps survive correction for multiple comparisons using 10 000 Monte Carlo simulations at clusterwise p<0.05.

