

Abstract
Glucose and oxygen are two of the most important molecules transferred from mother to fetus during eutherian pregnancy, and the metabolic fates of these nutrients converge at the transport and metabolism of pyruvate in mitochondria. Pyruvate enters the mitochondrial matrix through the mitochondrial pyruvate carrier (MPC), a complex in the inner mitochondrial membrane that consists of two essential components, MPC1 and MPC2. Here, we define the requirement for mitochondrial pyruvate metabolism during development with a progressive allelic series of Mpc1 deficiency in mouse. Mpc1 deletion was homozygous lethal in midgestation, but Mpc1 hypomorphs and tissue-specific deletion of Mpc1 presented as early perinatal lethality. The allelic series demonstrated that graded suppression of MPC resulted in dose-dependent metabolic and transcriptional changes. Steady-state metabolomics analysis of brain and liver from Mpc1 hypomorphic embryos identified compensatory changes in amino acid and lipid metabolism. Flux assays in Mpc1-deficient embryonic fibroblasts also reflected these changes, including a dramatic increase in mitochondrial alanine utilization. The mitochondrial alanine transaminase GPT2 was found to be necessary and sufficient for increased alanine flux upon MPC inhibition. These data show that impaired mitochondrial pyruvate transport results in biosynthetic deficiencies that can be mitigated in part by alternative anaplerotic substrates in utero.
INTRODUCTION
Embryonic development in eutherian mammals is defined by ongoing metabolic interactions between mother and fetus. Placentas have evolved a sophisticated suite of adaptations to ensure adequate nutrient, gas, and waste exchange between fetus and mother, as well as hormonal and immunological communication (1, 2). To meet the fetal requirements for nutrient and oxygen consumption during pregnancy, maternal cardiac output increases such that uteroplacental blood flow accounts for ∼25% of total cardiac output (3). Glucose and oxygen are arguably the two most important molecules transferred from mother to fetus, in terms of both concentration and the multitude of physiological adaptations in place to ensure their adequate transport; however, the requirement for mitochondrial oxidative metabolism during embryonic development remains poorly defined.
While oxygen tension in utero is low relative to atmospheric levels, measurement of oxygen consumption and lactate uptake in fetal lambs provided evidence that the fetus is a net consumer rather than a producer of lactate (4). Consistent with this, fetal myocardium consumes a large amount of lactate, in addition to glucose, indicating that oxidative metabolism of carbohydrates is an important energy source in the developing heart (5, 6). Additionally, lactate utilization is high in the neonatal brain, and the capacity for lactate import is higher in the neonatal brain than in the adult brain (7). Together, these observations provide evidence for the importance of mitochondrial oxidative metabolism early in mammalian development. Supporting these metabolic preferences, a robust period of mitochondrial biogenesis has been characterized in midgestation mouse embryos (8). Indeed, many mouse models deficient in genes involved in mitochondrial DNA metabolism; electron transport chain components; and mitochondrial biogenesis, fission, and fusion die during this time (embryonic day 8 [e8] to e13) (reviewed in reference 8). These genetic models provide further evidence that mitochondrial oxidative metabolism plays an essential role before parturition in meeting the bioenergetic and biosynthetic needs of the developing fetus. In fact, many inborn errors of metabolism in humans manifest early in postnatal life, suggesting that these metabolic insufficiencies can be somewhat mitigated in utero but are exacerbated after parturition in the absence of maternal exchange.
Oxygen, glucose, and lactate all coalesce at the transport and metabolism of pyruvate in mitochondria. Although the mitochondrial pyruvate carrier (MPC) has been characterized biochemically since the 1970s (9, 10), the molecular identity was only recently determined when two essential components, MPC1 and MPC2, were shown to be necessary and sufficient to promote pyruvate transport across a membrane (11, 12). Unlike any other mitochondrial transporter studied to date, Saccharomyces cerevisiae Mpc1 and Mpc2 are small, 15-kDa proteins that are part of a 150-kDa complex in the inner mitochondrial membrane, as determined by blue native-polyacrylamide gel electrophoresis (BN-PAGE) (12, 13). While pyruvate is most notable as the end product of glycolysis in the cytosol, pyruvate lies at the intersection of carbohydrate, lipid, and amino acid catabolic and anabolic pathways. The transport of pyruvate into the mitochondrial matrix permits two main biochemical pathways: (i) its oxidative decarboxylation to acetyl coenzyme A (acetyl-CoA) via the pyruvate dehydrogenase complex or (ii) its carboxylation to oxaloacetate via the biotin-dependent pyruvate carboxylase. These two fates enable catabolic and anabolic pathways through the tricarboxylic acid (TCA) cycle to generate ATP and provide biosynthetic precursors of lipids and amino acids. Additionally, glucose can be derived from mitochondrial pyruvate and the cytosolic enzymes of gluconeogenesis in liver and kidney. Although the sources and fates of pyruvate depend upon cell-type-specific processes and the physiological state, the transport of pyruvate across the inner mitochondrial membrane in all cells is mediated by the MPC.
Here, we define the requirement for mitochondrial pyruvate metabolism during eutherian development with an allelic series for Mpc1 deficiency in mouse. Using a combination of steady-state metabolomics and metabolic-flux assays, we describe both tissue-specific and highly conserved compensatory adaptations to impaired mitochondrial pyruvate metabolism. Furthermore, substrate flux studies in cells derived from these genetic models define the metabolic requirement for mitochondrial pyruvate metabolism. These data provide evidence for significant cross talk and counterregulation between mitochondrial pyruvate utilization and other pathways of central carbon metabolism, highlighting the metabolic fate of pyruvate as a key regulatory node in carbohydrate, amino acid, and lipid metabolism.
MATERIALS AND METHODS
Generation of Mpc1 conditional knock-in and deletion alleles in mice.
Mpc1 knock-in (KI) mice were generated by targeting loxP sequences to introns flanking exons 3 to 5 of the mouse Mpc1 gene and targeting a transcriptional reporter construct to the 3′ untranslated region of Mpc1 (see Fig. S1A in the supplemental material) by homologous recombination in C57BL/6 mouse embryonic stem cells by standard methods. To generate mice with a germ line deletion of Mpc1, Mpc1lox/+ mice were bred to cytomegalovirus (CMV)-Cre transgenic mice, and deletion in Cre-negative F2 progeny was verified by PCR genotyping (Mpc1D/+). Additionally, Mpc1lox/+ mice were bred to nestin-Cre transgenic mice to delete Mpc1 specifically in the nervous system. Mpc1 heterozygous knock-in (Mpc1KI/+) and Mpc1 deletion (Mpc1D/+) mice and littermate controls were housed in a facility with ventilated racks on a 14-h light/10-h dark cycle with ad libitum access to a standard rodent chow (2018SX; Teklad Global; 18% protein). For timed matings, the presence of a copulatory plug in the morning was designated day 0.5, and pregnant females were housed separately.
Ethical statement.
All procedures were performed in accordance with the NIH's Guide for the Care and Use of Laboratory Animals and under the approval of the Johns Hopkins Medical School Animal Care and Use Committee.
Cell culture.
Mouse embryonic fibroblasts (MEFs) were obtained from timed pregnant dams by standard methods. Primary MEFs were maintained in Dulbecco's modified Eagle's medium (DMEM) (25 mM glucose) supplemented with 10% fetal bovine serum and 1% penicillin-streptomycin (pen-strep) antibiotic (Invitrogen) at 37°C in a humidity-controlled incubator at 10% CO2. For cell proliferation assays, MEFs were seeded in 35-mm dishes at 100,000 cells per well and counted every other day with regular medium changes.
Generation of GPT knockout (KO) HEK293T cells.
HEK293T cells were grown in DMEM (25 mM glucose) supplemented with 10% bovine calf serum and 1% pen-strep antibiotic and maintained as described above. The cells were transfected with a plasmid encoding both human Cas9 (hCas9) and a guide RNA (gRNA) targeting human glutamic-pyruvate transaminase 1 (hGPT1), hGPT2, or both GPT1 and GPT2 (pan-GPT) using FuGene HD (Promega) transfection reagent according to the manufacturer's instructions. Control cells were transfected with hCas9 alone. Selection with 7.5 μg/ml blasticidin was started 48 h posttransfection and continued for 2 weeks. Individual clones were selected by limited-dilution plating and screened for loss of GPT1, GPT2, or both by quantitative real-time (qRT)-PCR, by genomic PCR and Sanger sequencing, and by functional assay. For rescue experiments, human GPT1 and GPT2 were cloned from HEK293T cell oligo(dT)-primed cDNA, cloned into pEF6 expression vectors by InFusion cloning (Clontech), and sequence verified. Alanine transaminase activity was determined by colorimetric assay (Sigma).
CRISPR/Cas9 cloning strategy.
A human codon-optimized Cas9 expression vector, plasmid 41815 (14), was obtained from Addgene, and hCas9 was cloned into a pEF6 expression vector downstream and in frame with a nucleus-localized yellow fluorescent protein (YFP) linked by a viral 2A bicistronic peptide so that nls-YFP (where nls is nuclear localization signal) and Cas9 were expressed in approximately equimolar quantities. A 3× nuclear localization signal and a FLAG tag were also appended to the C terminus of hCas9 to allow screening for loss of Cas9 protein in mutant cell lines. gRNAs targeting human GPT1, GPT2, and a highly conserved site in both GPT1 and GPT2 were designed according to the recommendations of Mali et al. (14) and were computed as candidate unique gRNA targets. The gRNAs, including the U6 promoter, were synthesized as a 500-bp gBlocks fragment (Integrated DNA Technologies) and were cloned into the pEF6-nls-YFP-2A-Cas9-3x-nls-FLAG vector by InFusion cloning (Clontech).
Metabolic-flux assays.
To measure glucose uptake, MEFs were plated in 24-well dishes and labeled with 0.5 μCi [1,2-3H]2-deoxy-glucose at a final concentration of 6.5 mM 2-deoxy-glucose for 5, 10, and 20 min after 2 h in KRH buffer (20 mM HEPES, 136 mM NaCl, 4.7 mM KCl, 1.25 mM MgSO4, 1.25 mM CaCl2, 0.1% bovine serum albumin). After incubation, the cells were washed 4 times with KRH buffer and lysed with 0.3 ml 1% Triton X-100 in phosphate-buffered saline (PBS). The lysate was transferred to a vial containing 3 ml of scintillation fluid, and counts were normalized to total protein as determined by bicinchoninic acid (BCA) assay (Thermo Scientific).
To determine substrate incorporation into the total lipid fraction, MEFs were plated in 24-well dishes and labeled with radiolabeled substrates ([2-14C]pyruvate, l-[U-14C]glutamine, l-[U-14C]alanine, or [3H]acetate) for 4 h. Total lipids were extracted with chloroform-methanol (2:1) via the method of Folch et al. (15), and radioactivity was measured by liquid scintillation counting. For pyruvate, glutamine, and alanine incorporation, 0.2 μCi/ml (0.3 μCi/ml for [3H]acetate) radioactivity was used in serum-free DMEM containing 2.5 mM glucose, 2 mM glutamine (or 0.5 mM cold glutamine for glutamine-labeling experiments), 0.25 mM pyruvate, and 0.1 mM l-alanine. All counts were normalized to total protein as determined by BCA assay. For pharmacological inhibition of the MPC, cells were preincubated with 1 μM UK-5099 (Santa Cruz Biotechnology) or 0.2% (vol/vol) dimethyl sulfoxide (DMSO) vehicle for 4 h, and 1 μM UK-5099 or DMSO was included in the labeling media.
Stable-isotope labeling and LC–MS-MS analysis.
Control and Mpc1D/D primary MEFs were labeled with 2.5 mM [2-13C]pyruvate (Cambridge Isotope Laboratories) in DMEM containing 2.5 mM glucose, 2 mM glutamine, and 0.1 mM alanine for 30 min. Cell extracts were collected in ice-cold high-performance liquid chromatography (HPLC) grade methanol-water (80:20) with rapid quenching in liquid nitrogen. The cellular debris was pelleted by centrifugation, and the supernatant was dried by vacuum centrifugation prior to resuspension in 50% acetonitrile and analysis by liquid chromatography-tandem mass spectrometry (LC–MS-MS). Targeted metabolic analyses were performed on an Agilent 6490 triple-quadropole LC–MS-MS system with iFunnel and Jet-Stream technology (Agilent Technologies, Santa Clara, CA) and equipped with an Agilent 1260 infinity pump and autosampler. Chromatographic separation was performed on a Diamond Hydride column (150 mm by 2.1-mm [inside diameter {i.d.}]; 4-μm particle size; Microsolv, Eatontown, NJ). The LC parameters were as follows: autosampler temperature, 4°C; injection volume, 4 μl; column temperature, 35°C; and flow rate, 0.4 ml/min. The solvents and optimized gradient conditions for LC were as follows: solvent A, 50% methanol with 0.05% acetic acid; solvent B, 90% acetonitrile with 10 mM ammonium acetate, pH 7.0; elution gradient, 99.5% B (0 min), 50% B (12 to 14 min), 0% B (15 to 19 min); post-run time for equilibration, 5 min in 99.5% B. The MS-MS experiment was performed in positive/negative switching electrospray mode, as described previously (16). The optimized operating electrospray ionization (ESI) conditions were as follows: gas temperature, 230°C (nitrogen); gas flow, 15 liters/min; nebulizer pressure, 40 lb/in2; sheath gas temperature, 350°C; and sheath gas flow, 12 liters/min. Capillary voltages were optimized to 4,000 V in both modes with nozzle voltages of 2,000 V. All data processing was performed with the Mass Hunter Quantitative Analysis software package.
Steady-state metabolite analysis.
To reliably determine the concentration of short-lived metabolites in vivo, e17.5 embryos were rapidly frozen in liquid nitrogen in utero, and tissues were collected from frozen embryos for determination of tissue-specific metabolite concentrations by enzymatic methods or by unbiased metabolomics analysis, as we have done previously (17, 18). For metabolomics analysis on e17.5 brains and livers from homozygous knock-in (Mpc1KI/KI) embryos and wild-type (WT) littermate controls (n = 8 for each tissue), metabolite concentrations were expressed as fold change over WT, and Welch's two-sample t test was used to determine statistically significant differences between genotypes (P < 0.05). To quantify the total fatty acid content and the abundances of individual acyl species, fatty acids were measured at the Kennedy Krieger Diagnostic Laboratory, Baltimore, MD, by gas chromatography (GC)-MS as pentafluorobenzyl bromide esters, with abundance normalized to the protein content.
Steady-state lactate, ATP, glycogen, triglyceride, and cholesterol concentrations were determined from rapidly frozen embryonic tissue by enzymatic assay and were normalized to the protein concentration as measured by BCA assay. Lactate (Sigma), cholesterol (Wako), and triglyceride (Sigma) assays were performed according to the manufacturer's instructions. Steady-state ATP was determined by a luciferase-based assay (Enliten ATP assay; Promega). For glycogen measurements (19, 20), approximately 10 mg of rapidly frozen liver was homogenized on ice in 300 μl 2 M HCl, and another piece of tissue from the same liver was homogenized in 300 μl 2 M NaOH. The homogenates were boiled on a 100°C heat block for 5 min and cooled to room temperature before neutralization with an equal amount of NaOH or HCl. Samples were spun at 16,000 × g for 10 min at 4°C, and the supernatant was transferred to a new tube and used for glucose determination by hexokinase-coupled enzymatic assay (Sigma Glucose [HK] kit) according to the manufacturer's instructions. The glucose content of base-homogenized control samples was subtracted from that of the corresponding acid-hydrolyzed samples in order to determine the glycogen content relative to total protein, as determined by BCA assay.
Immunoblotting.
Tissue lysates for SDS-PAGE were prepared by homogenization of tissues in RIPA buffer (50 mM Tris-HCl, pH 7.4, 150 mM NaCl, 1 mM EDTA, 1% Triton X-100, 0.25% deoxycholate) with protease inhibitor cocktail (Roche), followed by pelleting of the insoluble debris at 13,000 × g for 15 min at 4°C. The protein concentrations of lysates were determined by BCA assay (Thermo Scientific), and 30 μg of lysate was separated by Tris-glycine SDS-PAGE (15% polyacrylamide) unless otherwise indicated. Proteins were transferred to polyvinylidene difluoride (PVDF) membranes (Immobilon), blocked in 5% nonfat milk–Tris-buffered saline with Tween 20 (TBST), and incubated with primary antibodies overnight. The primary antibodies used included affinity-purified rabbit polyclonal antibodies against mouse Mpc1 and Mpc2 (generated and validated by us); complex V alpha subunit (Atp5a) mouse monoclonal at 1:1,000 (Abcam; ab14748), aconitase 2 (Aco2) rabbit polyclonal at 1:1,000 (Cell Signaling; 6922), heat shock chaperone 70 (Hsc70) mouse monoclonal at 1:1,000 (Santa Cruz; sc-7298), MitoProfile total Oxphos mouse monoclonal antibody cocktail at 1:500 (Abcam; ab110413), phospho-mTOR (Ser2448) rabbit polyclonal at 1:1,000 (Cell Signaling; 5536), total mTOR rabbit polyclonal at 1:1,000 (Cell Signaling; 2983), phospho-AMPK (Thr172) rabbit polyclonal at 1:1,000 (Cell Signaling; 2535), and total AMPK rabbit polyclonal at 1:1,000 (Cell Signaling; 5831). Cy3-conjugated anti-mouse (Invitrogen) and Cy5-conjugated anti-rabbit (Invitrogen) secondary antibodies at 1:1,500 or horseradish peroxidase (HRP)-conjugated anti-mouse (GE Healthcare; NA931V) or anti-rabbit (GE Healthcare; NA934V) secondary antibodies at 1:2,000 were incubated with washed membranes, and proteins were visualized with Amersham Prime enhanced chemiluminescent substrate (GE Healthcare) or by epifluorescence on an Alpha Innotech MultiImage III instrument. Protein abundance was quantified using Alpha Innotech (Santa Clara, CA) FluorChem Q software and was normalized to Hsc70 expression.
Quantitative real-time PCR and mitochondrial DNA (mtDNA) content determination.
Total RNA was extracted using TRIzol reagent (Life Technologies) according to the manufacturer's recommendations and was further purified using the RNeasy Mini kit (Qiagen). RNA was quantified with a NanoDrop 1000 spectrophotometer (Thermo Scientific), and cDNA was synthesized using random primers and a MultiScribe high-capacity cDNA reverse-transcription kit (Applied Biosystems). RT-PCR was performed using 10 ng of template cDNA in a 20-μl reaction mixture using Bio-Rad SsoAdvanced SYBR green master mix with primers specific to the genes of interest (Table 1). All PCRs were carried out in a Bio-Rad CFX Connect thermocycler and were concluded with a melting-curve determination step. Expression data from mouse tissues were normalized to the average threshold cycle (CT) values for 4 reference genes (18S rRNA, Rpl22, β-actin, and GAPDH), and the data are expressed as 2−ΔΔCT and are shown relative to e17.5 or relative to the wild type, as appropriate.
TABLE 1.
Primer sequences
| PCR target | RefSeq identifier | Primer (5′→3′) |
|
|---|---|---|---|
| Forward | Reverse | ||
| 18S rRNA | NR_003278.3 | GCAATTATTCCCCATGAACG | GGCCTCACTAAACCATCCAA |
| Rpl22 | NM_009079.3 | AGCAGGTTTTGAAGTTCACCC | CAGCTTTCCCATTCACCTTGA |
| β-Actin | NM_007393.5 | GGCTGTATTCCCCTCCATCG | CCAGTTGGTAACAATGCCATGT |
| Gapdh | NM_001289726.1 | AGGTCGGTGTGAACGGATTTG | TGTAGACCATGTAGTTGAGGTCA |
| Mpc1 | NM_018819.4 | ATGTCCGGAGCAAGGACTTC | ACAGAGGGCGAAAGTCATCC |
| Mpc2 | NM_027430.2 | AATGGGGATTGGTGTGTGCT | TGACCAAATAAACCCTGTAGCCA |
| mt-Nd1 | NC_005089.1 | AATCGCCATAGCCTTCCTAACAT | GGCGTCTGCAAATGGTTGTAA |
| nuc-H19 | NC_000073.6 | GTACCCACCTGTCGTCC | GTCCACGAGACCAATGACTG |
| nuc-Chr12 | NC_000078.6 | GGGCTGACCTAAATGTGGCT | CTCCCTCGTTTTCAGACCCC |
| Pck1 | NM_011044.2 | GGAAGGACAAAGATGGCAAGTTC | AGGCGTTTTCCTTAGGGATGTAG |
| Pck2 | NM_028994.2 | ATGGCTGCTATGTACCTCCC | GCCACAAAGTCTCGAACTCC |
Genomic DNA (gDNA) was isolated from TRIzol extracts according to the manufacturer's recommendations, and 10 ng of template gDNA was used per 20-μl reaction mixture using Bio-Rad SsoAdvanced SYBR green master mix with primers specific to the mitochondrial Nd1 (NADH dehydrogenase subunit 1) and to two nuclear loci. Nd1 abundance was calculated by the 2−ΔΔCT method relative to the average CT value of the two nuclear reference genes, and the data are expressed as fold change relative to controls (means and standard errors of the mean [SEM]).
Mouse glucose metabolism qPCR arrays (Qiagen RT2 Profiler PCR arrays) were prepared with 10 ng template cDNA per 20-μl reaction mixture using Bio-Rad SsoAdvanced SYBR green master mix, according to the manufacturer's instructions. Gene expression was calculated relative to the provided reference genes using the 2−ΔΔCT method.
Transmission electron microscopy.
Livers were excised and fixed in 2% paraformaldehyde, 2% glutaraldehyde-PBS solution and further processed with osmium tetroxide. Ultrathin sections were cut and imaged on a Hitachi 7600 transmission electron microscope (TEM).
RESULTS
Tissue-specific developmental regulation of the mitochondrial pyruvate carrier.
The high dependence of the fetus on glucose metabolism and the tremendous increase in blood flow/oxygen delivery via the placenta converge at mitochondrial pyruvate metabolism. A period of robust mitochondrial biogenesis occurs during midgestation, coincident with the initiation of organogenesis, and persists through early postnatal life (8). Therefore, we characterized MPC expression across development by immunoblotting for mouse Mpc1 and Mpc2 in three metabolically distinct tissues (brain, heart, and liver) from late gestation (e17.5) through the first week of postnatal life (through postnatal day 7 [P7]) and into adulthood (8 weeks) (Fig. 1A). Atp5a, a component of ATP synthase (complex V) and a resident of the inner mitochondrial membrane, and Aco2, a mitochondrial matrix enzyme, were used as additional markers. In all three tissues, dramatic upregulation of the mitochondrial pyruvate carrier components, Mpc1 and Mpc2, was observed across development at the levels of both protein and transcript (Fig. 1B). We observed tissue-specific differences, however, in the timing of increased MPC abundance and subtle differences in the ratio of Mpc1 protein to Mpc2 protein across development (Fig. 2A). For example, in the liver, approximately equal Mpc1/Mpc2 ratios were seen across development. Mpc2 expression in brain was higher than Mpc1 early during development, and Mpc1 increased dramatically by P14. MPC expression in heart followed a different trend, where Mpc1 was expressed more constitutively across development while Mpc2 increased later, around P6 to P7. Interestingly, there were no differences detected in the ratio of Mpc1 to Mpc2 in adult cerebral cortex, heart, or liver (Fig. 2B). These data show tissue-specific regulation of the mitochondrial pyruvate carrier across development.
FIG 1.

The mitochondrial pyruvate carrier is developmentally regulated in a tissue-specific manner. (A) Western blot for Mpc1 and Mpc2 in mouse brain, heart, and liver across early postnatal development with Atp5a (mitochondrial inner membrane), Aco2 (mitochondrial matrix), and Hsc70 (cytosol), demonstrating that tissue-specific differences in MPC expression are specific to the MPC. Mpc2 is present in embryonic tissues, although not readily visualized on the same exposure as adult tissues (see Fig. 4). (B) Relative mRNA abundances of Mpc1 and Mpc2 in brain, heart, and liver across mouse development by qRT-PCR and mitochondrial DNA content as determined by qRT-PCR of the mitochondrial Nd1 gene relative to nuclear loci displayed as the fold change over e17.5 (mean ± SEM; n = 3 or 4 per age).
FIG 2.
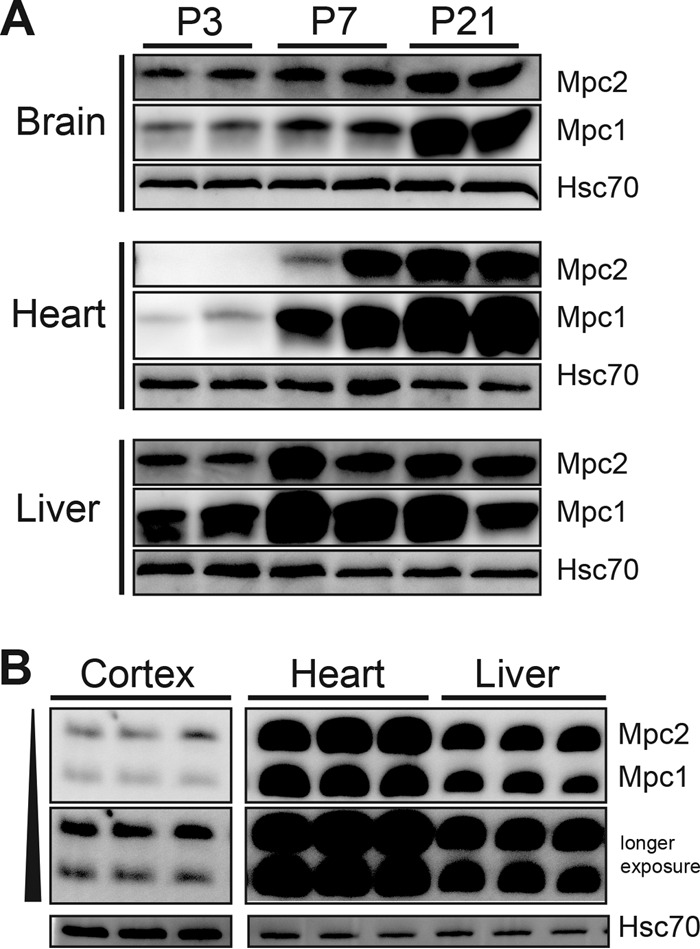
Tissue-specific developmental regulation of MPC components, Mpc1 and Mpc2. (A) Western blots of MPC expression in mouse brain, heart, and liver at three developmental time points (P, postnatal day). (B) Mpc1 and Mpc2 are expressed in equal ratios in adult mouse cerebral cortex, heart, and liver, as determined by immunoblotting. The adult cortex image is from the same blot at the same exposure. Hsc70 is shown as a loading control. No significant differences in the ratio of Mpc1 to Mpc2 were detected across adult tissues (n = 5).
Mpc1 is required for mammalian embryonic development and efficient pyruvate metabolism.
To define the metabolic requirement for mitochondrial pyruvate metabolism in vivo, we generated mice with a deletion allele of Mpc1 (Mpc1D). The last three exons (encoding 84/109 amino acids) of Mpc1 were flanked by loxP sites that were deleted by Cre-mediated recombination in the germ line to generate a line of mice carrying the Mpc1 deletion allele (see Fig. S1A in the supplemental material). We observed expected Mendelian ratios of inheritance of the Mpc1 deletion allele in late-gestation e17.5 embryos; however, Mpc1D/D e17.5 embryos were significantly developmentally delayed compared to WT and D/+ littermates and did not appear to be viable (Fig. 3A and B). These data are consistent with the deletion of other MPC components (21, 22).
FIG 3.

Developmental and metabolic requirements for mitochondrial pyruvate metabolism. (A) Photograph of WT and heterozygous and homozygous Mpc1 deletion late-gestation (e17.5) embryos. (B) Timed matings between Mpc1D/+ mice reveal expected Mendelian ratios. Shown is the body weight distribution of Mpc1D/D e17.5 embryos and D/+ and WT littermate controls (means ± standard deviations [SD]; n = 23 to 30). (C) Cell proliferation assay in primary Mpc1 WT and D/D (Mpc1 deletion) MEFs (means ± SD; n = 3; representative of the results of two independent experiments with cells derived from two embryos of each genotype). (D) Glucose uptake in primary Mpc1-deficient MEFs labeled with 0.5 μCi [1,2-3H]2-deoxy-glucose at a final concentration of 6.5 mM 2-deoxy-glucose for 5, 10, and 20 min (means ± SEM; n = 6). (E) Incorporation of radiolabeled substrates into the total lipid fraction in Mpc1D/D primary MEFs with WT and heterozygous (D/+) controls. The counts were normalized to protein and are displayed as means plus SEM (n = 3). Significant differences among group means were determined by the Tukey multiple-comparison test after one-way analysis of variance (ANOVA) and are indicated by asterisks relative to WT and D/+ controls (***, P < 0.001; **, 0.001 < P < 0.01). KI/KI, Mpc1 KI hypomorph.
Rapid cell division requires biosynthesis of nucleic acids, proteins, and lipids, and mitochondrial metabolism supports these anabolic processes (23–25). To determine the requirements for the mitochondrial pyruvate carrier in mitochondrial metabolism, we characterized the flux of radiolabeled substrates in MEFs null for Mpc1. Despite the embryonic lethality, primary Mpc1D/D MEFs were successfully isolated and cultured. Mpc1D/D MEFs did not exhibit altered growth rates under standard culture conditions (Fig. 3C). As expected for a block in mitochondrial pyruvate metabolism and an increased glycolytic demand, Mpc1D/D MEFs exhibited increased glucose uptake, analogous to the Pasteur effect, which describes the inhibitory effects of glucose oxidation on glycolysis (Fig. 3D). With few exceptions, in order for the carbons of glucose, pyruvate, or glutamine to effectively contribute to de novo fatty acid synthesis, these substrates must first be metabolized in mitochondria. To determine the mitochondrial flux of pyruvate and glutamine in Mpc1D/D MEFs, we measured the rate of 14C-labeled substrate incorporation into the total lipid fraction. The pyruvate contribution to the total lipid fraction was dramatically reduced in Mpc1D/D MEFs, as expected (Fig. 3E). Glutamine incorporation was unchanged in Mpc1D/D MEFs relative to controls (Fig. 3E), suggesting that glutamine anaplerosis did not compensate for the loss of mitochondrial pyruvate metabolism in these nontransformed cells. [3H]acetate incorporation into lipid was included as a control (Fig. 3E) to demonstrate that these cells have equal capacity for de novo fatty acid synthesis from a substrate that does not require mitochondrial metabolism to provide cytosolic acetyl-CoA. These metabolic adaptations demonstrate the plasticity of cellular metabolism to maintain cellular proliferation in cultured cells where substrates are not limiting.
Mpc1 hypomorphic allelic series reveal requirements for mitochondrial pyruvate metabolism in embryonic development.
The floxed Mpc1 gene used to generate the deletion allele was designed to have higher utility by the introduction of a reporter in the 3′ untranslated region of Mpc1 (see Fig. S1A in the supplemental material). Unexpectedly, inclusion of this reporter resulted in a hypomorphic allele, such that steady-state levels of Mpc1 transcript and protein were dramatically reduced in heterozygous knock-in (KI/+) animals and below the level of detection by immunoblotting in homozygous knock-in (KI/KI) animals (e.g., >30-fold suppression in heart) (Fig. 4A and B). We did not observe a loss of Mpc2 mRNA (Fig. 4B), but Mpc2 protein was not present in the absence of Mpc1 protein (Fig. 4A). Inclusion of the reporter directly following the stop codon resulted in allele-specific suppression of transcript abundance. To assess the degree to which Mpc1KI/KI functionally suppresses pyruvate metabolism, we derived Mpc1KI/KI primary MEFs and measured the contribution of radiolabeled pyruvate to de novo lipid synthesis. Mpc1KI/KI MEFs had reduced incorporation of radiolabeled pyruvate into lipids, but not to the same degree as Mpc1D/D MEFs (Fig. 4C). Treatment of WT and Mpc1KI/KI MEFs with 1 μM UK-5099, a pharmacological inhibitor of the MPC, reduced pyruvate incorporation into the total lipid fraction to the same level of suppression observed in Mpc1D/D MEFs (Fig. 4C). Consistent with an intermediate pyruvate transport capacity in Mpc1KI/KI MEFs, these cells also exhibited an intermediate glucose uptake phenotype, more than the WT but less than D/D (Fig. 3D). Although the mitochondrial pyruvate carrier could not be detected by immunoblotting, Mpc1KI/KI mice survived through gestation and died in the early perinatal period (Fig. 4D). Consistent with the substantive anabolic role of glucose in mammalian development, late-gestation Mpc1KI/KI homozygotes were 22% smaller than littermate controls (Fig. 4E). These data demonstrate that the Mpc1 knock-in allele is hypomorphic and significantly reduces, but does not ablate, mitochondrial pyruvate flux. Additionally, a very small fraction of Mpc1 is sufficient for embryonic development but not perinatal survival.
FIG 4.

Mpc1 hypomorphic allele reveals a requirement for mitochondrial pyruvate metabolism in mammalian embryonic development. (A and B) Western blotting (A) and qRT-PCR (B) for Mpc1 and Mpc2 in tissues from e17.5 embryos carrying 0, 1, or 2 copies of the Mpc1 hypomorphic KI allele. Hsc70 is shown as a loading control. The RT-PCR data were normalized to the average of four reference genes as described in Materials and Methods and are presented as means plus SEM relative to the WT (n = 7 or 8 per genotype). (C) [2-14C]pyruvate incorporation into the total lipid fraction in Mpc1-deficient primary MEFs in the presence of the MPC inhibitor UK-5099 or vehicle (DMSO) (means plus SEM; n = 5). (D) Matings between mice heterozygous for the Mpc1 KI allele do not yield expected Mendelian ratios of offspring at weaning at P21; however, the expected Mendelian ratios were observed in late-gestation litters (embryonic day 17.5). (E) Body weights (means ± SD) of e17.5 embryos from KI/+ intercrosses (n = 17 to 34 from 8 litters). (F) Steady-state lactate concentrations in Mpc1KI/KI e17.5 liver and brain as determined by enzymatic assay (means plus SEM; n = 6). (G) Steady-state ATP concentrations in liver and brain of Mpc1KI/KI e17.5 embryos and littermate controls (means plus SEM; n = 5). Significant differences among group means determined by Tukey multiple-comparison test after one-way ANOVA relative to WT and D/+ controls are indicated by asterisks (***, P < 0.001).
Mutations in human MPC1 cause devastating multisystem metabolic deficits characterized by hyperpyruvatemia and hyperlactacidemia, resulting in neurological defects and death early in childhood (26). Indeed, we observed an accumulation of lactate in the brains of Mpc1KI/KI e17.5 embryos, with only slight elevations in the liver (Fig. 4F). Fetal liver has a high degree of accessibility to the maternal circulation, and as such, lactate levels may be more efficiently cleared from this tissue in Mpc1KI/KI late-gestation embryos. Neither Mpc1KI/KI brain nor liver demonstrated a suppression of the ATP concentration (Fig. 4G). Consistent with these data, we did not find alterations in canonical energy-sensing pathways in Mpc1KI/KI embryos (Fig. 5A). The lactate accumulation and perinatal lethality observed in the Mpc1 hypomorphic mouse model closely resemble human inborn errors in MPC1, and this model permits the study of metabolic compensation and pathologies associated with MPC deficiency.
FIG 5.
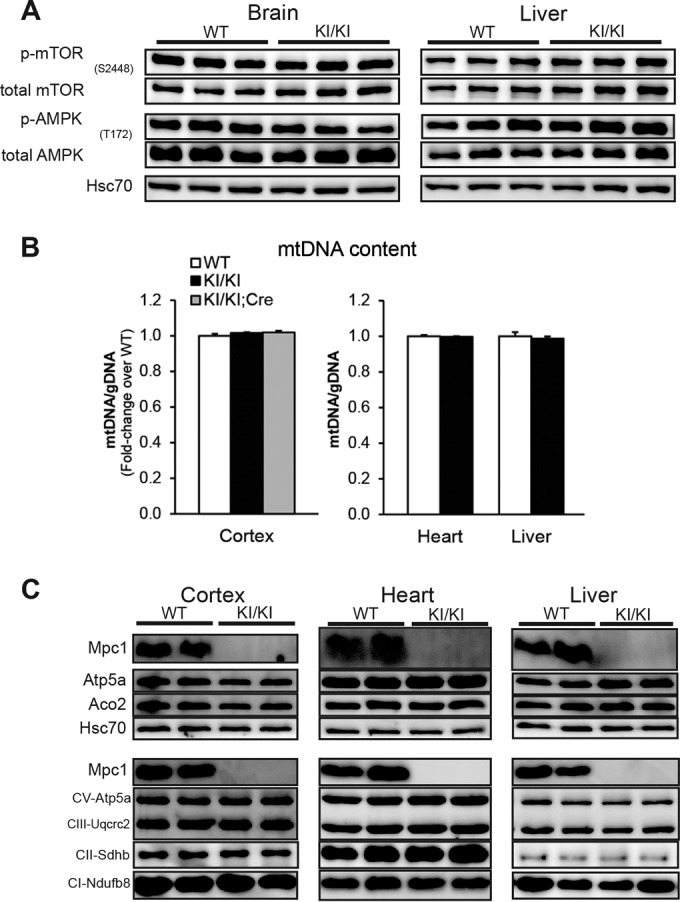
Normal mitochondrial abundance and energy-sensing signaling in tissues from Mpc1 KI hypomorph embryos. (A) Representative immunoblot for phosphorylation (p-AMPK and p-mTOR) of canonical energy-sensing components of AMPK and mTOR signaling pathways. (B) There was no difference in mitochondrial DNA content as determined by qRT-PCR with primers specific to the mitochondrial Nd1 gene relative to nuclear loci on Chr7 and Chr12 (means plus SEM; n = 7 or 8). (C) Representative immunoblot for mitochondrial proteins in WT and Mpc1KI/KI cerebral cortex, heart, and liver, with Hsc70 as a loading control. CV, complex V; CIII, complex III; CII, complex II; CI, complex I.
Next, we wanted to understand if the loss of such a critical component of mitochondrial metabolism affected other mitochondrial components. We did not observe differences in mitochondrial DNA content in Mpc1KI/KI cerebral cortex, heart, or liver compared to controls (Fig. 5B). Additionally, there were no differences in mitochondrial protein abundance in Mpc1-deficient tissues (Fig. 5C). These data suggest that canonical mitochondrial structural components remain largely intact upon MPC deficiency.
Interestingly, we observed that the severity of suppression of Mpc1 transcript abundance in Mpc1KI/KI mice varied in a tissue-specific manner, such that the Mpc1 transcript was most severely decreased in the liver (11% remaining) while more Mpc1 steady-state transcript remained in the brain (25% remaining) (Fig. 6A). To gain perspective on the amount of Mpc1 transcript remaining in the KI brain, we crossed Mpc1KI/+ mice to nestin-Cre transgenic mice (17, 27) to produce mice with tissue-specific deletion of Mpc1 in the developing nervous system. Overt phenotypes of nestin-Mpc1 KO late-gestation embryos, such as e17.5 body weight and perinatal survival, were not different from those of homozygous Mpc1 KI littermate embryos (Fig. 6B); however, Mpc1 transcript abundance was further reduced in nestin-Mpc1 KO cortex (<4% of WT) compared to Mpc1KI/KI cortex (Fig. 6A). Surprisingly, given the putative dependence of the nervous system on carbohydrate oxidation, the tissue-specific deletion of Mpc1 in the nervous system was compatible with mammalian development.
FIG 6.

Mpc1 hypomorphic allelic series reveals a threshold requirement for mitochondrial pyruvate metabolism during development. (A) Mpc1 transcript abundance in cerebral cortex, heart, and liver of e17.5 embryos across an allelic series of Mpc1-deficient genetic models (means plus SEM; n = 8). (B) Nestin-Cre-mediated deletion of Mpc1 in the embryonic nervous system does not affect e17.5 body weight (means ± SD; n = 10 to 24 from 11 litters) and conforms to expected Mendelian ratios (χ2 = 2.44; P = 0.786). (C) Matings between Mpc1D/+ females and Mpc1KI/+ males yield expected Mendelian ratios in e17.5 litters (χ2 = 2.18; P = 0.535), and D/KI offspring are viable, although significantly smaller than littermate controls (see Fig. S1B in the supplemental material). (D) Immunoblotting for inner mitochondrial membrane proteins in e17.5 cerebral cortex across an Mpc1 hypomorphic allelic series, with Aco2 of the mitochondrial matrix for comparison and cytosolic Hsc70 as a loading control. ***, P < 0.001 by the Tukey multiple-comparison test after one-way ANOVA.
In order to further define the role of Mpc1 in embryonic development, we expanded the Mpc1 allelic series by crossing Mpc1KI/+ and Mpc1D/+ mice to generate Mpc1D/KI mice (Fig. 6C). In the livers and hearts of Mpc1KI/KI embryos, <12% of WT levels of Mpc1 expression remained. Due to the codominant expression of the Mpc1 gene, the deletion of Mpc1 in the context of the hypomorphic Mpc1KI allele (D/KI) further sensitized Mpc1 expression and suppressed Mpc1 abundance by approximately half. This left only 7% expression of Mpc1 in heart and liver and 15% in brain (Fig. 6A). Lowering Mpc1 expression to this degree did not further perturb embryonic development in regard to e17.5 body weight or viability (Fig. 4C; see Fig. S1B in the supplemental material). Additionally, further suppression of Mpc1 expression in D/KI embryos and tissue-specific deletion of Mpc1 in the nervous system did not affect the mitochondrial DNA content (Fig. 5B) or the abundance of mitochondrial proteins (Fig. 6D). These data further support the observation that a very small amount of pyruvate transport in mitochondria by the MPC is sufficient to enable embryonic development and does not grossly alter mitochondrial composition.
Mitochondrial pyruvate carrier deficiency alters central carbon metabolism in a tissue-specific manner in vivo.
Pyruvate-mediated anaplerosis is particularly relevant to mammalian pregnancy, which relies heavily on glucose as the main macronutrient. It is generally thought that circulating fatty acids are not readily oxidized by fetal tissue (28), although mice null for enzymes in the rate-setting step of mitochondrial β-oxidation of long-chain fatty acids (Cpt1a and Cpt1b) exhibit embryonic lethality before e10 (29, 30). The extent to which fatty acids and other lipids are able to cross the placenta and contribute to lipid accumulation in the fetus is also debated and varies from species to species (31, 32). Nevertheless, de novo fatty acid synthesis from glucose, due to its abundance and importance as a biosynthetic and bioenergetic substrate in utero, is a significant source of lipid synthesis in late-gestation embryos. Because we observed dramatic differences in de novo lipid synthesis from pyruvate in Mpc1KI/KI and Mpc1D/D MEFs (Fig. 4C), we hypothesized that Mpc1KI/KI embryos might also exhibit defects in fatty acid synthesis. Indeed, we observed decreased total fatty acid content by GC-MS (see Fig. S2 in the supplemental material) and dramatically lower triglyceride levels in Mpc1KI/KI livers, with a slight compensation via increased total cholesterol content (Fig. 7A to C). The glycogen content was not affected (Fig. 7D). Transmission electron microscopy of e17.5 Mpc1 KI livers revealed fewer and smaller lipid droplets than those of WT littermates (Fig. 7E). Consistent with mitochondrial protein and DNA content across tissues, there were no abnormalities in mitochondrial abundance, size, or morphology in fetal hepatocytes (Fig. 7E). Together, these results suggest that Mpc1 deficiency alters lipid metabolism in vivo and further underscore the notion that the MPC-dependent metabolic fate of pyruvate is an important regulatory node in central carbon metabolism.
FIG 7.

Alterations in energy balance and lipid metabolism in Mpc1-deficient embryonic liver. (A) Liver total fatty acid content determined by GC-MS (means plus SEM; n = 5). (B) Triglyceride levels in e17.5 liver determined enzymatically (means plus SEM; n = 6). (C) Liver total cholesterol levels (means plus SEM; n = 4). (D) e17.5 liver glycogen contents determined enzymatically after acid hydrolysis (means plus SEM; n = 5). *, P < 0.05; **, P < 0.02. (E) Transmission electron micrographs of WT and Mpc1 KI e17.5 livers. The insets show normal mitochondrial morphology (scale bars, 100 nm). LD, lipid droplet. (F) Pck1 and Pck2 mRNA abundances in e17.5 liver across an Mpc1 hypomorphic allelic series (means plus SEM; n = 8). Significant differences as determined by Tukey post hoc tests (P < 0.05) after one-way ANOVA are indicated by different letters.
Given the central role of mitochondrial pyruvate flux in carbohydrate metabolism, we profiled genes of glucose metabolism by qRT-PCR arrays in WT and Mpc1KI/KI brain, heart, and liver (see Fig. S3 in the supplemental material). Although there were multiple small tissue-specific changes in several genes, the transcript for phosphoenolpyruvate carboxykinase (PEPCK), Pck, was consistently upregulated across tissues. Therefore, we again took advantage of the Mpc1 allelic series to understand the role of a graded defect in Mpc1 on Pck expression. Interestingly, in liver, the greater suppression of Mpc1 expression resulted in a concomitant increase in the expression of Pck1, which encodes cytosolic PEPCK (Fig. 7F). Pck2, which encodes mitochondrial PEPCK, also increased upon decreasing Mpc1 expression, but not to the same extent as Pck1 (Fig. 7F). These data are consistent with recent reports that glucose deprivation results in an increase in Pck expression (33, 34) which promotes metabolic flexibility when nutrients are limiting (35, 36). Also, these data show the utility of assessing a phenotype across a series of genetic perturbations.
To probe the global metabolic effects of loss of the mitochondrial pyruvate carrier in mammalian development, unbiased steady-state metabolomics analysis was conducted on the brains and livers of late-gestation Mpc1KI/KI and WT littermate embryos. To ensure stable steady-state measurements, the embryos were snap-frozen in liquid nitrogen in utero and subsequently genotyped and dissected frozen. In brain and liver, 416 and 541 total metabolites were identified, respectively, and of these, 155 and 157 were found to be significantly altered between Mpc1KI/KI embryos and WT controls (P < 0.05, as determined by Welch's two-sample t test). The entire list of differentially regulated metabolites is provided in Table S1 in the supplemental material. Of the metabolites differentially regulated in the Mpc1KI/KI brain, amino acid-related metabolites were overrepresented as a class, while lipids were enriched among differentially regulated metabolites in the liver (Fig. 8A). Furthermore, of the 86 metabolites differentially regulated in both liver and brain, 75 were changed in the same direction in Mpc1-deficient brain as in liver, highlighting that the consequences of impaired mitochondrial pyruvate metabolism are highly conserved in the embryonic brain and liver. For example, lactate and pyruvate were both dramatically upregulated in Mpc1 KI brain and liver, with greater accumulation of these metabolites in the brain than in the liver (Fig. 8B), consistent with the enzymatic measurement of lactate shown in Fig. 4F. Steady-state concentrations of TCA cycle intermediates were down in both Mpc1 KI tissues, and glucose levels were down in Mpc1 KI liver. These observations, together with the metabolic flux data shown above, provide evidence for enhanced glycolysis upon impaired mitochondrial pyruvate metabolism.
FIG 8.

Steady-state metabolite concentrations reveal effects of MPC deficiency and compensatory metabolic adaptations. (A) Distribution of total metabolites identified by unbiased metabolomics across molecular classes compared to the distribution of significantly regulated metabolites in e17.5 brain and liver. (B) Metabolites detected in both brain and liver that were significantly regulated by Mpc1 deficiency. The values shown are fold changes relative to the WT, and red and green indicate significant up- and downregulation, respectively (P < 0.05 by Welch's two-sample t test; n = 8). Shown are select metabolites directly related to pyruvate metabolism, TCA cycle intermediates, select amino acids, and select lipid metabolites. An additional list of significantly regulated metabolites is provided in Table S1 in the supplemental material. IMM, inner mitochondrial membrane; OMM, outer mitochondrial membrane; cit, citrulline; ASA, argininosuccinic acid. (C) Steady-state concentrations of alanine (ala), glutamate (glu), and aspartate (asp) in Mpc1D/D primary MEFs relative to WT MEFs. (D) [2-13C]pyruvate flux. m + 1-labeled metabolites over total metabolite abundance, determined by LC-MS, are shown relative to the WT (means plus SEM; n = 4). *, 0.01<P < 0.05; **, P < 0.01; pairwise comparison to the WT after one-way ANOVA. α-kg, α-ketoglutarate.
Amino acids provide anaplerotic compensation upon impaired mitochondrial pyruvate transport.
Several interesting changes were noted in amino acid metabolism in Mpc1KI/KI tissues. Broadly, amino acids that are catabolized to or synthesized from TCA cycle intermediates were downregulated, while those that can be derived from glycolytic intermediates were upregulated in both tissues (Fig. 8B). Hypotaurine, an amino acid derivative that may function as a neurotransmitter or an antioxidant in addition to its role in osmolyte balance (37, 38), was the most dramatically upregulated metabolite in the Mpc1KI/KI brain at more than 15 times the concentration in the WT brain (Fig. 8B). The high levels of hypotaurine are likely a consequence of and response to the hyperosmotic stress that lactate accumulation may cause (37).
Alanine was the most dramatically downregulated metabolite in the Mpc1KI/KI brain and was also found to be significantly downregulated in the liver (Fig. 8B). Glutamine was the second most downregulated metabolite in the Mpc1KI/KI brain, and glutamate was also decreased, suggesting that Mpc1 deficiency in the developing brain likely affects neurotransmitter synthesis, along with macronutrient metabolism (Fig. 8B). In agreement with the changes in steady-state amino acid concentrations observed in vivo, alanine and glutamate were also downregulated in primary Mpc1D/D MEFs (Fig. 8C). Aspartate was slightly increased in Mpc1D/D MEFs, which may be consistent with a role for cytosolic pyruvate in stimulating aspartate synthesis to enable proliferation in cells with mitochondrial deficiencies (39).
To better understand how impaired mitochondrial pyruvate transport contributed to alterations in amino acid concentrations, 13C tracer experiments were conducted on primary Mpc1D/D MEFs. When labeled with [2-13C]pyruvate, the abundance of m + 1 mass isotopomer fraction of TCA cycle intermediates in Mpc1-deficient cells was decreased, as expected (Fig. 8D). Additionally, labeling of amino acids that can be derived from the TCA cycle (glutamate and aspartate, for example) was reduced in Mpc1D/D MEFs relative to WT controls. Interestingly, m + 1 labeling of alanine from pyruvate was dramatically reduced, along with the decrease in steady-state alanine (Fig. 8D). Alanine can be interconverted with pyruvate in either the cytosol or the mitochondrial matrix by the alanine transaminase activity of GPT1 (cytosolic) or GPT2 (mitochondrial), as shown in Fig. 9A. The dramatic decrease in alanine labeling from pyruvate and the low steady-state alanine levels in Mpc1-deficient cells and tissues provide evidence that mitochondrial pyruvate is a significant source of cellular alanine. Indeed, in WT MEFs, 60% of the total alanine was m + 1 labeled from [2-13C]pyruvate, while this was decreased to just 6% in Mpc1D/D MEFs. To further test whether low steady-state alanine concentrations were the result of increased alanine flux or decreased alanine synthesis, we measured the mitochondrial flux of alanine by labeling Mpc1KI/KI and Mpc1D/D MEFs with l-[U-14C]alanine and measuring incorporation into the total lipid fraction, as we did previously for pyruvate and glutamine. Alanine incorporation was upregulated greater than 7-fold in a graded manner in Mpc1KI/KI and Mpc1D/D MEFs (Fig. 9B), indicative of higher mitochondrial flux of alanine. We also observed that HEK293T cells treated with UK-5099 exhibited dose-dependent suppression of [2-14C]pyruvate incorporation into lipids (see Fig. S4 in the supplemental material) and recapitulated the increase in mitochondrial alanine flux that we observed in primary MEFs, also in a dose-dependent manner (Fig. 9C). UK-5099 also stimulated an increase of mitochondrial glutamine flux in a dose-dependent manner in HEK293T cells (Fig. 9D), although glutamine did not contribute significantly to anaplerosis in nontransformed Mpc1D/D MEFs (Fig. 3E). These data show that alanine represents a major compensatory substrate in mitochondrial pyruvate carrier deficiency.
FIG 9.

Mitochondrial amino acid utilization increases upon impaired mitochondrial pyruvate transport. (A) Alanine and pyruvate can be interconverted in either the cytosol or the mitochondrial matrix by the transaminase activity of GPT1 (cytosolic) or GPT2 (mitochondrial). Both transaminases utilize glutamate or α-ketoglutarate as a cosubstrate for the interconversion of pyruvate and alanine. While pyruvate enters the mitochondrial matrix via the MPC, alanine likely traverses the inner mitochondrial membrane via a member of the solute carrier family 25 of inner membrane transporters. (B) [U-14C]alanine incorporation into the total lipid fraction is dramatically upregulated in Mpc1D/D MEFs (means plus SEM; n = 3). (C and D) In HEK293T cells, pharmacological inhibition of the MPC with UK-5099 robustly impairs mitochondrial pyruvate metabolism (see Fig. S4 in the supplemental material) while simultaneously stimulating mitochondrial flux of alanine (C) and glutamine (D) in a dose-dependent manner, as determined by incorporation of radiolabeled substrates into the total lipid fraction. (E) To determine the relative contributions of GPT1 and GPT2 to this phenomenon, HEK293T cells lacking GPT1, GPT2, or both (pan-GPT) were derived by CRISPR/Cas9 genome editing. The increase in mitochondrial flux of alanine is independent of cytosolic GPT1, and mitochondrial GPT2 alone is necessary and sufficient for the increase in alanine flux that accompanies impaired mitochondrial pyruvate transport (means plus SEM; n = 6). (F) Glutamine incorporation into lipid in GPT-deficient HEK293T cells in the presence or absence of UK-5099. Significant differences among group means are represented by letters and were determined by the Tukey multiple-comparison test (P < 0.05) after one-way ANOVA. In panels E and F, italicized letters are used for comparison of vehicle-treated cells, boldface letters are used for UK-5099-treated cells, and the asterisks indicate significant up- or downregulation of flux in response to UK-5099 treatment.
We next sought to use the HEK293T system as a model to determine the relative contributions of the cytosolic (GPT1) and mitochondrial (GPT2) alanine transaminases to the observed increase in alanine flux upon impaired mitochondrial pyruvate transport. To this end, we used CRISPR/Cas9-mediated genome editing to induce loss-of-function mutations in GPT1, GPT2, and both GPT1 and GPT2 (pan-GPT) in HEK293T cells (14). Mutant clonal cell lines were screened by genomic PCR and functional assays (see Fig. S4 in the supplemental material). Control cells (which were derived from expression of Cas9 with no gRNA), GPT1 KO, GPT2 KO, and pan-GPT KO HEK293T cells were subjected to a l-[U-14C]alanine-to-lipid incorporation assay in the presence or absence of UK-5099. In addition, pan-KO cells were transiently transfected with hGPT1 or hGPT2 expression vectors and subjected to the same alanine flux assay in the presence or absence of UK-5099. Loss of GPT2 completely abrogated the UK-5099-stimulated increase in mitochondrial flux of alanine (Fig. 9E). GPT1 was found to be dispensable for this phenomenon, suggesting that GPT1 does not promote increased alanine flux by converting pyruvate into alanine upon MPC inhibition. Indeed, overexpression of GPT1 in the pan-GPT-null background significantly reduced alanine incorporation into lipid upon UK-5099 treatment, suggesting that the equilibrium for GPT1 lies in favor of converting alanine to pyruvate within these cells (Fig. 9E). In further support of this, overexpression of GPT1 in the pan-GPT-null background significantly increased glutamine incorporation into lipid upon UK-5099 treatment (Fig. 9F). These data show that GPT2 is necessary and sufficient for increased mitochondrial flux of alanine in the absence of mitochondrial pyruvate transport. Additionally, these data suggest that the increased utilization of alanine is largely from exogenous alanine, not alanine that is derived from cytosolic pyruvate by GPT1. In this way, GPT2 might be acting to use exogenous alanine as a source for mitochondrial pyruvate rather than working in concert with GPT1 to bring carbon from pyruvate into the mitochondrion via alanine.
DISCUSSION
The placenta segregates maternal and fetal circulation while enabling selective nutrient uptake and waste excretion between fetus and mother. The fetus is a substantial oxygen consumer and preferentially transports and utilizes glucose as its main macronutrient (reviewed in reference 4). Fetal glucose and oxygen consumption converge at the transport of pyruvate into mitochondria; therefore, we targeted Mpc1, an essential component of the mitochondrial pyruvate carrier, to determine the requirements for mitochondrial pyruvate metabolism during fetal development. Due to the severe metabolic and developmental derangements observed in patients with mutations in enzymes that participate in mitochondrial pyruvate metabolism (26, 40–44) and the embryonic lethality of mouse models with null mutations in these enzymes (21, 45), we were surprised that such a small fraction of mitochondrial pyruvate metabolism was sufficient for in utero development. MPC deficiency was well tolerated in egg-laying Drosophila under standard laboratory conditions; however, these mutations were lethal when carbohydrate (sucrose) was provided as the main macronutrient (12). Mammalian pregnancy is also a carbohydrate-dominated environment; however, mammals seem to be capable of more metabolic plasticity than previously envisioned. Maternal glucose utilization is spared to provide the fetus with adequate glucose to sustain its biosynthetic and bioenergetic needs. The inability to properly communicate and regulate glucose availability can result in adverse consequences for maternal health (e.g., gestational diabetes) and fetal well-being (e.g., fetal growth). It will be interesting to further delineate the contributions and convergence of maternal nutrition and fetal metabolism in pregnancy-specific pathologies and the long-term health of the offspring.
To define the metabolic requirement for mitochondrial pyruvate metabolism during mammalian embryonic development, we generated mice with a null deletion of Mpc1. While knockout mice provide an excellent model for assigning the physiological requirement for genes involved in metabolism, we sought to determine the effect of a graded suppression of MPC in vivo by generating a hypomorphic allelic series. We devised a series of genetic perturbations, including the null allele, a less-severe hypomorphic allele, and tissue-specific loss of Mpc1 in the developing nervous system to enable a more detailed definition of gene-phenotype relationships. Indeed, we have shown that the transcriptional regulation of some genes (e.g., Pck1) is directly related to the degree of Mpc1 suppression in a tissue-specific manner in vivo (Fig. 7F). Further characterization of an allelic series may identify phenotypes that are regulated by particular metabolites in a graded fashion or by impaired metabolism in a particular tissue (46, 47). Our approach highlights the utility of genetic approaches to dissect metabolic requirements and compensatory mechanisms in vivo.
Human inborn errors in MPC1 are compatible with development to term but in the absence of maternal metabolite exchange result in severe adverse consequences in the perinatal period, including lactic acidosis (26). Organic acidosis can be acutely life threatening by lowering the oxygen-carrying capacity of hemoglobin (48). In agreement with Mpc1KI/KI embryos being in a state of metabolic acidosis, we observed a 15-fold-higher hypotaurine concentration in Mpc1KI/KI brains, a likely adaptation to the hyperosmotic stress that lactate accumulation may cause (37). Additionally, we observed 3-fold-higher heme levels in the Mpc1KI/KI liver, along with elevated biliverdin (Fig. 8B). The fetal liver is the principal site of erythropoiesis during mid- to late gestation in mouse embryonic development (49), and the observed increase in heme likely represents a response to lactic acidosis and the impaired oxygen-carrying capacity of fetal hemoglobin. While the late-gestation fetus has adaptive mechanisms to survive acute hypoxia/acidosis during parturition (50), less is known about the fetal response to chronic acidosis. Mild acidosis has been shown to reprogram mitochondrial metabolism by increasing respiratory efficiency to preserve ATP production during cellular stress (51), and it is likely that similar adaptations occur in Mpc1-deficient tissues. Our finding that 75 of 86 metabolites significantly regulated in both brain and liver of Mpc1KI/KI embryos were regulated in the same direction suggests that the metabolic effects of MPC deficiency are largely conserved across tissues but that some responses are tissue specific. Among the metabolites oppositely regulated by Mpc1 deficiency in brain and liver were carnitine, an important molecule in fatty acid metabolism, and argininosuccinic acid, an intermediate in the urea cycle (Fig. 8B). The tissue-specific regulation of these molecules may reflect broader patterns of altered lipid and amino acid metabolism in Mpc1-deficient liver and brain, respectively.
High rates of metabolic flux are particularly important in rapidly dividing cells, such as cancer cells, and during development. Mitochondria are the principal sites of cellular energy production via the generation of ATP for all cellular compartments. Additionally, the TCA cycle provides substrates for anabolic processes in the cytosol, and as such, substrate partitioning between mitochondria and other subcellular locations is a fundamental way to regulate mitochondrial metabolic flux. While high rates of flux are necessary to maintain rapid growth and division, the requirement for mitochondrial oxidative metabolism and anaplerosis within the mitochondria is poorly defined. For example, it has long been observed that cancer cells rely heavily on glycolysis for ATP production (the Warburg effect), yet even highly glycolytic cells require mitochondrial metabolic flux to provide carbon and energy equivalents for nucleotide, protein, and lipid biosynthesis (23, 24, 52–54). Indeed, in mammalian cell culture and tumor xenograft models, chemical or enzymatic depletion of mitochondrial DNA results in impaired respiratory capacity and reduced proliferation (55–58).
Deletion of Mpc1 in primary nontransformed MEFs did not affect cellular proliferation and resulted in enhanced glucose uptake (Fig. 3), consistent with the Pasteur effect. Interestingly, nontransformed MEFs did not exhibit enhanced anaplerosis via glutamine (Fig. 3E), although transformed cells robustly utilized glutamine, and pharmacological inhibition of mitochondrial pyruvate transport further pushed this adaptation (Fig. 9D). Increased oxidative glutaminolysis and reductive carboxylation upon MPC inhibition were observed in transformed cell lines, although the relative contributions of these fates of glutamine were dependent on the cell line and growth conditions (59, 60). Glutamine anaplerosis supports cellular proliferation in transformed cells and inhibition of glutaminase- or glutamate dehydrogenase-sensitized cells to growth inhibition upon treatment with UK-5099 (60). Analogous to the differences in glutamine metabolism observed in primary and transformed cultured cells, glutamine seems to play a more significant anaplerotic role in the brain than in the fetal liver, as glutamine was the second most downregulated metabolite in the Mpc1KI/KI brain. Not surprisingly, there are tissue-specific differences in anaplerosis during normal development, as well. Liver-specific deletion of MPC components in mice led to defects in gluconeogenesis from pyruvate/lactate; however, both glutamine and alanine were found to compensate for and contribute to fasting gluconeogenesis in the MPC-deficient adult liver (61, 62). We found that alanine provides a robust anaplerotic substrate in several cellular models of MPC deficiency, as well as in vivo in embryonic brain and liver. It has been demonstrated that Mpc2-deficient mitochondria exhibit no alterations in alanine uptake (62), and decreased steady-state alanine concentrations have been observed in several MPC-deficient cell models and in vivo (59, 60, 62). The decrease in steady-state alanine has been interpreted as a result of most cellular alanine being derived from mitochondrial pyruvate, but we sought to test the flux of alanine itself. In addition to demonstrating increased mitochondrial flux of alanine into lipid in MPC deficiency, we have shown by deleting the cytoplasmic and mitochondrial alanine transaminases (GPT1 and GPT2) that alanine provides a direct source of mitochondrial pyruvate dependent upon the mitochondrial GPT2 while the cytoplasmic GPT1 is dispensable for this compensation (Fig. 9). This finding is consistent with knockdown of Gpt2 in mice with liver-specific deletion of Mpc2, which further decreased blood glucose during a pyruvate tolerance test (62). Interestingly, the expression of GPT2 and several other transaminases that use glutamate as a cosubstrate was found to be positively correlated with proliferative capacity in human tumors (63), and knockdown of GPT2 decreased glutamine-dependent growth in cancer cells with mutant Kras (64). Our data suggest that GPT1 may also support glutamine anaplerosis, especially under impaired mitochondrial pyruvate transport (Fig. 9F). The GPT1-catalyzed transamination reaction in these cells seems to favor the production of pyruvate and glutamate at the expense of alanine and α-ketoglutarate. Glutamate and α-ketoglutarate are well-characterized negative regulators of glutaminase (65) and glutamate dehydrogenase (66), respectively, and the regulation of glutaminolysis by allosteric regulation and product inhibition may depend on compartment-specific concentrations of these metabolites. The GPT1 reaction could relieve inhibition of glutamate dehydrogenase or elevate glutamate levels to promote glutamine anaplerosis; however, the flux of glutamate-utilizing transaminases and glutamate dehydrogenase is likely regulated at levels beyond substrate concentrations, as recently demonstrated (63). The metabolic plasticity demonstrated by MPC-deficient and GPT-deficient cells is evidence that mitochondria have multiple mechanisms to generate mitochondrial pyruvate and to provide anaplerotic carbon from alternative substrates when glucose is limiting.
Here, we have shown that, although the mammalian fetus consumes large quantities of glucose and oxygen, a surprisingly small quantity of the mitochondrial pyruvate carrier is sufficient for mammalian development. MPC-deficient cells utilize alternative anaplerotic metabolites to meet the high biosynthetic burden of highly replicative cells, and this compensation varies in a tissue-specific manner in vivo. Further defining the cellular and organismal requirements of macronutrient metabolism has important implications in broad areas of biology, including cancer, neurochemistry, obesity, and diabetes.
Supplementary Material
ACKNOWLEDGMENTS
We thank Ann Moser for assistance with fatty acid analysis and Mike Delannoy for help with electron microscopy studies.
C.E.B. and M.J.W. conducted the experiments and analyzed the results. L.Z. and T.H. conducted the stable-isotope-labeling analysis and analyzed the results. C.E.B. and M.J.W. wrote the paper with input and approval from all of us.
Footnotes
Supplemental material for this article may be found at http://dx.doi.org/10.1128/MCB.00166-16.
REFERENCES
- 1.Carter AM. 2012. Evolution of placental function in mammals: the molecular basis of gas and nutrient transfer, hormone secretion, and immune responses. Physiol Rev 92:1543–1576. doi: 10.1152/physrev.00040.2011. [DOI] [PubMed] [Google Scholar]
- 2.Sandovici I, Hoelle K, Angiolini E, Constancia M. 2012. Placental adaptations to the maternal-fetal environment: implications for fetal growth and developmental programming. Reprod Biomed Online 25:68–89. doi: 10.1016/j.rbmo.2012.03.017. [DOI] [PubMed] [Google Scholar]
- 3.Longo LD. 1983. Maternal blood volume and cardiac output during pregnancy: a hypothesis of endocrinologic control. Am J Physiol 245:R720–R729. [DOI] [PubMed] [Google Scholar]
- 4.Battaglia FC, Meschia G. 1978. Principal substrates of fetal metabolism. Physiol Rev 58:499–527. [DOI] [PubMed] [Google Scholar]
- 5.Lopaschuk GD, Spafford MA, Marsh DR. 1991. Glycolysis is predominant source of myocardial ATP production immediately after birth. Am J Physiol 261:H1698–H1705. [DOI] [PubMed] [Google Scholar]
- 6.Fisher DJ, Heymann MA, Rudolph AM. 1981. Myocardial consumption of oxygen and carbohydrates in newborn sheep. Pediatr Res 15:843–846. doi: 10.1203/00006450-198105000-00003. [DOI] [PubMed] [Google Scholar]
- 7.Cremer JE. 1982. Substrate utilization and brain development. J Cereb Blood Flow Metab 2:394–407. doi: 10.1038/jcbfm.1982.45. [DOI] [PubMed] [Google Scholar]
- 8.Baker C, Ebert S. 2013. Development of aerobic metabolism in utero: requirement for mitochondrial function during embryonic and fetal periods. OA Biotechnol 2:16. [Google Scholar]
- 9.Papa S, Francavilla A, Paradies G, Meduri B. 1971. The transport of pyruvate in rat liver mitochondria. FEBS Lett 12:285–288. doi: 10.1016/0014-5793(71)80200-4. [DOI] [PubMed] [Google Scholar]
- 10.Halestrap AP, Denton RM. 1974. Specific inhibition of pyruvate transport in rat liver mitochondria and human erythrocytes by alpha-cyano-4-hydroxycinnamate. Biochem J 138:313–316. doi: 10.1042/bj1380313. [DOI] [PMC free article] [PubMed] [Google Scholar]
- 11.Herzig S, Raemy E, Montessuit S, Veuthey JL, Zamboni N, Westermann B, Kunji ER, Martinou JC. 2012. Identification and functional expression of the mitochondrial pyruvate carrier. Science 337:93–96. doi: 10.1126/science.1218530. [DOI] [PubMed] [Google Scholar]
- 12.Bricker DK, Taylor EB, Schell JC, Orsak T, Boutron A, Chen YC, Cox JE, Cardon CM, Van Vranken JG, Dephoure N, Redin C, Boudina S, Gygi SP, Brivet M, Thummel CS, Rutter J. 2012. A mitochondrial pyruvate carrier required for pyruvate uptake in yeast, Drosophila, and humans. Science 337:96–100. doi: 10.1126/science.1218099. [DOI] [PMC free article] [PubMed] [Google Scholar]
- 13.Bender T, Pena G, Martinou JC. 2015. Regulation of mitochondrial pyruvate uptake by alternative pyruvate carrier complexes. EMBO J 34:911–924. doi: 10.15252/embj.201490197. [DOI] [PMC free article] [PubMed] [Google Scholar]
- 14.Mali P, Yang L, Esvelt KM, Aach J, Guell M, DiCarlo JE, Norville JE, Church GM. 2013. RNA-guided human genome engineering via Cas9. Science 339:823–826. doi: 10.1126/science.1232033. [DOI] [PMC free article] [PubMed] [Google Scholar]
- 15.Folch J, Lees M, Sloane Stanley GH. 1957. A simple method for the isolation and purification of total lipids from animal tissues. J Biol Chem 226:497–509. [PubMed] [Google Scholar]
- 16.Alves TC, Pongratz RL, Zhao X, Yarborough O, Sereda S, Shirihai O, Cline GW, Mason G, Kibbey RG. 2015. Integrated, step-wise, mass-isotopomeric flux analysis of the TCA cycle. Cell Metab 22:936–947. doi: 10.1016/j.cmet.2015.08.021. [DOI] [PMC free article] [PubMed] [Google Scholar]
- 17.Ellis JM, Wong GW, Wolfgang MJ. 2013. Acyl coenzyme A thioesterase 7 regulates neuronal fatty acid metabolism to prevent neurotoxicity. Mol Cell Biol 33:1869–1882. doi: 10.1128/MCB.01548-12. [DOI] [PMC free article] [PubMed] [Google Scholar]
- 18.Lee J, Wolfgang MJ. 2012. Metabolomic profiling reveals a role for CPT1c in neuronal oxidative metabolism. BMC Biochem 13:23. doi: 10.1186/1471-2091-13-23. [DOI] [PMC free article] [PubMed] [Google Scholar]
- 19.Passonneau JV, Lauderdale VR. 1974. A comparison of three methods of glycogen measurement in tissues. Anal Biochem 60:405–412. doi: 10.1016/0003-2697(74)90248-6. [DOI] [PubMed] [Google Scholar]
- 20.Zhang P. 2012. Analysis of mouse liver glycogen content. Bio Protoc 2:10. [Google Scholar]
- 21.Vigueira PA, McCommis KS, Schweitzer GG, Remedi MS, Chambers KT, Fu X, McDonald WG, Cole SL, Colca JR, Kletzien RF, Burgess SC, Finck BN. 2014. Mitochondrial pyruvate carrier 2 hypomorphism in mice leads to defects in glucose-stimulated insulin secretion. Cell Rep 7:2042–2053. doi: 10.1016/j.celrep.2014.05.017. [DOI] [PMC free article] [PubMed] [Google Scholar]
- 22.Vanderperre B, Bender T, Kunji ER, Martinou JC. 2015. Mitochondrial pyruvate import and its effects on homeostasis. Curr Opin Cell Biol 33:35–41. doi: 10.1016/j.ceb.2014.10.008. [DOI] [PubMed] [Google Scholar]
- 23.DeBerardinis RJ, Lum JJ, Hatzivassiliou G, Thompson CB. 2008. The biology of cancer: metabolic reprogramming fuels cell growth and proliferation. Cell Metab 7:11–20. doi: 10.1016/j.cmet.2007.10.002. [DOI] [PubMed] [Google Scholar]
- 24.Vander Heiden MG, Cantley LC, Thompson CB. 2009. Understanding the Warburg effect: the metabolic requirements of cell proliferation. Science 324:1029–1033. doi: 10.1126/science.1160809. [DOI] [PMC free article] [PubMed] [Google Scholar]
- 25.Ward PS, Thompson CB. 2012. Metabolic reprogramming: a cancer hallmark even Warburg did not anticipate. Cancer Cell 21:297–308. doi: 10.1016/j.ccr.2012.02.014. [DOI] [PMC free article] [PubMed] [Google Scholar]
- 26.Brivet M, Garcia-Cazorla A, Lyonnet S, Dumez Y, Nassogne MC, Slama A, Boutron A, Touati G, Legrand A, Saudubray JM. 2003. Impaired mitochondrial pyruvate importation in a patient and a fetus at risk. Mol Genet Metab 78:186–192. doi: 10.1016/S1096-7192(03)00016-7. [DOI] [PubMed] [Google Scholar]
- 27.Reamy AA, Wolfgang MJ. 2011. Carnitine palmitoyltransferase-1c gain-of-function in the brain results in postnatal microencephaly. J Neurochem 118:388–398. doi: 10.1111/j.1471-4159.2011.07312.x. [DOI] [PubMed] [Google Scholar]
- 28.Girard J, Duee PH, Ferre P, Pegorier JP, Escriva F, Decaux JF. 1985. Fatty acid oxidation and ketogenesis during development. Reprod Nutr Dev 25:303–319. doi: 10.1051/rnd:19850221. [DOI] [PubMed] [Google Scholar]
- 29.Nyman LR, Cox KB, Hoppel CL, Kerner J, Barnoski BL, Hamm DA, Tian L, Schoeb TR, Wood PA. 2005. Homozygous carnitine palmitoyltransferase 1a (liver isoform) deficiency is lethal in the mouse. Mol Genet Metab 86:179–187. doi: 10.1016/j.ymgme.2005.07.021. [DOI] [PubMed] [Google Scholar]
- 30.Ji S, You Y, Kerner J, Hoppel CL, Schoeb TR, Chick WS, Hamm DA, Sharer JD, Wood PA. 2008. Homozygous carnitine palmitoyltransferase 1b (muscle isoform) deficiency is lethal in the mouse. Mol Genet Metab 93:314–322. doi: 10.1016/j.ymgme.2007.10.006. [DOI] [PMC free article] [PubMed] [Google Scholar]
- 31.Herrera E, Amusquivar E. 2000. Lipid metabolism in the fetus and the newborn. Diabetes Metab Res Rev 16:202–210. [DOI] [PubMed] [Google Scholar]
- 32.Girard J, Ferre P, Pegorier JP, Duee PH. 1992. Adaptations of glucose and fatty acid metabolism during perinatal period and suckling-weaning transition. Physiol Rev 72:507–562. [DOI] [PubMed] [Google Scholar]
- 33.Vincent EE, Sergushichev A, Griss T, Gingras MC, Samborska B, Ntimbane T, Coelho PP, Blagih J, Raissi TC, Choiniere L, Bridon G, Loginicheva E, Flynn BR, Thomas EC, Tavare JM, Avizonis D, Pause A, Elder DJ, Artyomov MN, Jones RG. 2015. Mitochondrial phosphoenolpyruvate carboxykinase regulates metabolic adaptation and enables glucose-independent tumor growth. Mol Cell 60:195–207. doi: 10.1016/j.molcel.2015.08.013. [DOI] [PubMed] [Google Scholar]
- 34.Leithner K, Hrzenjak A, Trotzmuller M, Moustafa T, Kofeler HC, Wohlkoenig C, Stacher E, Lindenmann J, Harris AL, Olschewski A, Olschewski H. 2015. PCK2 activation mediates an adaptive response to glucose depletion in lung cancer. Oncogene 34:1044–1050. doi: 10.1038/onc.2014.47. [DOI] [PubMed] [Google Scholar]
- 35.Montal ED, Dewi R, Bhalla K, Ou L, Hwang BJ, Ropell AE, Gordon C, Liu WJ, DeBerardinis RJ, Sudderth J, Twaddel W, Boros LG, Shroyer KR, Duraisamy S, Drapkin R, Powers RS, Rohde JM, Boxer MB, Wong KK, Girnun GD. 2015. PEPCK coordinates the regulation of central carbon metabolism to promote cancer cell growth. Mol Cell 60:571–583. doi: 10.1016/j.molcel.2015.09.025. [DOI] [PMC free article] [PubMed] [Google Scholar]
- 36.Mendez-Lucas A, Hyrossova P, Novellasdemunt L, Vinals F, Perales JC. 2014. Mitochondrial phosphoenolpyruvate carboxykinase (PEPCK-M) is a pro-survival, endoplasmic reticulum (ER) stress response gene involved in tumor cell adaptation to nutrient availability. J Biol Chem 289:22090–22102. doi: 10.1074/jbc.M114.566927. [DOI] [PMC free article] [PubMed] [Google Scholar]
- 37.Vitvitsky V, Garg SK, Banerjee R. 2011. Taurine biosynthesis by neurons and astrocytes. J Biol Chem 286:32002–32010. doi: 10.1074/jbc.M111.253344. [DOI] [PMC free article] [PubMed] [Google Scholar]
- 38.Aruoma OI, Halliwell B, Hoey BM, Butler J. 1988. The antioxidant action of taurine, hypotaurine and their metabolic precursors. Biochem J 256:251–255. doi: 10.1042/bj2560251. [DOI] [PMC free article] [PubMed] [Google Scholar]
- 39.Birsoy K, Wang T, Chen WW, Freinkman E, Abu-Remaileh M, Sabatini DM. 2015. An essential role of the mitochondrial electron transport chain in cell proliferation is to enable aspartate synthesis. Cell 162:540–551. doi: 10.1016/j.cell.2015.07.016. [DOI] [PMC free article] [PubMed] [Google Scholar]
- 40.Celis K, Shuldiner S, Haverfield EV, Cappell J, Yang R, Gong DW, Chung WK. 2015. Loss of function mutation in glutamic pyruvate transaminase 2 (GPT2) causes developmental encephalopathy. J Inherit Metab Dis 38:941–948. doi: 10.1007/s10545-015-9824-x. [DOI] [PMC free article] [PubMed] [Google Scholar]
- 41.Maj MC, MacKay N, Levandovskiy V, Addis J, Baumgartner ER, Baumgartner MR, Robinson BH, Cameron JM. 2005. Pyruvate dehydrogenase phosphatase deficiency: identification of the first mutation in two brothers and restoration of activity by protein complementation. J Clin Endocrinol Metab 90:4101–4107. doi: 10.1210/jc.2005-0123. [DOI] [PubMed] [Google Scholar]
- 42.Cameron JM, Maj M, Levandovskiy V, Barnett CP, Blaser S, Mackay N, Raiman J, Feigenbaum A, Schulze A, Robinson BH. 2009. Pyruvate dehydrogenase phosphatase 1 (PDP1) null mutation produces a lethal infantile phenotype. Hum Genet 125:319–326. doi: 10.1007/s00439-009-0629-6. [DOI] [PubMed] [Google Scholar]
- 43.Marin-Valencia I, Roe CR, Pascual JM. 2010. Pyruvate carboxylase deficiency: mechanisms, mimics and anaplerosis. Mol Genet Metab 101:9–17. doi: 10.1016/j.ymgme.2010.05.004. [DOI] [PubMed] [Google Scholar]
- 44.Gray LR, Tompkins SC, Taylor EB. 2014. Regulation of pyruvate metabolism and human disease. Cell Mol Life Sci 71:2577–2604. doi: 10.1007/s00018-013-1539-2. [DOI] [PMC free article] [PubMed] [Google Scholar]
- 45.Johnson MT, Mahmood S, Hyatt SL, Yang HS, Soloway PD, Hanson RW, Patel MS. 2001. Inactivation of the murine pyruvate dehydrogenase (Pdha1) gene and its effect on early embryonic development. Mol Genet Metab 74:293–302. doi: 10.1006/mgme.2001.3249. [DOI] [PubMed] [Google Scholar]
- 46.Rodriguez S, Wolfgang MJ. 2012. Targeted chemical-genetic regulation of protein stability in vivo. Chem Biol 19:391–398. doi: 10.1016/j.chembiol.2011.12.022. [DOI] [PMC free article] [PubMed] [Google Scholar]
- 47.Rodriguez S, Ellis JM, Wolfgang MJ. 2014. Chemical-genetic induction of malonyl-CoA decarboxylase in skeletal muscle. BMC Biochem 15:20. doi: 10.1186/1471-2091-15-20. [DOI] [PMC free article] [PubMed] [Google Scholar]
- 48.Bellingham AJ, Detter JC, Lenfant C. 1971. Regulatory mechanisms of hemoglobin oxygen affinity in acidosis and alkalosis. J Clin Invest 50:700–706. doi: 10.1172/JCI106540. [DOI] [PMC free article] [PubMed] [Google Scholar]
- 49.Baron MH, Vacaru A, Nieves J. 2013. Erythroid development in the mammalian embryo. Blood Cells Mol Dis 51:213–219. doi: 10.1016/j.bcmd.2013.07.006. [DOI] [PMC free article] [PubMed] [Google Scholar]
- 50.Bobrow CS, Soothill PW. 1999. Causes and consequences of fetal acidosis. Arch Dis Child Fetal Neonatal Ed 80:F246–F249. doi: 10.1136/fn.80.3.F246. [DOI] [PMC free article] [PubMed] [Google Scholar]
- 51.Khacho M, Tarabay M, Patten D, Khacho P, MacLaurin JG, Guadagno J, Bergeron R, Cregan SP, Harper ME, Park DS, Slack RS. 2014. Acidosis overrides oxygen deprivation to maintain mitochondrial function and cell survival. Nat Commun 5:3550. doi: 10.1038/ncomms4550. [DOI] [PMC free article] [PubMed] [Google Scholar]
- 52.Warburg O. 1956. On the origin of cancer cells. Science 123:309–314. doi: 10.1126/science.123.3191.309. [DOI] [PubMed] [Google Scholar]
- 53.Lunt SY, Vander Heiden MG. 2011. Aerobic glycolysis: meeting the metabolic requirements of cell proliferation. Annu Rev Cell Dev Biol 27:441–464. doi: 10.1146/annurev-cellbio-092910-154237. [DOI] [PubMed] [Google Scholar]
- 54.Wallace DC. 2012. Mitochondria and cancer. Nat Rev Cancer 12:685–698. doi: 10.1038/nrc3365. [DOI] [PMC free article] [PubMed] [Google Scholar]
- 55.Lee WT, St John J. 2015. The control of mitochondrial DNA replication during development and tumorigenesis. Ann N Y Acad Sci 1350:95–106. doi: 10.1111/nyas.12873. [DOI] [PubMed] [Google Scholar]
- 56.Cavalli LR, Varella-Garcia M, Liang BC. 1997. Diminished tumorigenic phenotype after depletion of mitochondrial DNA. Cell Growth Differ 8:1189–1198. [PubMed] [Google Scholar]
- 57.Dickinson A, Yeung KY, Donoghue J, Baker MJ, Kelly RD, McKenzie M, Johns TG. 2013. The regulation of mitochondrial DNA copy number in glioblastoma cells. Cell Death Differ 20:1644–1653. doi: 10.1038/cdd.2013.115. [DOI] [PMC free article] [PubMed] [Google Scholar]
- 58.Schubert S, Heller S, Loffler B, Schafer I, Seibel M, Villani G, Seibel P. 2015. Generation of rho zero cells: visualization and quantification of the mtDNA depletion process. Int J Mol Sci 16:9850–9865. doi: 10.3390/ijms16059850. [DOI] [PMC free article] [PubMed] [Google Scholar]
- 59.Vacanti NM, Divakaruni AS, Green CR, Parker SJ, Henry RR, Ciaraldi TP, Murphy AN, Metallo CM. 2014. Regulation of substrate utilization by the mitochondrial pyruvate carrier. Mol Cell 56:425–435. doi: 10.1016/j.molcel.2014.09.024. [DOI] [PMC free article] [PubMed] [Google Scholar]
- 60.Yang C, Ko B, Hensley CT, Jiang L, Wasti AT, Kim J, Sudderth J, Calvaruso MA, Lumata L, Mitsche M, Rutter J, Merritt ME, DeBerardinis RJ. 2014. Glutamine oxidation maintains the TCA cycle and cell survival during impaired mitochondrial pyruvate transport. Mol Cell 56:414–424. doi: 10.1016/j.molcel.2014.09.025. [DOI] [PMC free article] [PubMed] [Google Scholar]
- 61.Gray LR, Sultana MR, Rauckhorst AJ, Oonthonpan L, Tompkins SC, Sharma A, Fu X, Miao R, Pewa AD, Brown KS, Lane EE, Dohlman A, Zepeda-Orozco D, Xie J, Rutter J, Norris AW, Cox JE, Burgess SC, Potthoff MJ, Taylor EB. 2015. Hepatic mitochondrial pyruvate carrier 1 is required for efficient regulation of gluconeogenesis and whole-body glucose homeostasis. Cell Metab 22:669–681. doi: 10.1016/j.cmet.2015.07.027. [DOI] [PMC free article] [PubMed] [Google Scholar]
- 62.McCommis KS, Chen Z, Fu X, McDonald WG, Colca JR, Kletzien RF, Burgess SC, Finck BN. 2015. Loss of mitochondrial pyruvate carrier 2 in the liver leads to defects in gluconeogenesis and compensation via pyruvate-alanine cycling. Cell Metab 22:682–694. doi: 10.1016/j.cmet.2015.07.028. [DOI] [PMC free article] [PubMed] [Google Scholar]
- 63.Coloff JL, Murphy JP, Braun CR, Harris IS, Shelton LM, Kami K, Gygi SP, Selfors LM, Brugge JS. 2016. Differential glutamate metabolism in proliferating and quiescent mammary epithelial cells. Cell Metab 23:867–880. doi: 10.1016/j.cmet.2016.03.016. [DOI] [PubMed] [Google Scholar]
- 64.Weinberg F, Hamanaka R, Wheaton WW, Weinberg S, Joseph J, Lopez M, Kalyanaraman B, Mutlu GM, Budinger GR, Chandel NS. 2010. Mitochondrial metabolism and ROS generation are essential for Kras-mediated tumorigenicity. Proc Natl Acad Sci U S A 107:8788–8793. doi: 10.1073/pnas.1003428107. [DOI] [PMC free article] [PubMed] [Google Scholar]
- 65.Krebs HA. 1935. Metabolism of amino-acids: the synthesis of glutamine from glutamic acid and ammonia, and the enzymic hydrolysis of glutamine in animal tissues. Biochem J 29:1951–1969. doi: 10.1042/bj0291951. [DOI] [PMC free article] [PubMed] [Google Scholar]
- 66.Fahien LA, MacDonald MJ. 2011. The complex mechanism of glutamate dehydrogenase in insulin secretion. Diabetes 60:2450–2454. doi: 10.2337/db10-1150. [DOI] [PMC free article] [PubMed] [Google Scholar]
Associated Data
This section collects any data citations, data availability statements, or supplementary materials included in this article.