Abstract
SWI/SNF (switching/sucrose nonfermenting)-dependent chromatin remodeling establishes coordinated gene expression programs during development, yet important functional details remain to be elucidated. We show that the Brg1 (Brahma-related gene 1; Smarca4) ATPase is globally expressed at high levels during postimplantation development and its conditional ablation, beginning at gastrulation, results in increased apoptosis, growth retardation, and, ultimately, embryonic death. Global gene expression analysis revealed that genes upregulated in Rosa26CreERT2; Brg1flox/flox embryos (here referred to as Brg1d/d embryos to describe embryos with deletion of the Brg1flox/flox alleles) negatively regulate cell cycle progression and cell growth. In addition, the p53 (Trp53) protein, which is virtually undetectable in early wild-type embryos, accumulated in the Brg1d/d embryos and activated the p53-dependent pathways. Using P19 cells, we show that Brg1 and CHD4 (chromodomain helicase DNA binding protein 4) coordinate to control target gene expression. Both proteins physically interact and show a substantial overlap of binding sites at chromatin-accessible regions adjacent to genes differentially expressed in the Brg1d/d embryos. Specifically, Brg1 deficiency results in reduced levels of the repressive histone H3 lysine K27 trimethylation (H3K27me3) histone mark and an increase in the amount of open chromatin at the regulatory region of the p53 and p21 (Cdkn1a) genes. These results provide insights into the mechanisms by which Brg1 functions, which is in part via the p53 program, to constrain gene expression and facilitate rapid embryonic growth.
INTRODUCTION
Embryonic cells divide very slowly, with little increase in cell mass prior to implantation. After implantation, as gastrulation initiates, a substantial increase in cell growth accompanied by a decrease in cell cycle length occurs (1). Concomitantly with the increase in cell mass, the embryo displays a significant level of apoptosis that is critical in the developmental process of the embryo (2). Imbalances in cellular proliferation and apoptosis lead to severe consequences for embryonic developmental processes. Many of the signaling pathways and molecular components that are essential for apoptosis in normal development and disease have been previously described (3). One of these components, the tumor suppressor protein p53, has been shown to regulate apoptosis in response to DNA damage caused by genotoxic stress (4). Numerous genes that are transactivated by p53 have also been shown to trigger cell cycle arrest, senescence, or apoptosis to prevent tumorigenesis (4–8). The transcriptional activation potential of p53 is partly regulated by the amount of p53 present in the cell as well as by posttranslational modifications of the p53 protein (9–12). In addition, certain chromatin remodeling factors interact with p53 and thereby modulate its transactivation activity (4, 12–15). However, the precise chromatin and epigenetic mechanisms and attendant molecular factors that regulate apoptosis during early embryogenesis remain less than fully defined.
In the mouse, genetic deletion of Brg1 (Brahma-related gene 1; Smarca4) results in peri-implantation lethality, whereas Brg1 heterozygotes show increases in susceptibility to tumors (16, 17). Recent studies have shown tissue-specific outcomes from ablation of Brg1flox/flox (Brg1fl/fl), using a Cre-loxP system (18). However, a global requirement for Brg1 during embryo development beyond the peri-implantation period has not been previously evaluated. As one approach, we conditionally inactivated Brg1 using a tamoxifen-inducible Cre recombinase (Rosa26CreERT2) system that ablates the Brg1flox/flox locus beginning at gastrulation. The results exposed a novel role for the Brg1 gene during perigastrulation development, a critical window of development just after implantation. We found that Brg1 deficiency manifested as increased apoptosis and growth retardation in the early embryo. Global molecular analysis revealed aberrant expression of numerous cell proliferation and apoptosis regulators, including components of the p53 pathway. Mechanistic analyses demonstrate that Brg1 physically interacts with CHD4 (chromodomain helicase DNA binding protein 4) and both proteins have overlapping occupancy within the regulatory regions of genes that are differentially expressed in Rosa26CreERT2; Brg1flox/flox embryos (here referred to as Brg1d/d embryos to describe embryos with deletion of the Brg1flox/flox alleles). In the case of the p21 gene, Brg1 deficiency resulted in attenuated levels of the repressive histone H3 trimethylated lysine K27 (H3K27me3) mark and a more open chromatin structure, showing that one of the physiological functions of Brg1 may be to limit apoptosis via regulation of p53 signaling rather than the normal developmental proliferative program.
MATERIALS AND METHODS
Rosa26CreERT2 mice globally express and efficiently excise the floxed gene in early development.
Toxicity testing of tamoxifen was performed using unmated mice and began with the intraperitoneal (i.p.) injection of a dose of 225 mg/kg of body weight. To distinguish potential Cre toxicity from possible tamoxifen toxicity and to establish a lowest observed adverse effect level (LOAEL) and no observed adverse effect level (NOAEL), unmated adult wild-type animals (without Cre) were dosed i.p. with 225, 150, and 100 mg/kg of body weight tamoxifen (dosing volume, 10 ml/kg). Animals received a total of two injections over two consecutive days. Body weights were collected prior to dosing and weekly for a total of 3 weeks (the length of time needed for a mother to raise a litter). Animals were observed daily for health effects. Mice receiving the 225- and 150-mg/kg dosed either were found dead or were euthanized when they were moribund. Mice tolerated the tamoxifen dose level of 100 mg/kg well for two consecutive days with no evidence of tamoxifen toxicity, as judged by weight gain or tissue morphology. Tamoxifen-induced toxicity was also assessed in embryos carrying Rosa26CreERT2, and no effect on the developmental phenotype was observed; therefore, tamoxifen toxicity in embryos was examined by injecting 100 mg/kg of body weight i.p. at embryonic day 6.5 (E6.5) and evaluating the embryos for gross morphological changes at E8.5 and E9.5. The 100-mg/kg dose of tamoxifen produced no obvious morphological changes. Thus, having determined the LOAEL to be 150 mg/kg and the NOAEL to be 100 mg/kg in this study, the tamoxifen dose of 100 mg/kg of body weight was selected to be the maximum dose for use in the study.
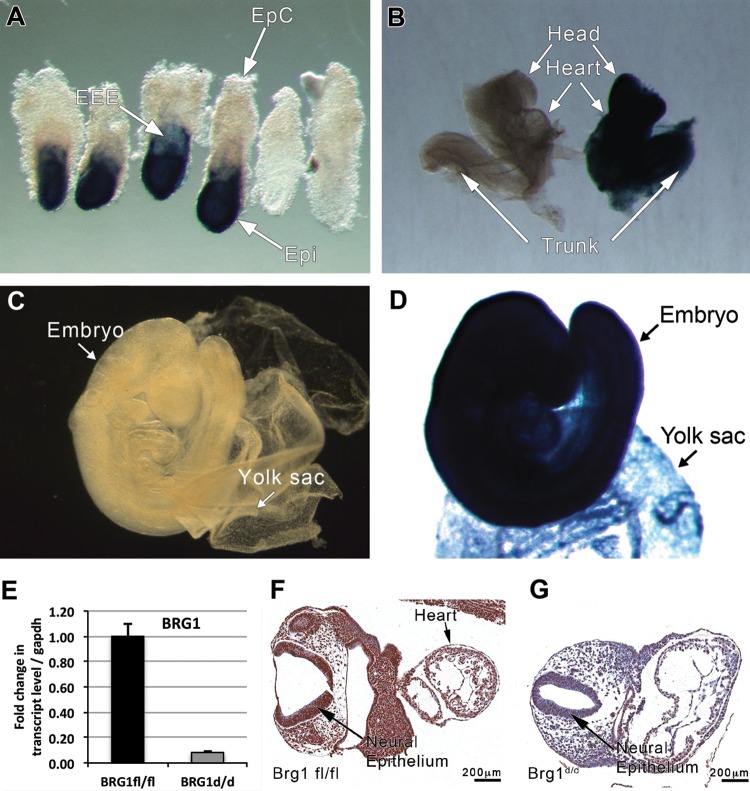
Following preliminary toxicity testing to confirm the Cre recombinase activity, we bred the Rosa26CreERT2 mice [B6.129-Gt(ROSA)26Sortm1(cre/ERT2)Tyj/J] with ROSA-stop reporter mice [B6.129S4-Gt(ROSA)26Sortm1Sor/J]. Pregnant females were dosed with 100 mg/kg tamoxifen on different embryonic days, and the fetuses were collected for measurement of β-galactosidase activity in the double-transgenic (Tg) embryos [B6.129S4-Gt(ROSA)26Sortm1Sor/J Tg B6.129-Gt(ROSA)26Sortm1(cre/ERT2)Tyj] as a measure of Cre recombinase activity. Rosa26CreERT2 × ROSA-stop double-transgenic embryos exhibited ubiquitous strong positive lacZ staining (indigo color [see Fig. 2A, B and D]), while their ROSA-stop embryo littermates showed negative staining at the developmental stages indicated below (see Fig. 2A to C). On the basis of these results, a decision was made to inject 100 mg/kg body weight of tamoxifen into pregnant females to induce Cre-mediated excision of the Brg1flox/flox gene.
FIG 2.
Rosa26CreERT2 is ubiquitously expressed in the developing embryo. The lacZ staining of ROSA-stop and double-mutant Rosa26CreERT2 × ROSA-stop embryos collected at E7.5, E8.5, and E9.5 from pregnant females mated at specific times and treated with tamoxifen at E6.5 is shown. Indigo staining of Rosa26CreERT2 × ROSA-stop embryos is strongly positive. (A, B, D) Rosa26CreERT2 × ROSA-stop embryos from E7.5, E8.5, and E9.5 show Cre-ER expression in almost all tissues, including the extraembryonic ectoderm, epiblast, and yolk sac. (C) ROSA-stop embryos (control) lack staining. (E) qPCR of Brg1fl/fl and Brg1d/d RNA samples show significant downregulation of Brg1 mRNA in Brg1d/d versus Brg1fl/fl embryos. (F, G) The Brg1fl/fl embryo section demonstrates strong immunostaining for Brg1 (F), while the Brg1d/d embryo section demonstrates markedly reduced immunostaining (G).
lacZ staining.
To confirm the Cre recombinase activity, the ROSA-Cre/ERT2 mice [B6.129-Gt(ROSA)26Sortm1(cre/ERT2)Tyj/J] were bred with ROSA-stop reporter mice [B6.129S4-Gt(ROSA)26Sortm1Sor/J], and β-galactosidase activity was measured in the double-mutant embryos [B6.129S4-Gt(ROSA)26Sortm1Sor/J Tg B6.129-Gt(ROSA)26Sortm1(cre/ERT2)Tyj] as a demonstration of Cre recombinase activity. X-Gal (5-bromo-4-chloro-3-indolyl-β-d-galactopyranoside) staining was performed according to a standard protocol (19) to measure the β-galactosidase activity (lacZ staining) of whole embryos.
Tamoxifen dose determination.
The 100-mg/kg tamoxifen dose was dissolved in ethanol to yield a 100-mg/ml stock, which was then diluted with corn oil to achieve a 10-mg/ml tamoxifen formulation (10% ethanol in the final tamoxifen formulation). The higher 225-mg/kg and 150-mg/kg doses were prepared from correspondingly higher concentrations of ethanol stocks diluted with corn oil to a 10% ethanol concentration. The initial maximum dose level was 225 mg/kg, with a maximum dose volume of 0.45 ml being used per animal.
Creation of inducible Brg1-conditional-knockout mice.
Mice harboring the floxed/floxed Brg1 allele (B6;128S2-Smarca4tm1Pcn/Mmnc) were a generous gift from Terry Magnuson (University of North Carolina, Chapel Hill). The floxed/floxed Brg1 allele encodes the wild-type Brg1 protein, but the deleted Brg1flox/flox allele does not produce a functional protein. To generate the inducible Cre-Brg1flox/flox mice, Brg1flox/flox mice were bred with Rosa26CreERT2 transgenic mice carrying the CreERT2 gene driven by the endogenous mouse Gt(ROSA)26Sor promoter [B6.129-Gt(ROSA)26Sortm1(cre/ERT2)Tyj/J]. To delete the Brg1flox/flox gene in developing embryos, Rosa26CreERT2 [B6;129-Gt(ROSA)26Sortm1(cre/ERT2)Tyj/Brg1flox/flox (Smarca4tm1Pcn)] male mice were mated to Brg1flox/flox female mice. Pregnant dams were given a single dose (100-mg/kg body weight) of pharmaceutical-grade tamoxifen citrate (Sigma, St. Louis, MO) by i.p. injection at E6.5. Embryonic staging was determined by standard methods, with E0.5 being set as the morning on which vaginal plugs were found. Embryos were harvested at E6.5, E7.5, E8.5, E9.5, and E10.5; extraembryonic tissue was used for genotyping. Embryos were photographed and fixed in 10% neutral buffered formalin for 24 h. Embryos were processed, embedded in paraffin, serially sectioned at 5 μm, mounted on positively charged glass slides, and stained with hematoxylin and eosin for histological examination. For Brg1 genotyping, three primers (primer P1, GTCATACTTATGTCATAGCC; primer P2, GCCTTGTCTCAAACTGATAAG; primer P3, GATCAGCTCATGCCCTAAGG) were used to amplify wild-type Brg1 alleles (241-bp PCR product; primers P1 and P2), floxed/floxed Brg1 alleles (387-bp PCR product; primers P1 and P2), and deleted floxed/floxed Brg1 alleles (313-bp PCR product; primers P1, P2, and P3) (20). For Cre genotyping, the forward primer 5′-GCGGTCTGGCAGTAAAAACTATC-3′ and the reverse primer 5′-GTGAAACAGCATTGCTGTCACTT-3′ were used for PCR amplification (20, 21). All animal husbandry, handling, and experiments were performed in accordance with NIEHS, NIH, guidelines covering the humane care and use of laboratory animals in research.
Tamoxifen-induced Rosa26CreERT2 excises the Brg1flox/flox sequence.
Tamoxifen-inducible Brg1flox/flox/CreTM mice [B6;129-Gt(ROSA)26Sortm1(cre/ERT2)Tyj/J Smarca4tm1Pcn] (Rosa26CreERT2; Brg1flox/flox) were generated by crossing Rosa26CreERT2 mice to Brg1flox/flox (Smarca4tm1Pcn) mice (20). To determine the functional significance of Brg1 in the early embryo, we temporally deleted Brg1 from the whole embryo by crossing Rosa26CreERT2; Brg1flox/flox male mice to Brg1flox/flox female mice. The cross yielded Brg1flox/flox/Cre progeny at the expected Mendelian frequency of 50%. On the basis of the Rosa26CreERT2 × ROSA-stop result, tamoxifen treatment was predicted to produce ubiquitously distributed Brg1-inactivated (Brg1d/d) cells in the Brg1flox/flox/Cre embryos. In order to inactivate Brg1 during early development, we injected tamoxifen at a dose of 100 mg/kg of body weight into pregnant females at E6.5, and embryos were collected from E7.5 to E9.5. All the Brg1d/d embryos were undergoing apoptosis and necrosis at E9.5, while their littermate controls showed normal development. Embryos in which the Brg1 protein was inactivated were smaller and paler than their littermates. However, all Brg1d/d embryos were alive at E7.5 to E8.5, and the litter sizes were normal. The efficient ablation of Brg1 in the whole embryo was confirmed by genotyping of the embryonic tissues. For Brg1 genotyping, three primers were used to amplify the wild-type Brg1 allele (241-bp PCR product; primers P1 and P2), the floxed/floxed Brg1 allele (387-bp PCR product; primers P1 and P2), and deleted floxed/floxed Brg1 allele (313-bp PCR product; primers P1, P2, and P3) (20, 21). For Cre genotyping, primer sets produced a 102-bp PCR product. In agreement with these genotyping results obtained by PCR, the Brg1 mRNA level was significantly decreased (see Fig. 2E) and the Brg1 protein was barely detected by immunohistochemistry in E9.5 Brg1flox/flox/CreTM whole embryos (see Fig. 2G). In contrast, the Brg1 protein was readily detected in the Brg1flox/flox littermates (see Fig. 2F). These data demonstrate the successful creation of a Brg1-conditional-knockout mouse model to ubiquitously inactivate the Brg1 protein temporally in early development.
Histology and immunohistochemistry.
For histological preparation, embryos without decidua and in decidua were fixed in 4% paraformaldehyde–phosphate-buffered saline (PBS) or 10% neutral buffered formalin for 18 h at 4°C, dehydrated, and embedded in paraffin. For bromodeoxyuridine (BrdU) analysis, pregnant dams were i.p. injected with BrdU at 0.1 ml g−1 body weight 2 h before being killed. Embryos were collected intact within the uterine horns and fixed for 48 h. Paraffin-embedded tissues were sectioned at 5 μm and mounted on positively charged glass slides. For analysis of programmed cell death, the sections were stained on the basis of reactivity, determined by terminal deoxynucleotidyltransferase-mediated dUTP-biotin nick end labeling (TUNEL) using an Apop Teg in situ apoptosis detection kit (Oncor) according to the manufacturer's instructions. Immunohistochemistry was performed for the following biomarkers: BrdU (Biocare Medical), Brg1 (Santa Cruz), cleaved caspase-3 (Biocare Medical), cyclin D1 (Cell Marque), phospho-histone H3 Ser10 (pH3S10; Millipore), p53 (Vector Laboratories), and CHD4 (catalog number ab70469; Abcam). Detailed protocols are provided at the NIEHS website (https://www.niehs.nih.gov/research/atniehs/labs/lep/path-support/immuno/protocols/immunohistochemistry/index.cfm).
Labeling and mitotic index.
The labeling and mitotic indices were generated from a section of the embryo neural tube that had been immunohistochemically stained with pH3S10 or BrdU, respectively, and scanned under ×40 magnification. Using the Cell Counter feature in ImageJ (version 1.49) software, the positively stained cells and non-positively stained cells were counted. For BrdU analysis, cells with brown nuclear staining were counted as positive. For a cell to be counted with regard to the mitotic index, the entire nucleus had to stain dark brown. Cells with a stippled brown staining pattern that did not cover the entire nucleus were counted as nonpositive cells. The indices were then determined by dividing the number of positively stained nuclei by the total number of cells counted, and that value was multiplied by 100 to get a percentage. The cells in two Brg1flox/flox embryos and four Brg1d/d embryos were counted at E9.5 for determination of the mitotic index. Cells in four Brg1flox/flox embryos and four Brg1d/d embryos were counted at E9.5 for determination of the BrdU labeling index.
Microscope image acquisition.
We used the following model of microscope and imaging instruments for photography: an Olympus Plan Apo microscope with a 20× objective (numerical aperture, 0.75), an Aperio AT2 digital slide scanner, Leica eSlide manager (version 12.1.0.5029) software, ImageScope version Adobe software, and Photoshop CC (release 2014.0.0) software.
Microarray analysis.
RNA from Brg1flox/flox (wild-type control) day 8.5 embryos (three biological replications) and RNA from Brg1d/d (Brg1-conditional-knockout) day 8.5 embryos (three biological replications) were used for global gene expression analysis. Gene expression analysis was conducted using Agilent whole-mouse-genome 4 × 44 multiplex format oligonucleotide arrays (catalog number 014868; Agilent Technologies) following the Agilent 1-color microarray-based gene expression analysis protocol. Starting with 250 ng of total RNA, Cy3-labeled cRNA was produced according to the manufacturer's protocol. For each sample, 1.65 μg of Cy3-labeled cRNAs was fragmented and hybridized for 17 h in a rotating hybridization oven. The slides were washed and then scanned with an Agilent scanner. Data were obtained using Agilent Feature Extraction (version 9.5) software and the 1-color defaults for all parameters. The Agilent Feature Extraction software performed error modeling, adjusting for additive and multiplicative noise. The resulting data were processed using OmicSoft Array Studio (version 6.0) software. In order to identify differentially expressed probes, analysis of variance (ANOVA) was used to determine if there was a statistically significant difference from the group mean. Specifically, an error-weighted ANOVA and Benjamini-Hochberg multiple-test correction with a P value of <0.05 were performed using OmicSoft Array Studio (version 6.0) software.
Analysis of microarray data.
The feature extractor-processed raw signal was log2 transformed, quantile normalized, and summarized for each probe using the median polish algorithm. Next, genes differentially expressed in Brg1-conditional-knockout samples compared to their expression in control samples were identified using the signal-to-noise statistic, defined as the ratio of the average difference in the signals and the sum of the between-replicate standard deviations (SDs). The adjusted and unadjusted P values for this signal-to-noise statistic were computed using the left and right tails of the empirical distribution generated by 10,000 sample/probe permutations.
A nominal P value threshold of 0.05 (nominal P value, ≤0.05) and an absolute fold change in expression threshold of 2.0 (absolute fold change, ≥2.0) were used to identify differentially expressed probes. An Agilent design file (catalog number 014868D) was used to map probe identifiers to the corresponding genes in RefSeq.
Association between differential gene expression and CHD4/Brg1 binding.
For further evaluation, Brg1 and CHD4 peaks (hot spots) (22) were compared at 409 differentially expressed genes (DEGs). Genes were tagged as bound or not bound if there was a 10-kb window peak overlap around the transcription start site (TSS). The log2 fold changes in gene expression of up- and downregulated probes from those of probes that were associated with bound and unbound genes, respectively, were compared using the Wilcoxon signed-rank test (see Fig. 9). In addition, Fisher's exact test was employed to detect the enrichment/depletion of bound genes among up- and downregulated genes (see Fig. 9).
FIG 9.
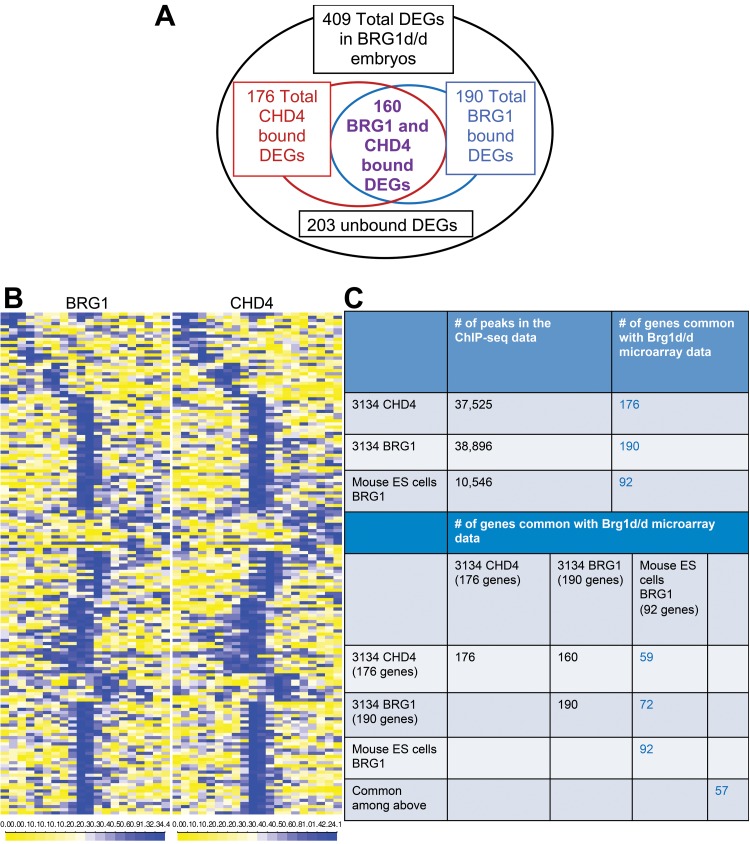
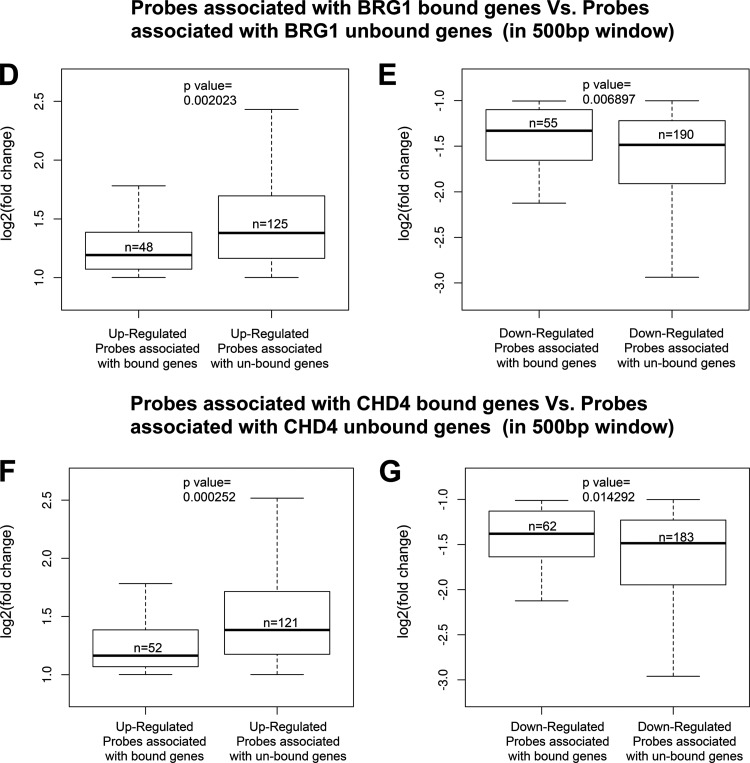
Brg1 directly regulates genes differentially expressed in Brg1 mutant embryos. (A) Venn diagrams representing the total and overlapping number of binding sites for Brg1 (10 kb to TSS, 3134 cells) and CHD4 on DEGs in Brg1d/d embryos. (B) Average fold enrichment in the Brg1 and CHD4 overlapping ChIP signal is shown in 10-kb windows surrounding the TSSs of 160 tagged genes that are differentially expressed in Brg1d/d embryos. The heat map has 20 bins of 1 kb each. The heat map plot is drawn in quantile scale, which represents the Z-score. The scale is shown at the bottom of the ChIP-seq heat map. Yellow represents a low Z-score and, thus, a low signal, and blue represents a high Z-score and, thus, a high signal. (C) The table shows the number of genes that have a ChIP-seq binding site within 10 kb of the TSS, and the results were compared to those for the DEGs from the microarray data for Brg1d/d embryos at E8.5. (D to G) To test for differences in gene expression between Brg1d/d and Brg1f/fl embryos among genes that were bound by Brg1 or CHD4 versus those that were not bound by Brg1 or CHD4, we performed a Wilcoxon signed-rank test on the log2 fold changes in gene expression for up- and downregulated probes, where probes were divided into two groups on the basis of their Brg1 (D and E) or CHD4 (F and G) binding. The results indicate a significant difference (P < 0.05), where upregulated genes that are bound by Brg1 (D) or CHD4 (F) display a lower fold induction than upregulated genes that are not bound by Brg1 (or CHD4). Similarly, downregulated genes that were bound by BGR1 (D) or CHD4 (G) showed significantly less downregulation than those that were not bound by Brg1 or CHD4.
qPCR analysis.
RNA was isolated from early embryos using an Arcturus PicoPure RNA isolation kit and an Invitrogen RNA isolation kit; cDNA was synthesized using a SuperScript first-strand synthesis system (Invitrogen) with oligo(dT) primers. Quantitative real-time PCR (qPCR) measurements of individual cDNAs were performed with a SYBR green real-time PCR detection system. Primers specific for the cell cycle regulator genes were designed by the use of gene transcripts available in the NCBI database and Primer3Plus software. The rodent glyceraldehyde-3-phosphate dehydrogenase (GAPDH) gene was used as an internal control. The primer sequences will be provided upon request. All measurements were performed in triplicate. Values were normalized to those for the GAPDH gene using the 2−ΔΔCT threshold cycle (CT) method and are expressed as means ± SDs.
Cell culture and siRNA cell transfection.
P19 cells were grown in alpha minimal essential medium (α-MEM; ThermoFisher Scientific catalog no. 12571071) containing 10% fetal bovine serum (FBS). Small interfering RNA (siRNA) duplexes targeting Brg1 mRNA (siGENOME SMARTpool SMARCA4, catalog number M-041135-01-0005; Brg1 ON-TARGETplus siRNA, catalog number J-041135-06-0005), CHD4 (siGENOME, catalog number D-052142-02-0010), and a nontarget control (NTC), used as a negative control of transcriptional activation knockdown (ON-TARGETplus siRNA, catalog number D-001810-0X (170 pmol/well of a 6-well culture dish, 8.5 to 20 pmol/μl) were synthesized by Dharmacon. A total of 2.5 × 10⁵ cells were seeded per well (6-well plate). siRNA (100 μM) was used to transfect the cells in each well. Cell culture and transfection were performed according to the Invitrogen Lipofectamine-optimized protocol for the P19 cell line (ATCC). The cells were extracted at 48 to 72 h posttransfection. The extent of Brg1 and CHD4 protein knockdown was determined by immunoblotting. A 2% (vol/vol) solution of poly(2-hydroxyethyl methacrylate) (catalog number P3932-10G; Sigma) solution in ethanol-acetone was used to coat the tissue culture plates to make embryoid bodies.
Western blot analyses.
Cells were scraped from the culture dish and lysed in buffer X (100 mM Tris-HCl [pH 8.5], 250 mM NaCl, 1% NP-40, 1 mM EDTA). The cell lysate was run on an SDS-polyacrylamide gel (7.5% TGX precast gels [catalog number 456-1024S] and 4 to 15% TGX precast gels [catalog number 4561084]; Bio-Rad), the separated proteins were transferred to a nitrocellulose membrane, and the membrane was incubated with the appropriate antibody dilution (anti-p16 ARC antibody [clone EP1551Y; catalog number ab51243; Abcam] or p53 antibody [clone DO-1; catalog number sc-126; Santa Cruz Biotechnology]) overnight on a rotating wheel at 4°C. The membrane was washed with Tris-buffered saline with 0.1% Tween 20 (TBST), and the blot was incubated with the appropriate secondary antibody dilution, washed, and developed with an enhanced chemiluminescence (ECL) Western blot substrate (catalog number 32106; Pierce).
Cell growth assay.
Cell growth was analyzed using a WST-8 cell counting kit 8 (CCK-8) (Dojindo) according to the manufacturer's instruction. Briefly, the cells were seeded at 2,000 cells/well in 96-well plates and reverse transfected with siRNA. The cells were cultured with 10% FBS. On the day of growth measurement, 100 μl of the spent medium was replaced with an equal volume of fresh medium containing 10% WST-8, and the culture was incubated at 37°C for 120 min. The absorbance at 450 nm was measured using a microplate reader. The results were plotted as the mean ± SD from three replicates, and the experiment was repeated twice.
Cell cycle analysis.
The cell cycle distribution was analyzed using flow cytometry. Before analysis, the cells were serum deprived for 24 h to synchronize the cell cycle or were synchronized by use of a double thymidine block, and then the cells were incubated with α-MEM containing 10% FBS for 24 h after serum deprivation. The cells were trypsinized, rinsed with PBS, and fixed with 70% ice-cold ethanol at 4°C or −20°C overnight. Before analysis, the cells were washed with PBS and resuspended in 0.05 mg/ml propidium iodide (PI; Sigma, St. Louis, MO) solution containing RNase A (0.02 mg/ml). The cells were incubated for 30 min in the dark and analyzed by flow cytometry (BD Biosciences). The results for at least 1×10⁴ cells were recorded for each sample, and the data were analyzed using Cell Quest software (BD Biosciences).
Quantification of apoptosis.
Cells were cultured in serum-free α-MEM for 24 h to induce apoptosis and then cultured in complete medium containing 10% FBS for 0 or 24 h, harvested using trypsin, washed with PBS, centrifuged, resuspended in 1 ml binding buffer, and stained with 10 μl annexin V-fluorescein isothiocyanate (FITC) and 10 μl PI at room temperature for 15 min (Trevigen). The stained cells were immediately analyzed using flow cytometry. CellQuest software was used for data acquisition and analysis, and the percentage of apoptotic cells was determined.
ChIP.
Two litters of mouse embryos from E8.5 were dissected in chilled PBS. Chromatin immunoprecipitation (ChIP) was performed as previously described with minor modifications (29). Cells were cross-linked by adding 13.5 μl of 36.6% formaldehyde (catalog number 8775; Sigma) per 500 μl of sample for 15 min at room temperature. Addition of 57 μl of 1.25 M glycine to the sample stopped the fixation. For the CHD4 ChIP, formaldehyde fixation was followed by a 45-min incubation in 2 mM disuccinimidyl glutarate (DSG; catalog number 80424-50MG-F; Sigma). The cells were lysed in cold lysis buffer 1 (50 mM HEPES-KOH, pH 7.5, 140 mM NaCl, 1 mM EDTA, 10% glycerol, 0.5% NP-40, 0.25% Triton X-100, 1× protease inhibitors) and gently rocked at 4°C for 10 min in 14-ml conical tubes. The cells were pelleted by centrifugation at 1,350 × g at 40°C in a tabletop centrifuge and resuspended in cold lysis buffer 2 (10 mM Tris-HCl, pH 8.0, 200 mM NaCl, 1 mM EDTA, 0.5 mM EGTA, 1× protease inhibitor) and gently rocked at 4°C for 10 min in 14-ml conical tubes. The cells were pelleted by centrifugation at 1,350 × g at 4°C in a tabletop centrifuge and resuspended in 2 ml cold lysis buffer 3 (10 mM Tris-HCl, pH 8.0, 100 mM NaCl, 1 mM EDTA, 0.5 mM EGTA, 0.1% Na-deoxycholate, 0.5% N-laurylsarcosine, 1× protease inhibitor) and sonicated to 200- to 600-bp fragments using a Diagenode Bioruptor apparatus (three 10-min cycles of 30 s on and 30 s off at 4°C). For Brg1 and CHD4 ChIP, cells were resuspended and sonicated (18 W) in sonication buffer (50 mM Tris-HCl, pH 7.5, 140 mM NaCl, 1 mM EDTA, 1 mM EGTA, 1% Triton X-100, 0.1% Na-deoxycholate, 0.1% SDS) for 15 cycles of 30 s each on ice with 30 s off the ice between cycles. Sonicated lysate was cleared by pelleting insoluble material by centrifugation at 20,000 × g at 4°C, followed by incubation with antibody-bound protein G magnetic beads (2.5 μg antibody/50 μl beads/immunoprecipitation) in 1 ml of 0.5% bovine serum albumin–PBS overnight at 4°C. Magnetic beads were washed 3 times with blocking solution (0.5% bovine serum albumin, PBS), incubated for approximately 4 h at 40°C with antibody in blocking solution, and then washed 3 times with blocking solution prior to addition of cleared cell lysates. Chromatin was immunoprecipitated using Brg1 (catalog number NB100-2594; Novus), CHD4 (catalog number ab70469; Abcam), HDAC1 (catalog number ab7028; Abcam), and IgG antibodies. Immunoprecipitated material was washed five times with cold radioimmunoprecipitation assay buffer (50 mM HEPES-KOH, pKa 7.55, 500 mM LiCl, 1 mM EDTA, 1.0% NP-40, 0.7% Na-deoxycholate) and one time with TE (Tris-EDTA) plus 50 mM NaCl, followed by elution and un-cross-linking in 210 μl of 1% SDS in TE overnight at 65°C. For Brg1 and CHD4 ChIP, the beads were washed three times with sonication buffer, one time with sonication buffer with 500 mM NaCl, one time with LiCl wash buffer (20 mM Tris, pH 8.0, 1 mM EDTA, 250 mM LiCl, 0.5% NP-40, 0.5% Na-deoxycholate), and one time with TE. Un-cross-linked material (200 μl) was treated with RNase A for from 30 min to 2 h and proteinase K for from 30 min to 2 h and extracted 2 times with phenol-chloroform-isoamyl alcohol, followed by ethanol precipitation with 3 M sodium acetate and a glycogen coprecipitant, a wash with 80% ethanol, and final resuspension in TE or water. The nucleic acid yield was determined by use of a Quant iT fluorescence assay (Invitrogen). Immunoprecipitated chromatin was evaluated by qPCR (Stratagene Mx300P and Brilliant SYBR green qPCR master mix). The average cycle threshold amplification values and percentage of sample input were calculated. A t test was done for all quantitative data sets for which results are presented in Fig. 10. The following PCR primers were used for qPCR analysis: M-p53-F-ChIP-(−44) (CAGCTTTGTGCCAGGAGTCT), M-p53-R-ChIP-(+78) (TCGCTACCTACAGCCAGGAT), M-p21-F-ChIP-(−77) (AAGGAGTGGGTTGGTCCTG), M-p21-R-ChIP-(+50) (CCAATTCCCCTAGACTCTGACA), M-p27-F-ChIP-(−36) (ACCAATGGAGCTCCTCCTCT), M-p27-R-ChIP-(+94) (GGAAAACACCCCAAAAGCAC), M-FAS-F-CHIP-(−350) (TCACTTGACCTGAGGGTGTG), M-FAS-R-CHIP-(−200) (CCACTGACTCACCACTGCAC), GADD45A-PROMOTERCHIP-F-M (GCTGAATCATGAAGCTGTAACTG), and GADD45A-PROMOTERCHIP-R-M (GGTTCAGGCAATGCTTTTGT). The primer positions relative to the transcriptional start site are denoted in parentheses (minus signs indicate upstream, and plus signs indicate downstream).
FIG 10.
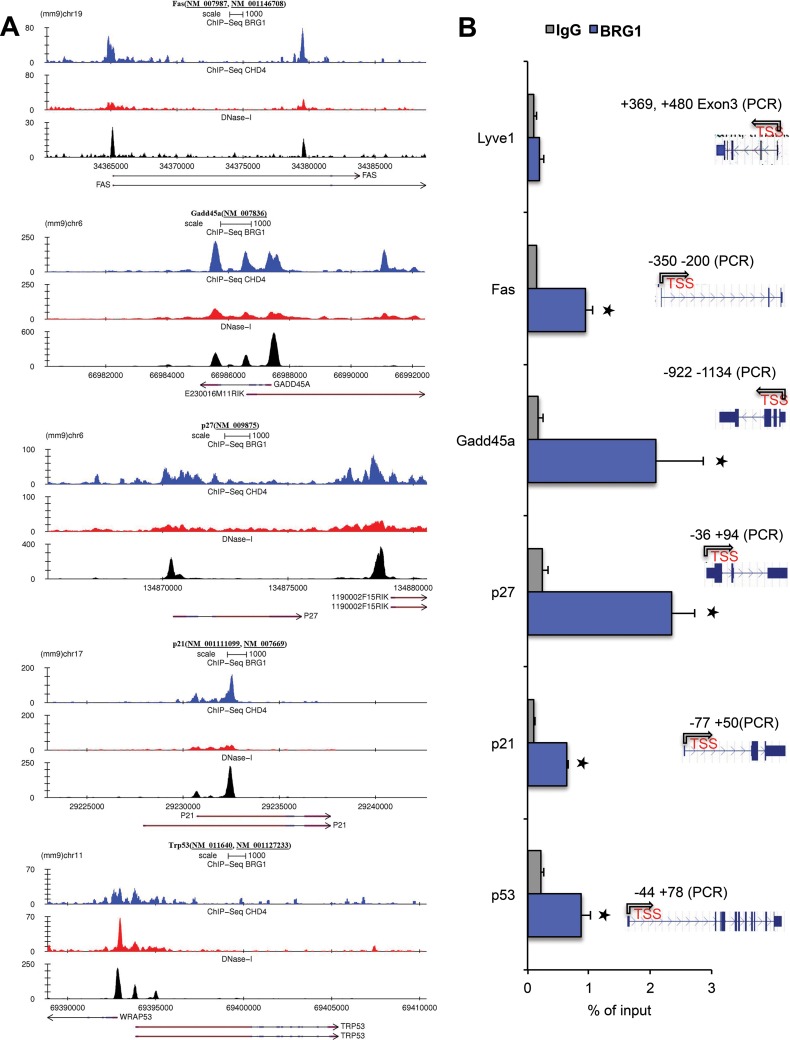
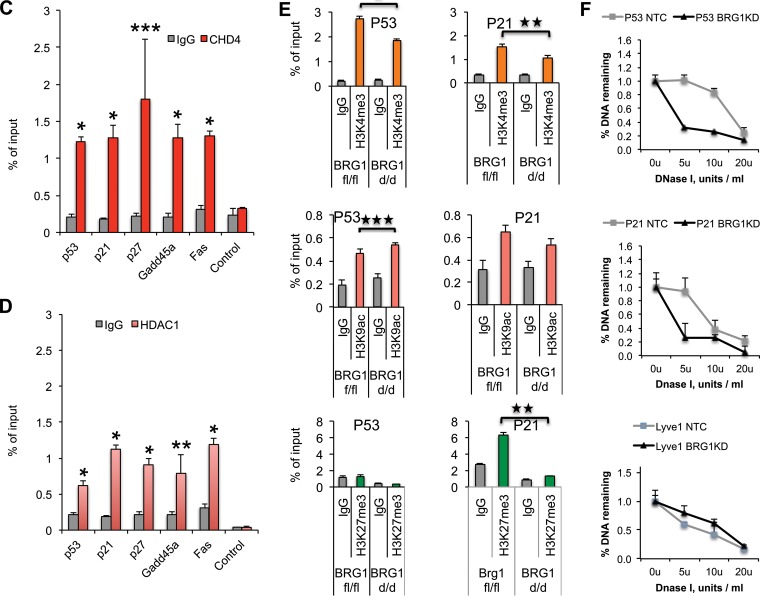
Brg1 directly regulates genes differentially expressed in Brg1d/d embryos and shares the genomic landscape with interacting chromatin regulators. (A) Several induced cell cycle- and apoptosis-related genes in Brg1d/d show a Brg1 distribution indicative of regulatory function. Examples of genome browser views of Brg1 (blue) and CHD4 (red) ChIP-seq occupancy and DNase I hypersensitivity (a measure of chromatin accessibility; black, DNase I sequencing) patterns in the 3134 mouse mammary epithelial cell line. The patterns are shown to overlap the patterns for the indicated genes, such as Fas, Gadd45a, p27, p21, and p53. Images represent tag densities (mapped sequence tags) relative to genome coordinates. (B) (Left) ChIP-qPCR shows Brg1 occupancy compared with that of IgG on the indicated gene promoter in embryos at E8.5. (Right) Snapshot of the gene track from the genome browser showing the ChIP primer location. *, P < 0.001 (Student's t test). (C, D) ChIP-qPCR showing CHD4 and HDAC1 occupancy on the promoters of specific cell proliferation- and apoptosis-related genes in P19 cells. Chromatin immunoprecipitation of P19 cells was performed using antibodies against CHD4 and HDAC1 and IgG. Data are plotted as a percentage of the total input or the amount of chromatin bound. *, P < 0.001; **, P < 0.01; ***, P < 0.02 (Student's t test). (E) Evaluation of H3K4me3, H3K9ac, and H3K27me3 on the promoter regions of p53 and p21 in Brg1fl/fl and Brg1d/d embryos. Chromatin immunoprecipitation of Brg1fl/fl and Brg1d/d embryos was performed using antibodies against H3K4me3, H3K9ac, and H3K27me3 and analyzed by qPCR of immunoprecipitated DNA. *, P < 0.001; **, P < 0.01; ***, P < 0.04 (Student's t test). (F) Brg1 modulates the promoter chromatin structure at the promoters of the p21 and p53 genes in P19 cells. qPCR of DNase I-treated DNA samples from nontarget control and Brg1 siRNA-treated P19 cells shows the changes in chromatin structure upon Brg1 depletion. Each experiment was repeated at least twice.
Protein co-IP.
Coimmunoprecipitation (co-IP) was performed using an Active Motif co-IP kit. The lysates were incubated with antibodies to Brg1 (catalog number NB100-2594; Novus), CHD4 (catalog number ab70469; Abcam), and HDAC (catalog number ab7028; Abcam) and an IgG control. The immunocomplexes were recovered. SDS buffer was added to the precipitate, and the mixture was boiled for 10 min. Proteins were size separated in SDS-polyacrylamide gels. The gels were blotted onto a nitrocellulose membrane (Invitrogen), blocked with 5% nonfat dry milk, and incubated with the antibodies to Brg1 and CHD4 (catalog number A301-081A; Bethyl Laboratories). Horseradish peroxidase-conjugated secondary antibodies (GE Healthcare Biosciences) were used for detection using the ECL method (GE Healthcare Biosciences).
DNase sensitivity assays.
P19 cells were cultured as described above. The cells were extracted at 48 to 72 h posttransfection to make embryoid bodies. At day 4, the cells were collected and placed in cold PBS. Nucleus isolation and DNase digestion were performed as previously described, with modifications (23). Cells were washed once, harvested in ice-cold PBS, and spun at 300 × g (4°C) for 5 min, and the supernatant was removed. The cells were gently resuspended in 300 μl ice-cold reticulocyte standard buffer (RSB) (10 mM Tris-HCl, pH 7.4, 10 mM NaCl, and 3 mM MgCl2 to which 1 mM phenylmethylsulfonyl fluoride, 0.15 mM spermine, and 0.5 mM spermidine were added fresh), and 7 ml of RSB buffer plus 0.5% IGEPAL was slowly added. Following a 10-min incubation on ice, the cells were stained with trypan blue dye and the nuclei were examined under a microscope. After another wash, the cells were spun at 500 × g (4°C) for 10 min, the supernatant was removed, and the cells were gently resuspended in 2 ml DNase reaction buffer (40 mM Tris-HCl, pH 7.4, 10 mM NaCl, 6 mM MgCl2, 1 mM CaCl2, 0.15 mM spermine, 0.5 mM spermidine). The spin was repeated, and the cells were resuspended in 1 ml DNase reaction buffer. The cell nuclei were then counted, 1 × 10⁶ cells were placed into 6 microcentrifuge tubes, and the volume was adjusted to a total of 200 μl with buffer. Samples were warmed to 37°C in a ThermoMixer. DNase (0, 0.5, 1, 2, 4, and 6 U) was added to the tubes, and the tubes were incubated at 37°C for 5 min. The reaction was stopped by adding 200 μl of DNase stop solution (10 mM Tris-HCl, pH 7.4, 100 mM EDTA, pH 8.0, 50 mM NaCl, and 2% SDS to which 10 μg/ml RNase was added fresh). After a 15-min incubation at 55°C, 2 μl proteinase K stock solution (100 mg proteinase K, 250 μl Tris-HCl, pH 7.4, 150 μl of 100 mM CaCl2, 2.5 ml glycerol, H2O to 5 ml) was added to each tube. The incubation was repeated at 55°C for at least 4 h. DNA was purified by phenol-chloroform extraction (by the use of wide-bore tips) with at least 2 chloroform washes. Samples were spun at 5,000 × g for 5 min for extraction and washes. Sodium acetate (35 μl) and ethanol (800 μl) were added, and the mixture was spun at 8,000 × g at 4°C for 10 min. The supernatant was then carefully removed. The pellets were washed with 1 ml 70% ethanol. The pellets were spun at 8,000 × g at 4°C for 10 min, the supernatant was carefully removed, and the pellets were dried with a Speed-Vac apparatus for 10 to 15 min. The pellets were then resuspended in 60 μl TE, and the suspension was stored at −20°C in aliquots.
RESULTS
Brg1 is globally required during early development.
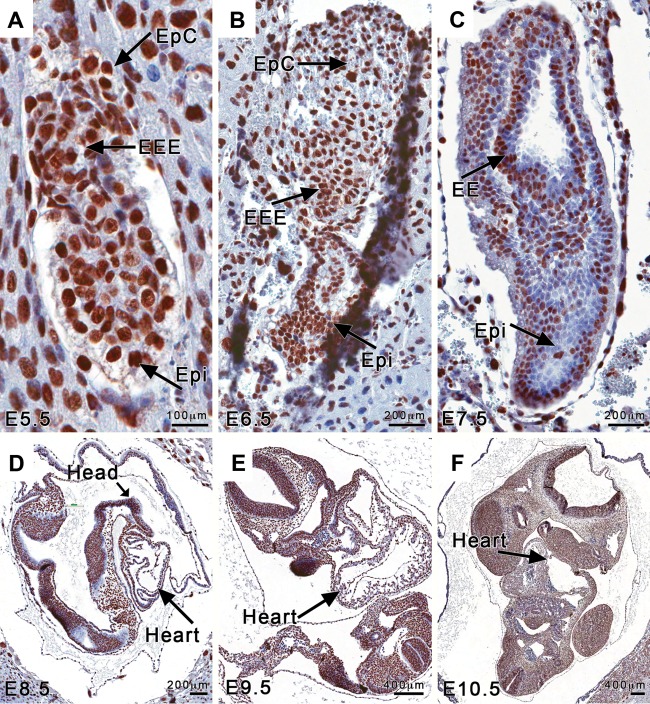
We investigated when and where the Brg1 protein is detected in the normal embryo, which is an important first step in defining Brg1 gene functions. In early embryos, the Brg1 protein was easily detectable in decidua and in extraembryonic and epiblast cells at E5.5, E6.5, and E7.5, followed by the heart, head, and trunk cells at E8.5, E9.5, and E10.5. At E5.5 and E6.5, cells positively staining for Brg1 were widely present in the extraembryonic and embryonic ectoderm (Fig. 1A and B). Brg1 was localized to the nuclei of cells comprising the ectodermal layers of the chorion, the ectoplacental canal, and the early allantoic bud (mesoderm) and cells of the adjacent amniotic ectoderm, epiblast, and primitive streak at E7.5 (Fig. 1C). In later stages, at E8.5, E9.5, and E10.5, the embryo and placental tissues had strong and varied immunoreactivity for Brg1 (Fig. 1D to F). Programmed cell death and rapid proliferation are key events in the early developing embryo. Therefore, we hypothesized that the widespread distribution of the Brg1 protein is consistent with its ability to regulate genes associated with apoptosis and proliferation during early development. To examine how the Brg1 gene may function in the events of early development, we globally inactivated the Brg1flox/flox (Brg1fl/fl) gene during perigastrulation development using a ubiquitously expressed tamoxifen-inducible Cre transgene (Rosa26CreERT2) (Fig. 2A, B, and D; see Materials and Methods).
FIG 1.
Brg1 is widely detected in the early embryo. (A to C) Histological sections of mouse embryos from early developmental stages, E5.5 (A), E6.5 (B), and E7.5 (C), show strong and varied Brg1 immunostaining. EpC, ectoplacental cone; EEE, extraembryonic ectoderm; Epi, epiblast. (D to F) Histological sections of mouse embryos from E8.5 (D), E9.5 (E), and E10.5 (F) exhibit strong and widespread Brg1 immunostaining in all organs and tissues types visible at these later stages.
A lack of Brg1 function results in developmental arrest during early gestation.
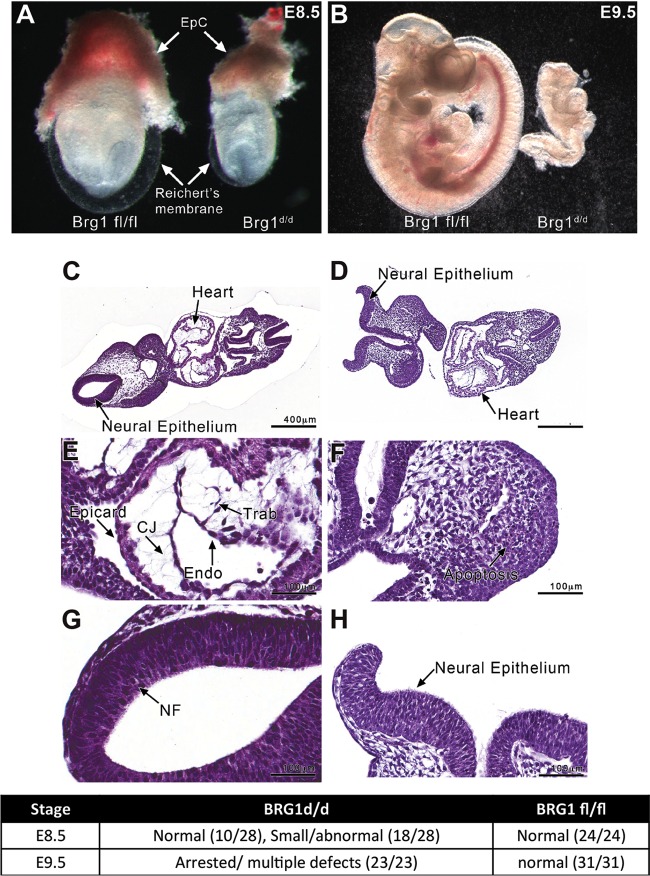
To examine Brg1 function in utero, pregnant Brg1fl/fl dams mated with Rosa26CreERT2; Brg1fl/fl sires were dosed with tamoxifen, and embryos were collected at E7.5, E8.5, and E9.5 for analysis. The dams were dosed with tamoxifen, as indicated in the Materials and Methods. The genotypes of the dissected embryos were determined by performing PCR of genomic DNA obtained from the yolk sacs of each embryo. Additionally, qPCR and immunohistochemistry analyses confirmed that Brg1 gene mRNA and Brg1 protein levels were greatly reduced in Brg1d/d embryos (Brg1d/d indicates embryos from which the Brg1flox/flox allele is deleted) compared to their levels in Brg1fl/fl embryos (Fig. 2E to G). Brg1d/d embryos were analyzed from E7.5 to E9.5. At E7.5, no obvious abnormal phenotype was observed in Brg1d/d embryos compared to the phenotype of Brg1fl/fl embryos, and the Brg1d/d embryos were morphologically similar to Brg1fl/fl embryos. At E8.5, the Brg1d/d embryos were visibly distinct and showed a retarded growth phenotype compared to the growth phenotype of Brg1fl/fl embryos (Fig. 3A). Additionally, at E8.5, Brg1d/d embryos had only 2 to 6 somites and were approximately two-thirds of the size of their wild-type littermates, which had 8 to 12 somites (Fig. 3A). All Brg1d/d embryos exhibited developmental defects and were arrested by E9.5 (Fig. 3B). At E8.5 and E9.5, Brg1d/d embryos could be easily distinguished from their littermates by their much smaller size, pale color, enlarged pericardium, and incomplete process of turning. Brg1d/d embryos could not be isolated at E10.5, likely due to advanced resorption.
FIG 3.
Brg1d/d embryos reveal growth retardation and exhibit developmental defects. (A) Substantial growth retardation of Brg1d/d embryos (right) compared to Brg1fl/fl embryos (left) from the same litter at E8.5 (EpC, ectoplacental cone). (B) At E9.5, the Brg1fl/fl embryo demonstrates a normal size and shape (left), whereas the Brg1d/d embryo shows further retardation (right). (C to H) Histologic analysis of Brg1fl/fl and Brg1d/d embryos at E9.5 shows anatomical structures. (C, E) Frontal sections of a Brg1fl/fl embryo show a normal embryo morphology, including the neural tube and the developing heart. (D) A frontal section of a Brg1d/d embryo shows an abnormal histomorphology with a neural tube deformity. (G) A higher magnification of the Brg1fl/fl embryo reveals normal closure of the neural tube. (F and H) A higher magnification of the Brg1d/d embryo reveals active apoptosis in the mesenchyme (F) and incomplete closure of the neural folds to form the neural tube (H). Epicard, epicardium; CJ, cardiac jelly; Trab, trabeculae; Endo, endocardium; NF, neural fold. (I) Growth phenotype observed for Brg1fl/fl and Brg1d/d embryos at E8.5 and E9.5. The values in parentheses indicate the number of embryos with the indicated phenotype/total number of embryos tested.
Next we performed detailed histological analysis to evaluate anatomical deformities in Brg1d/d embryos compared to Brg1fl/fl embryos. Histological sections of Brg1d/d embryos at E9.5 revealed several developmental defects, including failure of the neural folds to close (Fig. 3D, F, and H), compared with Brg1fl/fl embryos (Fig. 3C, E, and G). Further, histological analysis revealed that Brg1d/d embryo sections contained apoptotic and necrotic lesions (Fig. 3F). Despite these defects, at E8.5 and E9.5 all the Brg1d/d embryos maintained yolk sacs. These observations implicated Brg1 in the control of genes that regulate apoptosis and cell proliferation, needed for rapid embryonic growth during early development.
Brg1 inactivation leads to increased apoptosis in the early embryo.
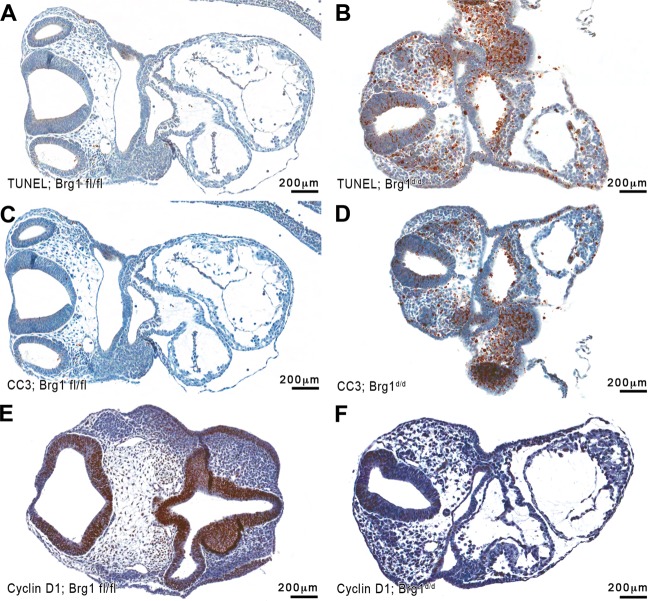
We analyzed the immunoreactivity of transverse sections of Brg1d/d and Brg1fl/fl embryos by TUNEL to examine whether the frequent pyknosis and growth failure of Brg1d/d embryos were associated with increased programmed cell death. Minimal TUNEL-positive cells were observed in sections of Brg1fl/fl embryos (Fig. 4A). In contrast, TUNEL-positive cell staining was widely distributed throughout Brg1d/d embryo bodies, including the neural epithelium, head mesenchyme, and heart (Fig. 4B).
FIG 4.
Cell death and cell growth marker immunohistochemistry applied to Brg1fl/fl and Brg1d/d E9.5 embryo sections. (A) TUNEL immunostaining is infrequent in Brg1fl/fl embryos. (B) TUNEL immunostaining is widespread in Brg1d/d embryos. (C, D) Cleaved caspase-3 (CC3) immunostaining is absent in Brg1fl/fl embryos (C) and present in Brg1d/d embryos (D). Immunohistochemistry detects the presence of proliferation markers in Brg1fl/fl and Brg1d/d embryos at E9.5. (E) Cyclin D1 (CCND1) immunostaining is frequent in Brg1fl/fl embryos. (F) CCND1 immunostaining is undetectable in Brg1d/d embryos.
Next, we used immunostaining to analyze a second apoptosis marker, cleaved caspase-3, to confirm the increased number of apoptotic cells in the Brg1d/d embryos. Cleaved caspase-3 immunostaining was undetectable in the sections of Brg1fl/fl embryos (Fig. 4C). Cleaved caspase-3 immunoreactivity was most intense in the sections of Brg1d/d embryos, particularly in the regions of the head mesenchyme, heart, gut, and neural fold (Fig. 4D), indicating that substantial cell death occurred in these areas of the embryo. The aberrant expression of cell death markers suggests that the loss of Brg1 function may result in increased apoptosis, which is correlated with growth arrest.
Cell proliferation is reduced in Brg1-deficient embryos.
An alternative hypothesis to explain the developmental arrest and reduced embryonic growth observed in the Brg1d/d embryos would be an alteration in cellular proliferation due to changes in cell cycle progression or decreased cell self-renewal. To test this hypothesis, we analyzed the pattern of distinctive proliferation markers using serial sections of the Brg1d/d and Brg1fl/fl embryos. The protein cyclin D1 (CCND1) is part of the core cell cycle machinery and functions as a regulatory protein for the G1-S cell cycle phase transition and for the transcriptional control of mammalian cells in the regulation of proliferation and differentiation. A striking difference in cyclin D1 staining between Brg1fl/fl and Brg1d/d embryos was observed. Intense CCND1 immunostaining was observed in the neural epithelium of the Brg1fl/fl embryo sections (Fig. 4E). In contrast, CCND1 staining was greatly reduced in the neural epithelium of the Brg1d/d embryo sections (Fig. 4F).
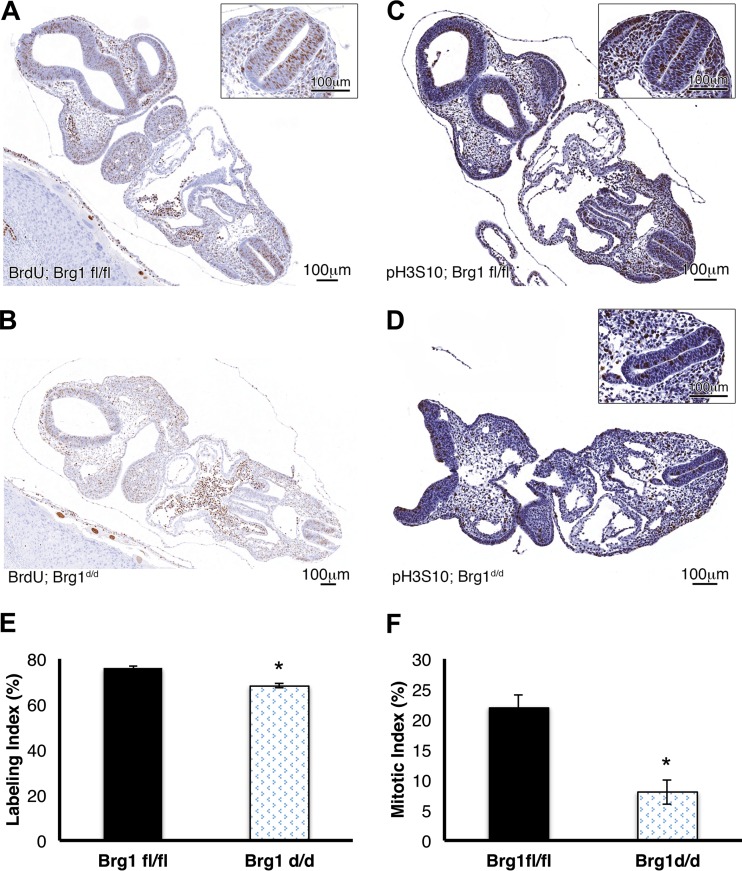
To further define the cellular proliferation rate in the Brg1d/d versus Brg1fl/fl embryos, we evaluated the incorporation of BrdU in the nuclei of all S-phase cells. The counts of positively stained neural epithelial cells in Brg1d/d embryos were significantly less (68%) than those in Brg1fl/fl embryos (76%) (Fig. 5A, B, and E), demonstrating that the cell proliferation rate in Brg1d/d embryos was decreased from that in Brg1fl/fl embryos. The impact of Brg1 inactivation on cell proliferation was further considered by examining the expression of the phosphorylation of histone H3 serine 10 (pH3S10) in dividing cells. Large populations of cells in Brg1fl/fl embryo sections stained positively for pH3S10; in contrast, much smaller populations of cells in Brg1d/d embryo sections were positively stained with pH3S10 (Fig. 5C, D, and F). These findings suggest that the loss of Brg1 activity results in a reduction of mitosis-associated phosphorylation of H3S10 and that this might impair mitosis and contribute to the reduced cell numbers seen in the early Brg1d/d embryos.
FIG 5.
Cell proliferation marker analyses of Brg1fl/fl and Brg1d/d embryos at E9.5. (A, B, E) Incorporation of BrdU in proliferating S-phase cells is increased in Brg1fl/fl embryos compared to that in Brg1d/d embryos. *, P < 0.05 (Student's t test). (C) Cells positively stained with pH3S10 are evenly distributed in Brg1fl/fl embryos. (D) Fewer cells positively stained with pH3S10 were detected in Brg1d/d embryos. (F) A semiquantitative mitotic index was obtained for both Brg1fl/fl and Brg1d/d embryos. *, P < 0.05 (Student's t test).
Another explanation for the decreased cell proliferation seen in Brg1d/d embryos is cellular senescence. Brg1fl/fl and Brg1d/d embryos were evaluated for endogenous β-galactosidase staining, a marker of cellular senescence. While positive staining was observed in the positive control, a highly passaged line of human skin fibroblast cells, staining was not detected in Brg1d/d and Brg1fl/fl embryos and in the negative control, a proliferating tumor cell line (data not shown).
In vivo Brg1 inactivation causes dysregulation of key functional pathways that regulate cell growth and apoptosis.
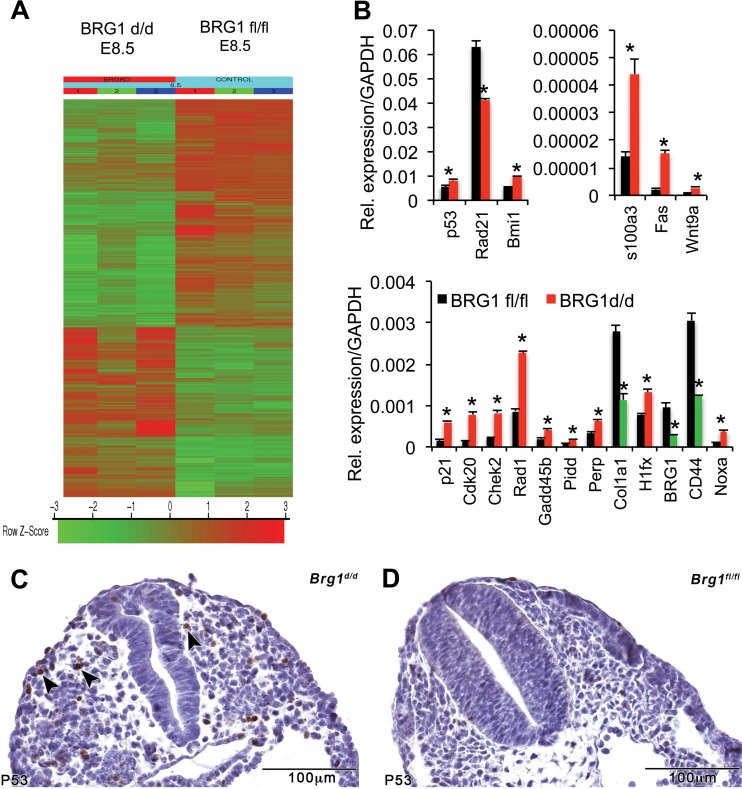
To uncover the changes in gene expression and pathways that could cause growth retardation in Brg1d/d embryos, global gene expression analyses were performed. Since growth retardation was first seen in Brg1d/d embryos at E8.5, comparative microarray analyses were conducted with mRNA collected from Brg1d/d and Brg1fl/fl embryos at E8.5. Statistical analysis identified 409 differentially expressed genes (DEGs) in Brg1d/d embryos at E8.5 (Fig. 6A). Ingenuity Pathway Analysis (Ingenuity Systems) of the upregulated and downregulated DEGs revealed that the top functional networks for the upregulated DEGs were associated with cell death and survival, cell growth, and cell proliferation (Table 1); functional networks of the downregulated DEGs in Brg1d/d embryos were associated with DNA replication, recombination, and repair (Table 1). Intriguingly, the p53 pathway, a key regulator of cell death and cell cycle progression, was the top-ranked upregulated pathway in Brg1d/d embryos (Table 1). Quantitative reverse transcription-PCR (qRT-PCR) analysis validated the quality and the reproducibility of the microarray data for a subset of differentially expressed cell death- and proliferation-related genes (Fig. 6B). To further explore the role of p53, we next examined p53 protein accumulation by immunohistochemistry in early embryos (Fig. 6C and D). The p53 expression pattern became heterogeneous and restricted to certain specific tissues when embryonic development entered a phase of organogenesis, which corresponds well to the restricted expression of p53 in Brg1d/d embryos displaying enhanced p53 positivity (24, 25). Many p53-positive cells were scattered throughout the Brg1d/d embryo body (Fig. 6C), whereas p53-positive cells were absent or rarely detected in the Brg1fl/fl embryo body (Fig. 6D). Total p53 staining intensity varied across cellular populations of Brg1d/d embryos. Apparently, p53 immunoreactivity shows a diverse expression pattern and is readily detected in cells that accumulated larger amounts of p53 protein in Brg1d/d embryos. This suggests that Brg1 deficiency elevated p53 levels in early embryos. Thus, the accumulation of p53 seen in Brg1 mutant embryos compared with the amount of p53 seen in wild-type embryos was sufficient to cause the induction of apoptosis (Fig. 4B and D) and activate p53 downstream pathway genes (Fig. 6A and B).
FIG 6.
Brg1 deficiency results in differential expression of the genes related to cell growth and apoptosis. (A) Heat map in which induced genes are indicated in shades of red and repressed genes are indicated in shades of green. The results for triplicate samples are shown. (B) The levels of expression of cell growth- and apoptosis-related genes significantly change in Brg1d/d embryos. *, P < 0.05. Quantitative PCR analysis shows the expression level of mRNA of the indicated genes in Brg1fl/fl and Brg1d/d embryos at E8.5. The levels of mRNA were normalized to those of GAPDH, which was used as a control. Data are expressed as the mean ± SD. *, statistically significant changes (P < 0.05). The data from three biological replicates are shown. Red, induced genes; green, repressed genes. (C, D) Immunohistochemistry shows the comparative positivity of Brg1fl/fl and Brg1d/d embryos for the p53 protein. Arrowheads, positively stained cells.
TABLE 1.
Regulation of genes from Brg1fl/fl and Brg1d/d mice at E8.5
| Gene regulation and function | P value or P value range | Ratioa | No. of molecules | IPA score |
|---|---|---|---|---|
| Upregulation | ||||
| Top canonical pathway | ||||
| p53 signaling | 1.41E−04 | 6/96 (0.062) | ||
| Type I diabetes mellitus signaling | 2.19E−03 | 5/120 (0.042) | ||
| Interleukin-12 signaling and production in macrophages | 3.87E−03 | 5/156 (0.032) | ||
| Farnesoid X receptor/retinoid X receptor activation | 6.66E−03 | 4/101 (0.04) | ||
| Role of pattern recognition receptors in recognition of bacteria and viruses | 1.03E−02 | 4/106 (0.038) | ||
| Top diseases and biological functions | ||||
| Neurological disease | 9.97E−05 to 1.02E−02 | 32 | ||
| Cancer | 1.48E−04 to 1.15E−02 | 26 | ||
| Reproductive system disease | 1.71E−04 to 9.11E−03 | 17 | ||
| Inflammatory disease | 2.03E−04 to 9.11E−03 | 22 | ||
| Inflammatory response | 2.03E−04 to 1.02E−02 | 20 | ||
| Molecular and cellular functions | ||||
| Cell death and survival | 1.18E−06 to 1.15E−02 | 32 | ||
| Cellular growth and proliferation | 1.18E−05 to 1.02E−02 | 21 | ||
| Cellular assembly and organization | 4.24E−05 to 1.02E−02 | 13 | ||
| Cellular function and maintenance | 4.24E−05 to 1.02E−02 | 18 | ||
| Cellular movement | 4.24E−05 to 9.11E−03 | 7 | ||
| Associated top network functions | ||||
| Humoral immune response, protein synthesis, lipid metabolism | 33 | |||
| Lipid metabolism, small-molecule biochemistry, vitamin and mineral metabolism | 28 | |||
| Cell death and survival, cancer, hair and skin development and function | 26 | |||
| Cell death and survival, cell-to-cell signaling and interaction, liver necrosis/cell death | 23 | |||
| Cellular development, embryonic development, tissue development | 23 | |||
| Downregulation | ||||
| Top diseases and biological functions | ||||
| Cancer | 3.86E−05 to 1.36E−02 | 122 | ||
| Reproductive system disease | 3.86E−05 to 1.36E−02 | 21 | ||
| Cardiovascular disease | 5.57E−05 to 1.36E−02 | 37 | ||
| Developmental disorders | 7.48E−05 to 1.36E−02 | 37 | ||
| Organismal injury and abnormalities | 1.98E−04 to 1.36E−02 | 36 | ||
| Molecular and cellular functions | ||||
| Cellular assembly and organization | 3.49E−06 to 1.36E−02 | 31 | ||
| Cellular development | 2.13E−05 to 1.36E−02 | 39 | ||
| Cellular growth and proliferation | 2.13E−05 to 1.36E−02 | 22 | ||
| Cellular function and maintenance | 1.02E−04 to 1.36E−02 | 27 | ||
| Cellular movement | 1.03E−04 to 1.36E−02 | 45 | ||
| Associated top network functions | ||||
| DNA replication, recombination, and repair, nucleic acid metabolism, small-molecule biochemistry | 32 | |||
| Cell death and survival, nervous system development and function, developmental disorders | 32 | |||
| Cell-to-cell signaling and interaction, hair and skin development and function, tissue development | 29 | |||
| Cardiovascular system development and function, connective tissue development and function, organismal development | 27 | |||
| Hair and skin development and function, cardiovascular system development and function, cell-to-cell signaling and interaction | 26 |
The data represent Ingenuity Pathway Analysis (IPA) of the genes upregulated and downregulated in Brg1fl/fl mice versus Brg1d/d mice (proportion).
Brg1 silencing in P19 cells produces upregulation of cell death and cell proliferation regulators.
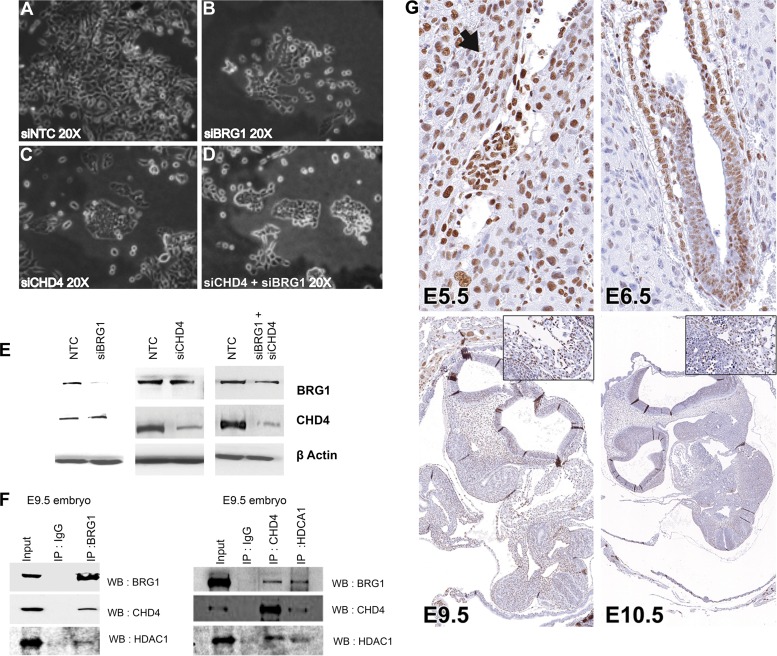
To ascertain if the change in expression of the apoptosis- and cell proliferation-related genes in the early embryo was directly due to the loss of Brg1 gene function, expression of the Brg1 protein was knocked down in cultured P19 cells using targeted siRNA. P19 cells are a mouse embryonal carcinoma cell line that have the ability to differentiate into all three germ layers by the same mechanism that normal embryonic stem cells use (26), and during early morphogenetic stages, the upregulation of p53 expression in all tissues resembles the overexpression of p53 in embryonal carcinoma (24). When P19 cells were transfected with nontargeting control siRNA, there was no adverse effect on cell morphology, growth, or survival (Fig. 7A). In contrast, P19 cells in which Brg1 was depleted exhibited a more rounded morphology after 48 h (Fig. 7B). The Brg1 protein level was substantially decreased in cells transfected with Brg1-specific siRNA compared to that in nontarget control cells, as determined by Western blotting (Fig. 7E).
FIG 7.
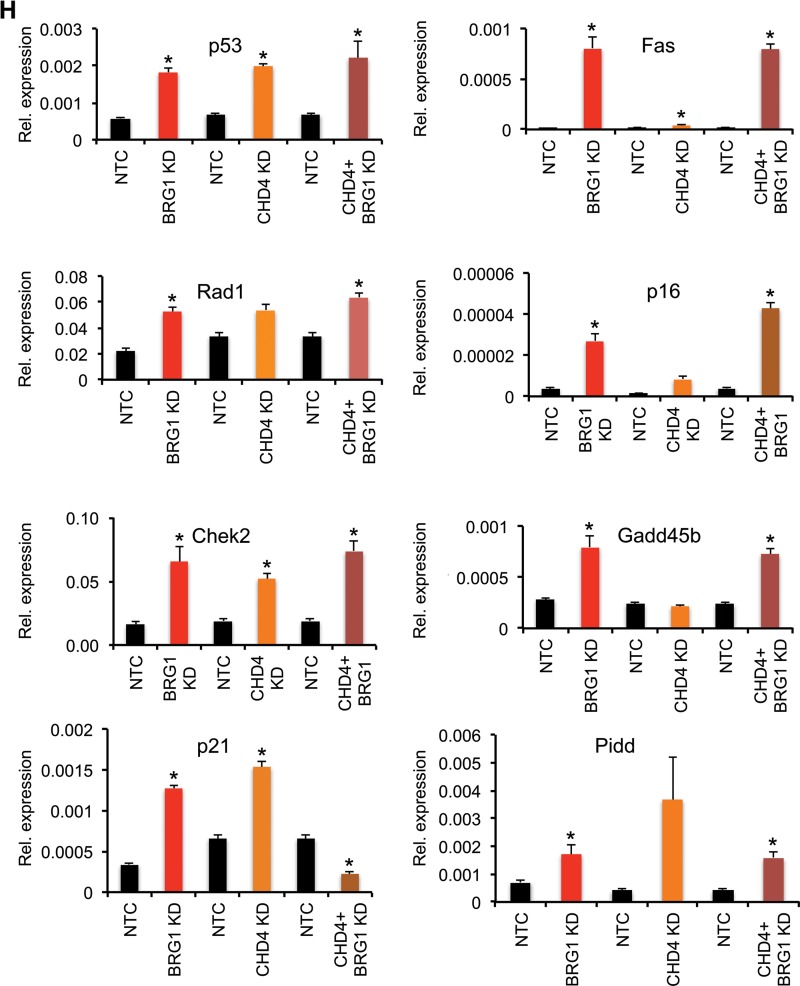
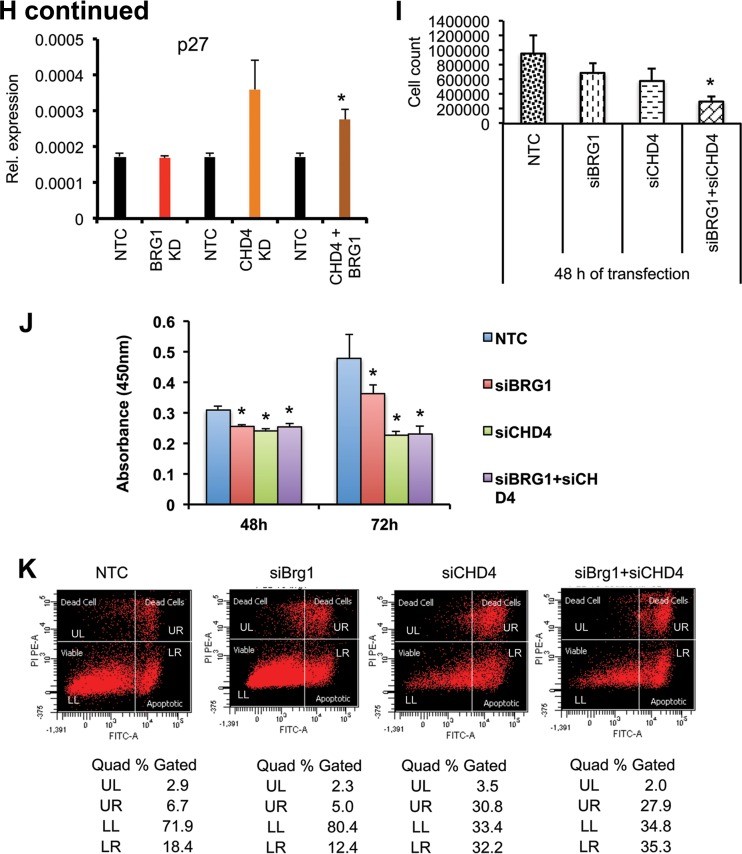
Brg1 and CHD4 knockdown results in reduced cell growth of P19 cells. (A to D) Phenotypes of P19 cells independently transfected with siRNA specific for NTC (siNTC), Brg1 (siBrg1), CHD4 (siCHD4), and both CHD4 and Brg1 (siCHD4 + siBrg1). Brg1 and CHD4 inhibition resulted in a smaller colony size compared to that for the control. (E) Western blots show the extent of protein knockdown of Brg1 and CHD4 in P19 cells. β-Actin was used as a loading control. (F) Brg1, CHD4, and HDAC1 physically interact in the developing embryo, as shown by immunoprecipitation (IP) using antibodies against Brg1, CHD4, HDAC1, and IgG in early embryonic tissue, followed by probing with antibodies against Brg1, CHD4, and HDAC1. WB, Western blotting. (G) Immunohistochemistry of CHD4 shows its expression pattern in early embryos. The arrow and high-magnification insets show CHD4-positive staining. Magnifications: E5.5, ×40; E6.5, ×40; E9.5, ×4.3 (inset, ×40); E10.5, ×3.7 (inset, ×40). (H) Cell growth inhibitor- and apoptosis-related genes are induced in Brg1- and CHD4-knockdown (KD) P19 cells. Quantitative PCR analysis of expression of mRNA of the indicated genes in P19 cells transfected with siRNA specific for the nontarget control versus siRNA specific for Brg1, CHD4, and both Brg1 and CHD4. *, statistically significant changes (P < 0.05). mRNA levels were normalized to the level of GAPDH mRNA as a control; data are expressed as the mean ± SD and represent data from three biological replicates. (I, J) Brg1 and CHD4 silencing reduces P19 cell proliferation. P19 cells were separately transfected with siRNA specific for Brg1, CHD4, both Brg1 and CHD4, or NTC. Cell growth was quantified using the CCK-8 cell viability assay. Values are the means ± SDs for biological replicates. *, P < 0.05. (K) Effects of CHD4 but not Brg1 gene silencing on P19 cell apoptosis. P19 cells were transfected with siRNA specific for NTC, Brg1, CHD4, or Brg1 and CHD4 and serum starved for 24 h, and then apoptosis was quantified by flow cytometry using annexin V-FITC-PI staining. Quad, quadrant; UL (upper left), dead cells; UR (upper right), late-phase apoptosis; LL (lower left), viable cells; LR (lower right), apoptosis.
We next evaluated the relative expression of a set of cell death and proliferation regulators in Brg1-knockdown and nontarget control P19 cells. The genes chosen for analysis in P19 cells were differentially expressed in Brg1d/d embryos. qRT-PCR analysis showed that the levels of expression of the key genes p53, Gadd45b, Pidd, Fas, Check2, Rad1, p21, and Cdkn2a (p16) were significantly increased in Brg1-depleted P19 cells relative to their levels of expression in nontarget control P19 cells (Fig. 7H). p27 expression did not change in the microarray gene expression data set or in Brg1-knockdown P19 cells, despite the fact Brg1 binding was detected at the promoter proximal region (see Fig. 10A). In contrast, knockdown of CHD4 increased the level of p27 expression in P19 cells (Fig. 7H). Consistent with previous reports, in spite of the accumulation of p53 and downstream effector genes of the p53 pathway mRNA upon Brg1 silencing in P19 cells, we did not detect either the p53 protein or proteins from p53-regulated target genes, with the exception of p16 (Fig. 8E) (27, 28). Brg1 depletion also resulted in cell counts significantly (P < 0.01) lower than those observed with control cells (Fig. 7I and J), which is consistent with Brg1 silencing reducing the cell number. Furthermore, flow cytometry analysis showed that Brg1 knockdown results in a nonsignificantly decreased number of cells in S phase and a delay in the G2/M phase compared to the findings for control cells (data not shown). Annexin V staining, as a measure of apoptosis, was not significantly different between P19 cells depleted of Brg1 and control cells (Fig. 7K). This indicates that Brg1 deficiency results in differential effects and might not be critical for P19 cell cycle regulation and apoptosis as it is in vivo.
FIG 8.
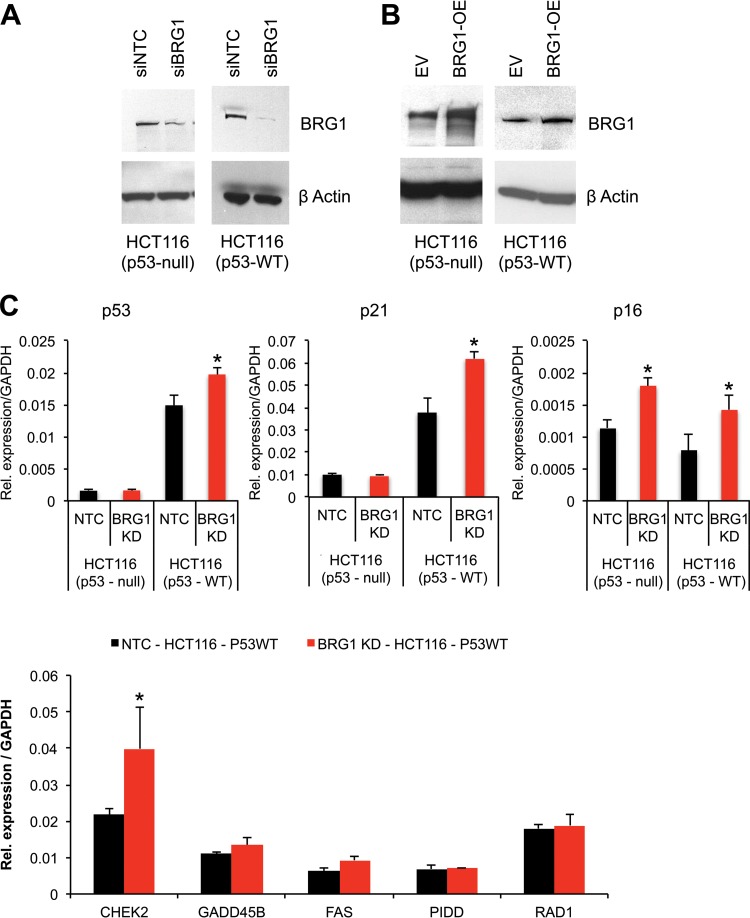
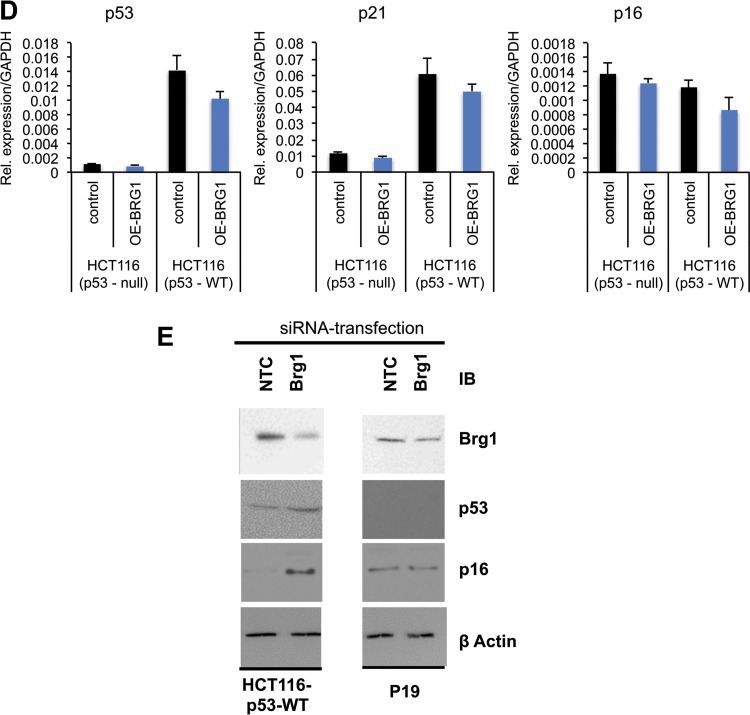
Brg1 is knocked down in HCT116 cell lines. (A, B) Western blots showing the extent of the Brg1 protein in HCT116 cell lines. OE, overexpressed; EV, empty vector. (C, D) qPCR analysis shows expression of the mRNA of the indicated genes in HCT116 cell lines (HCT116 p53-null and HCT116 p53 wild-type [WT] cells) independently transfected with siRNA specific for NTC or Brg1 or a plasmid carrying Brg1 DNA or the vector control. Brg1 mRNA levels were normalized to those of GAPDH as a control; data are expressed as the mean ± SD and represent those from three biological replicates. *, statistically significant changes (P < 0.05). (E) Images of Western blots of the indicated proteins in HCT116p53+/+ and P19 cells show protein levels upon Brg1 silencing. IB, immunoblot.
CHD4 interacts with Brg1 and represses cell death and cell proliferation-related genes.
Next, we assessed the potential functional associations of the partners interacting with Brg1 to further define the mechanism(s) by which Brg1 regulates the expression of cell death and cell survival genes. Previous mass spectrometric analyses revealed that CHD4 interacts with Brg1 in early embryos (30). As shown in Fig. 7F, the interaction of Brg1 with CHD4 and HDAC1 was confirmed in the embryos at E9.5 via reciprocal coimmunoprecipitation experiments. Furthermore, CHD4 immunostaining was strongly positive and widespread in early wild-type embryos (Fig. 7G), as was seen for Brg1 earlier. Similarly, an earlier chromatin immunoprecipitation (ChIP) sequencing study showed genome-wide overlapping binding of Brg1 and CHD4 (22). This suggests that CHD4 may work in conjunction with Brg1 to regulate gene expression in a context-dependent manner. To examine the functional similarities between CHD4 and Brg1, we knocked down the proteins independently of each other and in combination in P19 cells and then assessed cellular growth and gene expression patterns (Fig. 7A to E and H). First, CHD4 depletion in P19 cells resulted in a rounded morphology after 48 h (Fig. 7C) and proliferation significantly (P < 0.01) slower than that of nontarget control P19 cells (Fig. 7I and J), which is consistent with previous reports (31). qRT-PCR analysis of P19 cells showed that CHD4 depletion increased the levels of expression of genes such as p53, p21, Rad1, Chek2, and Pidd equivalently to that seen upon Brg1 depletion (Fig. 7H). The levels of Fas and Cdkn2a expression were also increased but to a lesser extent relative to the increase in their expression obtained with Brg1 depletion, and the level of Gadd45b expression was unchanged (Fig. 7H). Next, we analyzed if CHD4 silencing induced apoptosis in P19 cells. In contrast to what was observed with Brg1 depletion, annexin V staining indicated that CHD4 gene silencing increased the number of apoptotic cells (Fig. 7K).
To assess the potential functional coordination between Brg1 and CHD4, we simultaneously depleted both proteins in P19 cells. Cell growth was significantly (P < 0.01) reduced upon double knockdown in comparison to that of nontargeted control P19 cells (Fig. 7D, I, and J), and changes in gene expression were at levels similar to those seen with Brg1 knockdown (Fig. 7H). These results suggest that CHD4 acts like Brg1 and may repress a smaller subset of the cell proliferation- and apoptosis-related genes examined in P19 cells.
Brg1 reduction induced transcriptional activation of p21 in a p53-dependent manner.
The role of Brg1 in the transcriptional regulation of p53 targets was studied using human colon carcinoma isogenic cell lines HCT116p53+/+ and HCT116p53−/− as a model system. It is well established that a large number of genes have been shown to be activated by p53 in response to cellular stress conditions (8, 32). Therefore, Brg1 was knocked down in both HCT116p53−/− and HCT116p53+/+ cells, and we assessed whether Brg1 deficiency was sufficient for activation of the p21 gene in the HCT116 cell lines (Fig. 8A). As expected, p53 and p21 mRNA levels were unchanged in the HCT116p53−/− cells in which Brg1 was depleted. However, Brg1 knockdown in HCT116p53+/+ cells resulted in induced expression of p53, p21, and Chek2 mRNAs (Fig. 8C). Gadd45b and Fas mRNAs were slightly increased, while Pidd and Rad1 mRNA levels were comparable in Brg1-knockdown and control cells. Furthermore, the reciprocal experiment showed that transient overexpression of Brg1 only modestly reduced the levels of p53 and p21 expression in HCT116p53+/+ cells (Fig. 8B and D). In contrast, expression of the p16 (Cdkn2a) gene, which induces G2 arrest and apoptosis in a p53-independent manner, was increased both in Brg1-depleted HCT116p53−/− and in HCT116p53+/+ cells (Fig. 8C). Furthermore, we observed increased p53 and p16 mRNA expression concomitantly with elevated protein levels in HCT116p53+/+ cells (Fig. 8E).
Brg1 directly regulates genes differentially expressed in Brg1d/d embryos and shares the genomic landscape with interacting chromatin regulators.
Next, we investigated the direct role for Brg1 in the transcriptional regulation of the genes differentially expressed in Brg1d/d embryos. Several differentially expressed apoptosis and cell proliferation regulators were expressed in different cell types, including cancer cells and embryonic stem (ES) cells, in Brg1d/d embryos at E8.5 (33, 34). Therefore, we evaluated previously published Brg1 ChIP sequencing (ChIP-seq) data (3134 mouse mammary epithelial cell line, mouse ES cells) for comparison with the Brg1d/d embryo gene expression data set (22, 35). The ChIP-seq data analysis revealed a total of 10,546 peaks for Brg1 in mouse ES cells, and the number of peaks in ES cells overlapped the number of peaks in 3134 cells (4,108 and 38,896 peaks for ES and 3134 cells, respectively). Our comparative analysis of Brg1 ChIP sequencing and gene expression data revealed potential enrichment of the regulatory DNA of the DEGs in Brg1d/d embryos. We were able to identify shared Brg1 peaks in 3134 cells and ES cells within a 10-kb window around the transcription start site (TSS) for 190 and 92 DEGs, respectively, visualized by use of a heat map of the average ChIP-seq signal (Fig. 9A to C). Intriguingly, we identified 176 DEGs, which also had CHD4 peaks within the 10-kb window around the TSS. Furthermore, we identified 160 DEGs which had both Brg1 and CHD4 peaks within the 10-kb window around the TSS (Fig. 9A to C). Brg1 and CHD4 binding was also detected on 57 DEGs common in 3134 and ES cells.
We discovered that 87 DEGs had both CHD4 and Brg1 overlapping peaks within a 500-bp window and exhibited the potential for promoter proximal interactions between the Brg1 and CHD4 ChIP-seq signals in an approximately 1.5-kb window from the TSS. The results of a Wilcoxon signed-rank test on the fold change in the levels of gene expression for up- or downregulated probes indicated a significant difference, where upregulated probes that were bound by Brg1 (or CHD4) displayed a lower fold induction than upregulated probes that were not bound by Brg1 (or CHD4). Similarly, downregulated probes that were bound by Brg1 (or CHD4) showed a significantly lower level of downregulation than those that were not bound by Brg1 (Fig. 9D to G). Also, the majority of upregulated probes observed to be bound by Brg1 (n = 48) were bound by CHD4 (43/48) and displayed a lower fold induction than the upregulated probes that were unbound by either Brg1 (n = 125) or CHD4 (116/125) (Fig. 9D and F). Likewise, the downregulated probes bound by Brg1 (n = 55) and CHD4 (44/55) were significantly less downregulated than those not bound by either Brg1 (n = 190) or CHD4 (172/190) (Fig. 9E and G). This suggests that the effects of Brg1 loss may be abrogated at certain loci due to the presence of CHD4 and contribute to the pattern of differentially regulated gene expression in Brg1d/d embryos. To explore this possibility, we designed primers specific for regions upstream of the TSS, which also included predicted Brg1 binding sites, for selected target genes (Fig. 10A). Using wild-type early embryos, we confirmed the presence of Brg1 binding to DNA sequences upstream of the TSSs of p53, p21, p27, Gadd45a, and Fas in the early embryos (Fig. 10B). Brg1 binding was detected on the promoter proximal region of p27, yet p27 expression was unchanged in the Brg1d/d embryo microarray gene expression data. This suggests that Brg1 binding does not always correlate with a change in the level of gene expression. Brg1 binding to the coding region of the Lyve1 gene, which was used as a negative control, was minimal.
Mass spectrometric analyses revealed that CHD4 and HDAC1 interacted with Brg1 in early embryos (30). Further, HDAC1 has been shown to regulate the p53 function in development (36). Our analysis of the CHD4 ChIP sequencing data (3134 mouse mammary epithelial cell line) (22) showed that CHD4 enrichment on the regulatory loci of the Brg1 target genes also overlapped Brg1 binding sites (Fig. 10A). ChIP analysis of P19 cells confirmed CHD4 enrichment at the Brg1 binding loci of DEGs (Fig. 10C). Consistent with the findings of the preceding analyses, HDAC1 enrichment was also detected on the upstream DNA sequence that exhibited Brg1 and CHD4 binding of all five DEGs studied (Fig. 10D).
Brg1d/d embryos exhibit decreased histone H3K27me3 at the p21 promoter.
Next, we examined if Brg1 expression altered histone H3 lysine 4 trimethylation (H3K4me3), histone H3 lysine 9 acetylation (H3K9ac), and H3K27me3 histone marks at the p53 and p21 promoters. The H3K4me3 mark exhibited small but significant reductions on the p53 and p21 promoters in Brg1d/d embryos compared with that in Brg1fl/fl embryos, suggesting that Brg1 deficiency affected the H3K4me3 active mark on the p53 and p21 promoters during development. In contrast, H3K9ac levels exhibited a small but significant increase on the p53 promoter in Brg1d/d embryos compared with that on the p53 promoter in Brg1fl/fl embryos, while the level of the H3K9ac mark on the p21 promoter did not change significantly between the Brg1d/d and Brg1fl/fl embryos (Fig. 10E, top and middle). Likewise, the level of the H3K27me3 mark was significantly reduced on the p21 promoter in Brg1d/d embryos compared with that in Brg1fl/fl embryos and was unchanged on the p53 promoter in Brg1d/d and Brg1fl/fl embryos (Fig. 10E, bottom).
Brg1 depletion modulates the chromatin architecture of the p53 and p21 promoters.
Given the changes in gene expression observed with the Brg1 deletion, we then assessed if changes in Brg1 protein expression resulted in altered chromatin architecture at the target genes. A search of the DNase I sequencing data available in the public domain revealed DNase I-hypersensitive sites on the regulatory loci of differentially expressed genes in Brg1d/d embryos (22), which also correlated with Brg1 and CHD4 binding sites (Fig. 10A). We analyzed the DNase I hypersensitivity at the promoter regions of p53 and p21 and the coding region of Lyve1 (negative control). Depletion of Brg1 resulted in increased DNase I hypersensitivity on the p53 and p21 promoters, consistent with a relatively open chromatin structure (Fig. 10F), and the associated increased expression of the p53 and p21 genes (Fig. 6B and 7G). In contrast, Brg1 depletion did not result in DNase I hypersensitivity in the Lyve1 coding region (Fig. 10F).
DISCUSSION
This study uncovered a new role for the Brg1 complex in early development by demonstrating the specific consequences of Brg1fl/fl deletion on normal cellular processes, such as apoptosis and proliferation, during the perigastrulation period of mouse embryo development. Conventional knockout of the Brg1 gene in mice causes peri-implantation lethality (16). However, early embryonic mortality due to germ line deletion of Brg1 hindered the analysis of the global function of the gene at later developmental time points. Our study sought to bridge this gap by analyzing Brg1 expression and loss of function in the later stages by using tamoxifen-induced Brg1 inactivation in early embryos. The Brg1 protein is strongly detected and evenly distributed in the early postimplantation stage embryo, suggesting that this protein is critical beyond peri-implantation development and may control genes critical in the early developmental processes. Elimination of the Brg1flox/flox locus during gastrulation (E6.5) results in growth retardation and developmental arrest, ultimately resulting in early embryonic mortality. Intriguingly, the functions of Brm (a catalytic subunit of the SWI/SNF complex that is an alternative to Brg1) fail to compensate for the loss of the Brg1 function even at later development stages, as seen in peri-implantation development (16). In contrast, a recent study shows that Brm functionally compensates for Brg1 in vivo and that there are significant changes in the relative importance of Brg1- and Brm-catalyzed SWI/SNF complexes during the development of vascular endothelial cells (37). This suggests that the Brg1 function is indispensable beyond peri-implantation stages. However, Brg1-deficient fibroblasts showed persistence for 9 days after the induction of Brg1 loss (16), suggesting that Brg1 plays a more complex role than that of a simple, general cell viability factor. Consequently, Brg1-deficient embryos may survive to E5.5 to E6.5 due to the presence of maternal Brg1 protein in the egg. However, the loss of Brg1 in mouse eggs leads to growth arrest at the 2-cell stage (38). Since then, a later report showed that mouse embryo fibroblasts lacking both Brg1 and Brahma failed to proliferate (39). Therefore, the induction of growth arrest followed by apoptosis observed after Brg1 loss in embryos at E7.5 may result from a requirement for this protein for cell viability, as opposed to its direct regulation of growth-regulatory and apoptotic genes. These inherent difficulties in distinguishing between these two possibilities, cell survival and cell death, represent an ambiguity in determining potential roles for Brg1 in cell viability versus apoptosis.
Brg1 mutants displayed increased cell death in embryonic tissue. Subsequent global gene expression analyses revealed numerous differentially expressed genes in Brg1d/d embryos that regulate both apoptosis and cell proliferation. These results provide molecular insights into the mechanism of Brg1 gene function in embryonic development and support the hypothesis that Brg1 inactivation results in aberrant expression of cell death- and cell survival-related genes that might be a primary cause of growth retardation. It is also possible that Brg1fl/fl deletion results in widespread alterations in chromatin organization (40), which in turn would likely lead to DNA damage and the loss of genome integrity, leading to increased cell death. Mammalian cells activate complex protein networks in response to genotoxic stress; a key element of these networks is p53. Global gene expression analysis identified several DEGs involved in cell proliferation control and DNA surveillance, including p21, p53, Brca1, and Mdm2. Indeed, Brg1 inactivation in early embryos resulted in p53 protein accumulation, consistent with activated p53 signaling in Brg1d/d embryos. Growth arrest is likely associated with increased expression of p53 and Rb, known effectors of Brg1 biological activity (41). Additionally, genes related to the p53 and Rb pathways, such as Rb2/p130 and the cyclin-dependent kinase inhibitors p21cip and p27kip1, play a role in both apoptosis and cell cycle arrest (42), probably causing growth retardation in Brg1d/d embryos. Recent studies have shown that chromodomain helicase DNA binding (CHD) family enzymes CHD7 and CHD8 can bind to the p53 promoter, thereby negatively regulating p53 expression, and that loss of CHD7/8 results in p53 activation (12). Therefore, our findings further support the notion that the precise expression of p53 is crucial in early embryogenesis.
Brg1 complexes have been shown to interact with transcription factors and are thereby recruited to their site of action (43, 44). One possibility is that specialized BAF complexes provide docking sites for specific transcription factors in early development and facilitate protein-protein interactions with key regulators of cellular function (30, 45). We found that in whole early embryo lysates, Brg1 interacts with CHD4 and HDAC1, proteins that regulate p53 signaling of DNA damage repair functions (31, 36). CHD4 and HDAC1 are also required for normal S-phase progression and assembly of pericentric heterochromatin (46, 47).
Furthermore, Brg1, CHD4, and HDAC1 physically interact and likely act together in complex. Likewise, a recent study showed genome-wide overlapping occupancy of Brg1 and CHD4 on target gene loci (22). Taken together, these observations suggest that Brg1, CHD4, and HDAC1 regulate p53 target genes through the stabilization of the p53 protein and activation of p53 signaling. This supports the concept that SWI/SNF complexes coordinate with other regulators to control cell proliferation- and apoptosis-related genes during early development. Recent studies have shown that the BAF complexes might be polymorphic readers of histone modifications and suggest a more complex mechanism (48). Our findings show that Brg1 inactivation decreased the level of the repressive histone H3K27me3 mark on the p21 promoter. The change in H3K27me3 levels at the p53 and p21 promoters mirrors the changes in the levels of the repressive histone mark on the selected Brg1 target genes during development (49). A more expansive set of future studies is required to fully appreciate the status and functions of the active and repressive histone marks on the differentially expressed genes in Brg1d/d embryos. Since SWI/SNF complexes regulate gene expression by modulating the accessibility of DNA regulatory elements, it is likely that the Brg1 complex may be required to establish the chromatin structure on certain target genes to mediate the molecular mechanisms involved in the regulation of gene expression in the complex process of embryo development. We propose a vital biological role for the Brg1 complex, which is the suppression of genes that induce unwanted apoptosis during early embryogenesis, which extends beyond the previously described activities in the peri-implantation embryo. This study advances a model of the Brg1-dependent management of genes regulated by p53 signaling in the face of cell proliferation and apoptotic programs required for optimal embryonic development.
ACKNOWLEDGMENTS
We thank Harriet Kinyamu, Steven Akiyama, Mitch Eddy, and Jackson Hoffman for critical review of the manuscript. We gratefully thank the Histology and Immunohistochemistry Core Facility, including Ronald Herbert and Natasha Clayton; Eli Ney of the Imaging Core Facility; the Molecular Genomics Core Facility, including Kevin Gerrish; and the Flow Cytometry Facility. We thank Katrina Loper for excellent service in the maintenance of the mouse colonies.
The Intramural Research Program of the NIH, National Institute of Environmental Health Sciences, supported this research (project Z01 ES071006-15 to T.K.A.).
We specify no conflict of interest.
REFERENCES
- 1.Snow MH, Bennett D. 1978. Gastrulation in the mouse: assessment of cell populations in the epiblast of tw18/tw18 embryos. J Embryol Exp Morphol 47:39–52. [PubMed] [Google Scholar]
- 2.Meier P, Finch A, Evan G. 2000. Apoptosis in development. Nature 407:796–801. doi: 10.1038/35037734. [DOI] [PubMed] [Google Scholar]
- 3.Hipfner DR, Cohen SM. 2004. Connecting proliferation and apoptosis in development and disease. Nat Rev Mol Cell Biol 5:805–815. doi: 10.1038/nrm1491. [DOI] [PubMed] [Google Scholar]
- 4.Aylon Y, Oren M. 2007. Living with p53, dying of p53. Cell 130:597–600. doi: 10.1016/j.cell.2007.08.005. [DOI] [PubMed] [Google Scholar]
- 5.Vousden KH. 2002. Activation of the p53 tumor suppressor protein. Biochim Biophys Acta 1602:47–59. [DOI] [PubMed] [Google Scholar]
- 6.Harris SL, Levine AJ. 2005. The p53 pathway: positive and negative feedback loops. Oncogene 24:2899–2908. doi: 10.1038/sj.onc.1208615. [DOI] [PubMed] [Google Scholar]
- 7.Vogelstein B, Lane D, Levine AJ. 2000. Surfing the p53 network. Nature 408:307–310. doi: 10.1038/35042675. [DOI] [PubMed] [Google Scholar]
- 8.Laptenko O, Prives C. 2006. Transcriptional regulation by p53: one protein, many possibilities. Cell Death Differ 13:951–961. doi: 10.1038/sj.cdd.4401916. [DOI] [PubMed] [Google Scholar]
- 9.Toledo F, Wahl GM. 2006. Regulating the p53 pathway: in vitro hypotheses, in vivo veritas. Nat Rev Cancer 6:909–923. doi: 10.1038/nrc2012. [DOI] [PubMed] [Google Scholar]
- 10.Lavin MF, Gueven N. 2006. The complexity of p53 stabilization and activation. Cell Death Differ 13:941–950. doi: 10.1038/sj.cdd.4401925. [DOI] [PubMed] [Google Scholar]
- 11.Zhang Y, Xiong Y. 2001. Control of p53 ubiquitination and nuclear export by MDM2 and ARF. Cell Growth Differ 12:175–186. [PubMed] [Google Scholar]
- 12.Nishiyama M, Oshikawa K, Tsukada Y, Nakagawa T, Iemura S, Natsume T, Fan Y, Kikuchi A, Skoultchi AI, Nakayama KI. 2009. CHD8 suppresses p53-mediated apoptosis through histone H1 recruitment during early embryogenesis. Nat Cell Biol 11:172–182. doi: 10.1038/ncb1831. [DOI] [PMC free article] [PubMed] [Google Scholar]
- 13.Tanaka T, Ohkubo S, Tatsuno I, Prives C. 2007. hCAS/CSE1L associates with chromatin and regulates expression of select p53 target genes. Cell 130:638–650. doi: 10.1016/j.cell.2007.08.001. [DOI] [PubMed] [Google Scholar]
- 14.Das S, Raj L, Zhao B, Kimura Y, Bernstein A, Aaronson SA, Lee SW. 2007. Hzf determines cell survival upon genotoxic stress by modulating p53 transactivation. Cell 130:624–637. doi: 10.1016/j.cell.2007.06.013. [DOI] [PMC free article] [PubMed] [Google Scholar]
- 15.Lee D, Kim JW, Seo T, Hwang SG, Choi EJ, Choe J. 2002. SWI/SNF complex interacts with tumor suppressor p53 and is necessary for the activation of p53-mediated transcription. J Biol Chem 277:22330–22337. doi: 10.1074/jbc.M111987200. [DOI] [PubMed] [Google Scholar]
- 16.Bultman S, Gebuhr T, Yee D, La Mantia C, Nicholson J, Gilliam A, Randazzo F, Metzger D, Chambon P, Crabtree G, Magnuson T. 2000. A Brg1 null mutation in the mouse reveals functional differences among mammalian SWI/SNF complexes. Mol Cell 6:1287–1295. doi: 10.1016/S1097-2765(00)00127-1. [DOI] [PubMed] [Google Scholar]
- 17.de la Serna IL, Ohkawa Y, Imbalzano AN. 2006. Chromatin remodelling in mammalian differentiation: lessons from ATP-dependent remodellers. Nat Rev Genet 7:461–473. doi: 10.1038/nrg1882. [DOI] [PubMed] [Google Scholar]
- 18.Hang CT, Yang J, Han P, Cheng HL, Shang C, Ashley E, Zhou B, Chang CP. 2010. Chromatin regulation by Brg1 underlies heart muscle development and disease. Nature 466:62–67. doi: 10.1038/nature09130. [DOI] [PMC free article] [PubMed] [Google Scholar]
- 19.Kishigami S, Komatsu Y, Takeda H, Nomura-Kitabayashi A, Yamauchi Y, Abe K, Yamamura K, Mishina Y. 2006. Optimized beta-galactosidase staining method for simultaneous detection of endogenous gene expression in early mouse embryos. Genesis 44:57–65. doi: 10.1002/gene.20186. [DOI] [PubMed] [Google Scholar]
- 20.Sumi-Ichinose C, Ichinose H, Metzger D, Chambon P. 1997. SNF2beta-BRG1 is essential for the viability of F9 murine embryonal carcinoma cells. Mol Cell Biol 17:5976–5986. doi: 10.1128/MCB.17.10.5976. [DOI] [PMC free article] [PubMed] [Google Scholar]
- 21.Indra AK, Dupe V, Bornert JM, Messaddeq N, Yaniv M, Mark M, Chambon P, Metzger D. 2005. Temporally controlled targeted somatic mutagenesis in embryonic surface ectoderm and fetal epidermal keratinocytes unveils two distinct developmental functions of BRG1 in limb morphogenesis and skin barrier formation. Development 132:4533–4544. doi: 10.1242/dev.02019. [DOI] [PubMed] [Google Scholar]
- 22.Morris SA, Baek S, Sung MH, John S, Wiench M, Johnson TA, Schiltz RL, Hager GL. 2014. Overlapping chromatin-remodeling systems collaborate genome wide at dynamic chromatin transitions. Nat Struct Mol Biol 21:73–81. doi: 10.1038/nsmb.2718. [DOI] [PMC free article] [PubMed] [Google Scholar]
- 23.Burch JB, Weintraub H. 1983. Temporal order of chromatin structural changes associated with activation of the major chicken vitellogenin gene. Cell 33:65–76. doi: 10.1016/0092-8674(83)90335-5. [DOI] [PubMed] [Google Scholar]
- 24.Nishikawa R, Matsutani M. 1998. Immunohistochemical analysis of p53 and p21(WAF1/Cip1) expression in primary intracranial germ cell tumors. Neurosurg Focus 5:e2. [DOI] [PubMed] [Google Scholar]
- 25.Schmid P, Lorenz A, Hameister H, Montenarh M. 1991. Expression of p53 during mouse embryogenesis. Development 113:857–865. [DOI] [PubMed] [Google Scholar]
- 26.McBurney MW. 1993. P19 embryonal carcinoma cells. Int J Dev Biol 37:135–140. [PubMed] [Google Scholar]
- 27.Malashicheva AB, Kislyakova TV, Aksenov ND, Osipov KA, Pospelov VA. 2000. F9 embryonal carcinoma cells fail to stop at G1/S boundary of the cell cycle after gamma-irradiation due to p21WAF1/CIP1 degradation. Oncogene 19:3858–3865. doi: 10.1038/sj.onc.1203736. [DOI] [PubMed] [Google Scholar]
- 28.Lutzker SG, Mathew R, Taller DR. 2001. A p53 dose-response relationship for sensitivity to DNA damage in isogenic teratocarcinoma cells. Oncogene 20:2982–2986. doi: 10.1038/sj.onc.1204394. [DOI] [PubMed] [Google Scholar]
- 29.Trotter KW, King HA, Archer TK. 2015. Glucocorticoid receptor transcriptional activation via the BRG1-dependent recruitment of TOP2β and Ku70/86. Mol Cell Biol 35:2799–2817. doi: 10.1128/MCB.00230-15. [DOI] [PMC free article] [PubMed] [Google Scholar]
- 30.Singh AP, Archer TK. 2014. Analysis of the SWI/SNF chromatin-remodeling complex during early heart development and BAF250a repression cardiac gene transcription during P19 cell differentiation. Nucleic Acids Res 42:2958–2975. doi: 10.1093/nar/gkt1232. [DOI] [PMC free article] [PubMed] [Google Scholar]
- 31.Smeenk G, Wiegant WW, Vrolijk H, Solari AP, Pastink A, van Attikum H. 2010. The NuRD chromatin-remodeling complex regulates signaling and repair of DNA damage. J Cell Biol 190:741–749. doi: 10.1083/jcb.201001048. [DOI] [PMC free article] [PubMed] [Google Scholar]
- 32.Akdemir KC, Jain AK, Allton K, Aronow B, Xu X, Cooney AJ, Li W, Barton MC. 2014. Genome-wide profiling reveals stimulus-specific functions of p53 during differentiation and DNA damage of human embryonic stem cells. Nucleic Acids Res 42:205–223. doi: 10.1093/nar/gkt866. [DOI] [PMC free article] [PubMed] [Google Scholar]
- 33.Kadoch C, Hargreaves DC, Hodges C, Elias L, Ho L, Ranish J, Crabtree GR. 2013. Proteomic and bioinformatic analysis of mammalian SWI/SNF complexes identifies extensive roles in human malignancy. Nat Genet 45:592–601. doi: 10.1038/ng.2628. [DOI] [PMC free article] [PubMed] [Google Scholar]
- 34.Li M, He Y, Dubois W, Wu X, Shi J, Huang J. 2012. Distinct regulatory mechanisms and functions for p53-activated and p53-repressed DNA damage response genes in embryonic stem cells. Mol Cell 46:30–42. doi: 10.1016/j.molcel.2012.01.020. [DOI] [PMC free article] [PubMed] [Google Scholar]
- 35.Ho L, Jothi R, Ronan JL, Cui K, Zhao K, Crabtree GR. 2009. An embryonic stem cell chromatin remodeling complex, esBAF, is an essential component of the core pluripotency transcriptional network. Proc Natl Acad Sci U S A 106:5187–5191. doi: 10.1073/pnas.0812888106. [DOI] [PMC free article] [PubMed] [Google Scholar]
- 36.LeBoeuf M, Terrell A, Trivedi S, Sinha S, Epstein JA, Olson EN, Morrisey EE, Millar SE. 2010. Hdac1 and Hdac2 act redundantly to control p63 and p53 functions in epidermal progenitor cells. Dev Cell 19:807–818. doi: 10.1016/j.devcel.2010.10.015. [DOI] [PMC free article] [PubMed] [Google Scholar]
- 37.Willis MS, Homeister JW, Rosson GB, Annayev Y, Holley D, Holly SP, Madden VJ, Godfrey V, Parise LV, Bultman SJ. 2012. Functional redundancy of SWI/SNF catalytic subunits in maintaining vascular endothelial cells in the adult heart. Circ Res 111:e111–e122. doi: 10.1161/CIRCRESAHA.112.265587. [DOI] [PMC free article] [PubMed] [Google Scholar]
- 38.Bultman SJ, Gebuhr TC, Pan H, Svoboda P, Schultz RM, Magnuson T. 2006. Maternal BRG1 regulates zygotic genome activation in the mouse. Genes Dev 20:1744–1754. doi: 10.1101/gad.1435106. [DOI] [PMC free article] [PubMed] [Google Scholar]
- 39.Wang X, Sansam CG, Thom CS, Metzger D, Evans JA, Nguyen PT, Roberts CW. 2009. Oncogenesis caused by loss of the SNF5 tumor suppressor is dependent on activity of BRG1, the ATPase of the SWI/SNF chromatin remodeling complex. Cancer Res 69:8094–8101. doi: 10.1158/0008-5472.CAN-09-0733. [DOI] [PMC free article] [PubMed] [Google Scholar]
- 40.Orvis T, Hepperla A, Walter V, Song S, Simon J, Parker J, Wilkerson MD, Desai N, Major MB, Hayes DN, Davis IJ, Weissman B. 2014. BRG1/SMARCA4 inactivation promotes non-small cell lung cancer aggressiveness by altering chromatin organization. Cancer Res 74:6486–6498. doi: 10.1158/0008-5472.CAN-14-0061. [DOI] [PMC free article] [PubMed] [Google Scholar]
- 41.Kang H, Cui K, Zhao K. 2004. BRG1 controls the activity of the retinoblastoma protein via regulation of p21CIP1/WAF1/SDI. Mol Cell Biol 24:1188–1199. doi: 10.1128/MCB.24.3.1188-1199.2004. [DOI] [PMC free article] [PubMed] [Google Scholar]
- 42.Galderisi U, Jori FP, Giordano A. 2003. Cell cycle regulation and neural differentiation. Oncogene 22:5208–5219. doi: 10.1038/sj.onc.1206558. [DOI] [PubMed] [Google Scholar]
- 43.Simone C. 2006. SWI/SNF: the crossroads where extracellular signaling pathways meet chromatin. J Cell Physiol 207:309–314. doi: 10.1002/jcp.20514. [DOI] [PubMed] [Google Scholar]
- 44.Liu K, Luo Y, Lin FT, Lin WC. 2004. TopBP1 recruits Brg1/Brm to repress E2F1-induced apoptosis, a novel pRb-independent and E2F1-specific control for cell survival. Genes Dev 18:673–686. doi: 10.1101/gad.1180204. [DOI] [PMC free article] [PubMed] [Google Scholar]
- 45.Trotter KW, Archer TK. 2008. The BRG1 transcriptional coregulator. Nucl Recept Signal 6:e004. doi: 10.1621/nrs.06004. [DOI] [PMC free article] [PubMed] [Google Scholar]
- 46.Larsen DH, Poinsignon C, Gudjonsson T, Dinant C, Payne MR, Hari FJ, Rendtlew Danielsen JM, Menard P, Sand JC, Stucki M, Lukas C, Bartek J, Andersen JS, Lukas J. 2010. The chromatin-remodeling factor CHD4 coordinates signaling and repair after DNA damage. J Cell Biol 190:731–740. doi: 10.1083/jcb.200912135. [DOI] [PMC free article] [PubMed] [Google Scholar]
- 47.Sims JK, Wade PA. 2011. Mi-2/NuRD complex function is required for normal S phase progression and assembly of pericentric heterochromatin. Mol Biol Cell 22:3094–3102. doi: 10.1091/mbc.E11-03-0258. [DOI] [PMC free article] [PubMed] [Google Scholar]
- 48.Moriniere J, Rousseaux S, Steuerwald U, Soler-Lopez M, Curtet S, Vitte AL, Govin J, Gaucher J, Sadoul K, Hart DJ, Krijgsveld J, Khochbin S, Muller CW, Petosa C. 2009. Cooperative binding of two acetylation marks on a histone tail by a single bromodomain. Nature 461:664–668. doi: 10.1038/nature08397. [DOI] [PubMed] [Google Scholar]
- 49.Lee S, Lee JW, Lee SK. 2012. UTX, a histone H3-lysine 27 demethylase, acts as a critical switch to activate the cardiac developmental program. Dev Cell 22:25–37. doi: 10.1016/j.devcel.2011.11.009. [DOI] [PMC free article] [PubMed] [Google Scholar]


