Abstract
Brown adipose tissue (BAT) plays a unique role in regulating whole-body energy homeostasis by dissipating energy through thermogenic uncoupling. Berardinelli-Seip congenital lipodystrophy (BSCL) type 2 (BSCL2; also known as seipin) is a lipodystrophy-associated endoplasmic reticulum membrane protein essential for white adipocyte differentiation. Whether BSCL2 directly participates in brown adipocyte differentiation, development, and function, however, is unknown. We show that BSCL2 expression is increased during brown adipocyte differentiation. Its deletion does not impair the classic brown adipogenic program but rather induces premature activation of differentiating brown adipocytes through cyclic AMP (cAMP)/protein kinase A (PKA)-mediated lipolysis and fatty acid and glucose oxidation, as well as uncoupling. cAMP/PKA signaling is physiologically activated during neonatal BAT development in wild-type mice and greatly potentiated in mice with genetic deletion of Bscl2 in brown progenitor cells, leading to reduced BAT mass and lipid content during neonatal brown fat formation. However, prolonged overactivation of cAMP/PKA signaling during BAT development ultimately causes apoptosis of brown adipocytes through inflammation, resulting in BAT atrophy and increased overall adiposity in adult mice. These findings reveal a key cell-autonomous role for BSCL2 in controlling BAT mass/activity and provide novel insights into therapeutic strategies targeting cAMP/PKA signaling to regulate brown adipocyte function, viability, and metabolic homeostasis.
INTRODUCTION
Adipose tissues play a key role in endocrine function, obesity, and metabolic disease. White adipocytes store excess energy in the form of triglycerides (TG), whereas brown adipocytes metabolize lipid and glucose to produce heat through uncoupling, which contributes to systemic energy homeostasis and thermoregulation (1, 2). Functional brown adipose tissue (BAT) is inversely correlated with body mass index (BMI) in adult humans (3, 4) and is either reduced or absent in obese and aged humans (5, 6) and rodents (7, 8). Thus, interventions to increase BAT mass/activity could potentially promote adaptive energy expenditure to combat obesity (9, 10).
In rodents, BAT is primarily concentrated in the interscapular region and forms during embryonic development, prior to other fat depots. It becomes clearly recognizable on or after day 15.5 of embryonic development (E15.5) and then rapidly develops and matures by 5 days after birth (11). Both brown and white adipocytes arise from progenitor cells of the embryonic mesoderm and express a common repertoire of key adipogenic genes, including peroxisome-proliferator-activated receptor gamma (PPARγ) and C/EBPs (CCAAT/enhancer-binding proteins; specifically CEBPβ/α/δ) (12). However, classical brown adipocytes are derived from distinct myogenic lineage progenitors that express the myogenic markers Pax7 and Myf5 (13). The nuclear coactivator PGC1α (PPARγ coactivator 1α) and the transcription factor PRDM16 (PR-domain-containing 16) regulate the brown specific adipogenic program by activating genes controlling mitochondrial biogenesis and expression of essential thermogenic inducers, such as uncoupling protein 1 (UCP1) (14).
Berardinelli-Seip congenital lipodystrophy 2 (BSCL2; also known as seipin) is an endoplasmic reticulum (ER) membrane protein highly expressed in testis, brain, and adipose tissues (15–18). Mutations in BSCL2 have been associated BSCL2 disease (16). Global Bscl2-deficient (Bscl2−/−) mice and rats recapitulate human BSCL2 disease, exhibiting congenital lipodystrophy accompanied by severe insulin resistance (19–22). Adipose tissue-specific deletion of Bscl2 in mice also leads to progressive fat loss (23). BSCL2 appears to play complex roles in lipid metabolism. Lack of BSCL2 or its orthologs has been demonstrated to regulate lipid droplet (LD) size and morphology (24–27). In the Drosophila fat body, the product of dSeipin (the ortholog of human BSCL2) was shown to bind sarco/endoplasmic reticulum Ca2+-ATPase (SERCA) to regulate ER calcium signaling and lipid storage (28). When overexpressed in cells, human BSCL2 physically associates with two important enzymes of triglyceride synthesis, 1-acylglycerol-3-phosphate O-acyltransferase 2 (AGPAT2) and the phosphatidic acid phosphatase LIPIN1 (29, 30).
Activation of cyclic AMP (cAMP)/protein kinase A (PKA) and subsequent phosphorylation of cAMP response element binding protein (CREB) are required to initiate adipocyte differentiation (31). However, chronic activation of cAMP/PKA, through either adrenergic signaling or forskolin, impedes white adipogenesis (32, 33). Bscl2-deficient white preadipocytes fail to differentiate into white adipocytes due to unbridled cAMP/PKA signaling, causing lipodystrophy (19, 21). Notably, deletion of Bscl2 in mature adipose tissues of adult animals also activates cAMP/PKA signaling and induces browning, fat loss, and obesity resistance (34). cAMP/PKA signaling is required for sympathetic nervous system (SNS)-induced BAT thermogenesis through norepinephrine-stimulated β-adrenergic receptors (AR) (1), but whether this signaling pathway is involved in brown adipogenesis and perinatal BAT development is unclear. Rodent BAT expresses abundant BSCL2 (15), and Bscl2−/− mice and rats exhibit reduced BAT mass (19–22). However, Bscl2−/− rats maintain normal thermoregulation (22). Adipose tissue-specific deletion of Bscl2 in mice also resulted in reduced BAT mass, but these mice exhibited acute cold intolerance under fasting conditions (23). Thus, the role of BSCL2 in regulating brown adipocyte development and function remains unclear.
We therefore investigated the physiological function of BSCL2 in brown adipogenesis and development. Here, we for the first time reveal a novel role of BSCL2 in controlling BAT differentiation by regulating cAMP/PKA-mediated lipolysis and mitochondrial respiration, independent of the canonical BAT transcriptional program. We further provide evidence that prolonged activation of differentiating brown adipocytes by cAMP/PKA signaling could result in brown adipocyte death and BAT atrophy, accompanied by increased overall adiposity.
MATERIALS AND METHODS
Animal experiments.
C57BL/6 mice were obtained from Jackson Laboratory. Global Bscl2−/− mice (backcrossed five times to a C57BL/6 background) were previously generated in the lab (19). Myf5-BKO mice were obtained by breeding Bscl2f/f mice (19) with transgenic mice expressing Myf5-driven Cre recombinase (Jackson Laboratory). Mice were maintained under standard conditions with controlled 12-h/12-h light-dark cycle and 21 ± 1°C room temperature. For studies in fetuses and neonates, interscapular BAT was carefully dissected under microscopy as previously described (35). Samples from two or three pups were pooled for each experimental condition for mRNA and protein analyses. At least three different litters were analyzed for each developmental age. Male adult animals were used unless stated otherwise. All animal experiments were done using protocols approved by the IACUC at Augusta University.
Fat and lean masses were measured using a Bruker small-animal nuclear magnetic resonance system (Bruker Minispec LF90II). Indirect calorimetry, food intake, and locomotor activity were determined using a comprehensive laboratory animal monitoring system (Columbus Instruments, Columbus, OH) for 4 days (2 days of acclimation, followed by 2 days of measurement) according to the manufacturer's protocols. All measurements were expressed as per mouse. Thermal imaging of skin surface temperature in neonatal mice was performed using a thermal imaging camera (T100 InfraRed camera; FLIR Systems) as previously described (36). For thermoneutrality experiments, mice were housed at 30°C in the environmental chamber under standard conditions. Cold acclimation was tested in mice housed individually at 4 ± 1°C in the environmental chamber with controlled 12-h/12-h light-dark cycle in the presence of food. Rectal body temperatures were measured by a BAT-12 thermometer (Physitemp). Serum creatine kinase activity was measured by a creatine kinase activity colorimetric assay kit (K777-100; BioVision, Inc., Milpitas, CA) according to standard instructions.
Primary brown adipocyte and preadipocyte isolation and immortalization.
Primary brown adipocytes and preadipocytes were isolated from interscapular BAT pads of 8-week-old mice, as described previously (37). Briefly, tissues were digested by type IV collagenase in the presence of 4% bovine serum albumin (BSA) at 37°C for 30 min. The suspension was filtered and centrifuged, and the floating layer (containing adipocytes) and pellet (containing the stromal vascular fraction [SVF]) were collected for RNA analysis or resuspended and plated. Preadipocytes in the SVF were then passaged once prior to adipogenic differentiation. Immortalized cell lines were generated as described previously (38, 39). In brief, interscapular BAT from individual newborn pups (postnatal days 1 to 2) of Bscl2+/+ and Bscl2−/− mice were collected, and preadipocytes were isolated by enzymatic digestion. Immortalization of isolated primary preadipocytes was performed using retroviral SV-40 large T antigen transduction, followed by selection with 2 μg of puromycin/ml. Cells were then subjected to culture and differentiation into mature brown adipocytes based on a standard protocol (38, 39). The day before the addition of induction medium was termed day 0 (D0). Brown adipocytes became fully mature by day 8.
Tissue and intracellular TG analyses, Oil Red O staining, and quantification.
Tissues were homogenized in standard phosphate-buffered saline (PBS). Lipids were extracted according to the method of Bligh and Dyer (40) and dissolved in chloroform. A small aliquot (5 to 30 μl) was removed and dried. Cultured cells were directly lysed in 1% Triton X-100 in PBS. The TG concentration in the aliquots was determined by using a triacylglyceride assay kit (Thermo Fisher) and normalized to the tissue weights or total cellular protein levels (41). Oil Red O staining was performed as described previously (15). Stained Oil Red O dye was eluted by using 100% isopropanol and incubation for 10 min with gentle shaking. The eluted solution was measured at an optical density at 500 nm for quantification.
Cellular respiration.
Cellular metabolic rates were measured using a XF24 cellular analyzer (Seahorse Bioscience, Billerica, MA) as previously described (42). Immediately before the measurement, D6 to D7 brown adipocytes were washed with unbuffered Dulbecco modified Eagle medium (DMEM). Oxygen consumption rates (OCR) were measured using XF Mitostress test kit with 0.75 μM oligomycin, 0.5 μM FCCP [carbonyl cyanide 4-(trifluoromethoxy)phenylhydrazone], and 0.75 μM rotenone/antimycin successively added. Extracellular acidification rates (ECAR) were measured using an XF Glycostress test kit with 25 mM glucose, 0.75 μM oligomycin, and 200 mM 2-deoxyglucose injected. Mixing, waiting, and measurement times were 3, 2, and 3 min for brown adipocytes. For measurements of metabolism in primary brown fat, tissues were collected and finely minced in PBS. Pieces of tissue of similar size (∼5 mg) were placed in the bottom of a Seahorse islet capture microplate and kept in place with the screen provided with the kit. The tissues were extensively washed with unbuffered Krebs-Henseleit buffer (KHB) containing 111 mM NaCl, 4.7 mM KCl, 2 mM MgSO4, 1.2 mM Na2HPO4, 0.5 mM carnitine, 2.5 mM glucose, and 10 mM sodium pyruvate before the measurement of the basal OCR in 450 μl of KHB for 30 min was initiated. Each reported OCR value represents an average of five mice with two independent pieces of BAT per mouse. Of note, Myf5-BKO mice only contain approximately 10 mg of BAT, which limits the number of repetitions performed per animal. Data were normalized by tissue weight for neonatal mice. For aged mice, we normalized data to tissue DNA content as previously described (43).
Nuclear and mitochondrial DNA content analysis.
Total DNA was isolated from cells or BAT by phenol-chloroform/isoamyl alcohol extraction and treated with RNase A (Invitrogen). Mitochondrial and nuclear DNA were amplified by reverse transcription-PCR (RT-PCR) with 1 ng of DNA and primers against mitochondrial 16S rRNA and nuclear specific hexokinase 2 gene intron 9, respectively, as described previously (44), to calculate the relative quantification of mtDNA copy number per nuclear DNA. MitoTracker red (MitoTracker Deep Red FM; Life Technologies) staining was applied to live cells at 37°C for 30 min before fixation to stain functional mitochondria, according to the manufacturer's protocol.
Histology, immunohistochemistry, and immunofluorescence microscopy.
Tissues were fixed with neutral buffered formalin and embedded in paraffin. Sections (7 μm) were stained with hematoxylin and eosin (H&E). For Mac2 immunohistochemistry, paraffin-embedded sections were incubated with purified anti-mouse/human Mac-2 (catalog no. 125401; BioLegend), followed by detection using the ABC Vectastain Elite kit (Vector Laboratories) according to the manufacturer's instructions.
Lipolysis.
Lipolysis in cultured brown adipocytes was performed as previously described (19). Briefly, cells were washed with DMEM twice and incubated with DMEM high glucose with 2% fatty-acid free BSA for 2 h at 37°C with occasional shaking. The released glycerol and release of nonesterified fatty acid (NEFA) levels were determined using a free glycerol reagent (Sigma-Aldrich) and Wako NEFA analysis kit (NEFA-HR [2]; Wako Pure Chemical Industries), respectively. Data were normalized to the total protein content.
FAO.
For fatty acid oxidation (FAO), D6 brown adipocytes were incubated with 800 μl of Krebs-Ringer bicarbonate–HEPES (KRBH) plus 2% BSA buffer and 5.5 mM glucose, 300 μM palmitic acid, and a final concentration of 0.4 μCi of [1-14C]palmitic acid (Perkin-Elmer Life Sciences)/ml in six-well culture plates with hydroamine-soaked filter paper fixed on the lid, followed by incubation at 37°C for 2 h. Then, 500 μl of 1 M perchloric acid was injected to release the 14CO2, followed by further incubation at 37°C for 1 h. The 14CO2 released was measured by scintillation counting of the filter paper. FAO using BAT homogenates was assayed as previously detailed (34, 45).
RT and real-time quantitative PCR.
Total RNA was isolated from tissues or cells with TRIzol (Invitrogen) and reverse transcribed using MLV-V reverse transcriptase with random primers (Invitrogen). Real-time quantitative RT-PCR was performed on a Stratagene MX3005. Data were normalized to two housekeeping genes (the Ppia and 36B4 genes for white fat, liver, and BAT; the β-actin and 36B4 genes for skeletal muscle) based on Genorm algorithm and expressed as fold changes relative to control cells or tissues.
Immunoblot analysis.
Tissues and cells were homogenized and lysed in lysis buffer as previously described (34). The protein concentration was determined by BCA protein assay (Bio-Rad). Equal amounts of proteins were loaded and immunoblot analysis was carried out according to standard protocol. The following antibodies were used: rabbit polyclonal antisera against Bscl2 (34); rabbit antibodies against phospho-PKA substrate (catalog no. 9624), hormone-sensitive lipase (HSL; catalog no. 4107S), phospho-HSL(Ser563) (catalog no. 4139S), and cleaved caspase 3 (catalog no. 9661S) from Cell Signaling Technology; GAPDH (MAb374; Fisher Scientific), PLIN1 (catalog no. GP29; Progen Biotechnik GmbH); ATGL (catalog no. 10006409; Caymen Chemicals); PLIN2 (46); PPARγ (catalog no. MAB3872; Millipore); aP2 (catalog no. ab66682; Abcam); and UCP1 (catalog no. AB1426; Millipore).
Statistical analysis.
Quantitative data are presented as means ± the standard errors of the mean. Differences between groups were examined for statistical significance with two-tailed Student t test or by two-way analysis of variance (ANOVA) using SigmaPlot software. A P value of <0.05 was considered statistically significant.
RESULTS
Upregulation of BSCL2 expression during brown adipogenesis and neonatal BAT development.
BSCL2 is upregulated during white adipocyte differentiation (15). We first examined whether its expression level is also regulated during brown adipogenesis in primary preadipocytes isolated from postnatal C57BL/6 BAT, in conjunction with upregulated expression of Ucp1, a brown adipocyte marker that mediates BAT heat production. A 13-fold increase in Bscl2 mRNA was detected on day 2 (D2) after the addition of induction media; its expression increased >30-fold and peaked at D4 before progressively decreasing when brown adipocytes became fully mature by D8 (Fig. 1A). Notably, the increase in Bscl2 mRNA preceded the induction of Ucp1, which peaked in mature D8 brown adipocytes. Western blotting confirmed the time-dependent upregulation of BSCL2 and UCP1 protein levels (Fig. 1B). Bscl2 and Ucp1 mRNA expression was also markedly enriched in mature brown adipocytes (BA) relative to the SVF of BAT (Fig. 1C). In vivo, Bscl2 mRNA was expressed at E16.5, when intact BAT is first recognizable (11). The level of Bscl2 progressively increased in the late fetal period (E18.5) and continued to arise at birth (postnatal day 0 [P0]). Its expression peaked at P2, followed by a slight reduction at P5 when BAT became fully mature (Fig. 1D, left panel). In line with a previous report (35), the expression of Ucp1 mRNA was initiated in late fetal life (E18.5) and followed the same kinetic pattern as Bscl2 postnatally (Fig. 1D, right panel). These data highlight that BSCL2 expression is upregulated during brown fat adipogenesis in vitro and in vivo.
FIG 1.
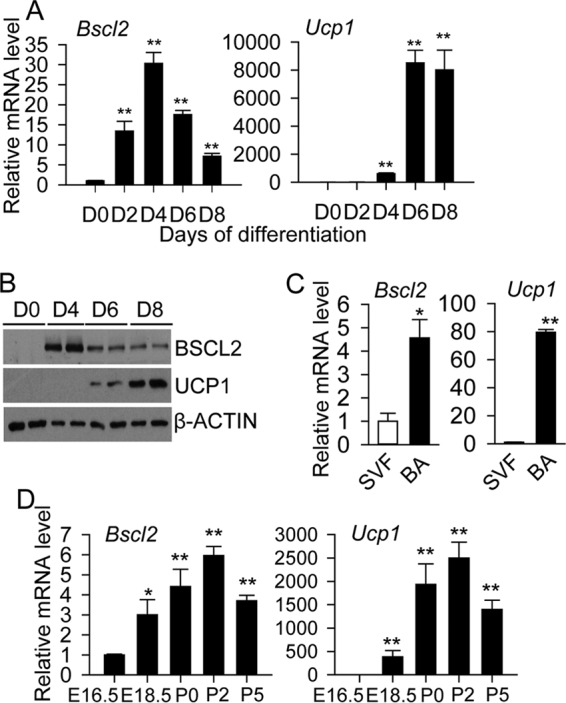
BSCL2 is upregulated during brown adipocyte differentiation and development. (A and B) Time course of Bscl2 and Ucp1 mRNA (A) and protein (B) expression during induced brown adipogenesis in primary brown preadipocytes. **, P < 0.005 versus day 0 (D0). (C) mRNA expression of Bscl2 and Ucp1 in isolated stromal vascular fractions (SVF) and mature brown adipocytes (BA) from BAT of male C57BL/6 mice (n = 6). (D) Embryonic and postnatal expression of Bscl2 and Ucp1 during BAT development beginning at E16.5 in C57BL/6 mice. Data points were derived from combined BAT from two to three pups and repeated with three independent litters. *, P < 0.05; **, P < 0.005 versus E16.5.
Ablation of BSCL2 promotes UCP1 expression during brown adipocyte differentiation in vitro.
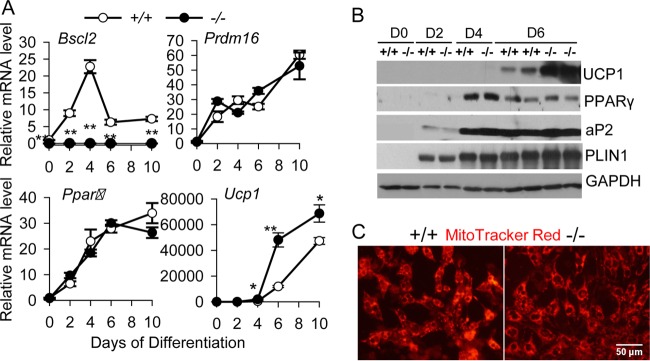
We next explored whether BSCL2 directly participates in brown adipogenesis and metabolic function. When immortalized Bscl2+/+ and Bscl2−/− primary brown preadipocytes were subjected to brown adipocyte differentiation, expression of the pan-adipogenic marker Pparγ, and the BAT-specific differentiation marker Prdm16, was similar between Bscl2+/+ and Bscl2−/− cells during the differentiation time course (Fig. 2A). However, we observed upregulated expression of Ucp1 mRNA starting at D4 after induction of differentiation in Bscl2−/− cells compared to Bscl2+/+ cells (Fig. 2A). Western blotting confirmed increased UCP1 protein expression in differentiating Bscl2−/− brown adipocytes (Fig. 2B). In contrast, the expression of PPARγ and its target proteins aP2 and PLIN1 was similar in Bscl2+/+ and Bscl2−/− cells throughout the differentiation time course (Fig. 2B). Moreover, MitoTracker Red staining of functional mitochondria in live cells was comparable between Bscl2+/+ and Bscl2−/− cells at D8, suggesting that mitochondrial biogenesis associated with mature brown adipogenesis was similar in the two cell types (Fig. 2C). These data suggest that loss of BSCL2 does not affect the canonical brown adipogenic transcriptional program or mitochondrial biogenesis but specifically promotes UCP1 expression during brown adipogenesis.
FIG 2.
Deletion of BSCL2 enhances UCP1 expression during brown adipogenesis in vitro. (A and B) Analysis of brown adipocyte marker gene expression by qPCR (A) and Western blotting (B) during brown adipogenesis in immortalized Bscl2+/+ (+/+) and Bscl2−/− (−/−) preadipocytes. Data are representative of three independent experiments performed in triplicate. *, P < 0.05; **, P < 0.005 versus D0. (C) Representative images of mitochondrial staining by MitoTracker Red in D7 Bscl2+/+ and Bscl2−/− brown adipocytes.
BSCL2 deficiency augments cAMP/PKA-mediated lipolysis during brown adipocyte differentiation.
We next tested whether the cAMP/PKA-mediated lipolysis pathway is activated during brown adipocyte differentiation when BSCL2 is deleted. Indeed, Bscl2−/− brown adipocytes exhibited elevated PKA-mediated phosphorylation, as detected by antibodies recognizing phosphor-PKA substrates and PKA-mediated phosphorylation of HSL, respectively (Fig. 3A). Total protein expression of the major adipocyte lipases (HSL and ATGL) was similar between the two cell types. Bscl2−/− cells also expressed higher levels of PLIN2, an LD protein associated with lipolysis. NEFA and glycerol in D6 differentiating Bscl2−/− brown adipocytes was significantly higher compared to Bscl2+/+ cells (Fig. 3B), suggesting increased basal lipolysis during brown adipogenesis. Consequently, intracellular lipid content was reduced in D10 Bscl2−/− brown adipocytes (Fig. 3C and D). Addition of E600, a general lipase inhibitor (19), to the culture of D4 differentiating brown adipocytes effectively restored cellular TG content in Bscl2−/− cells by D10 (Fig. 3E). However, inhibiting SERCA activity with thapsigargin did not augment basal lipolysis in wild-type brown adipocytes (Fig. 3F). In addition, despite increased basal cAMP/PKA signaling, Bscl2−/− brown adipocytes responded similarly to the β3-adrenergic receptor agonist CL316,243 compared with Bscl2+/+ brown adipocytes (Fig. 3G), suggesting preserved adrenergic receptor signaling. Together, these data suggest that deletion of BSCL2 elicits cAMP/PKA mediated lipolysis through a SERCA-independent pathway during brown adipogenesis.
FIG 3.
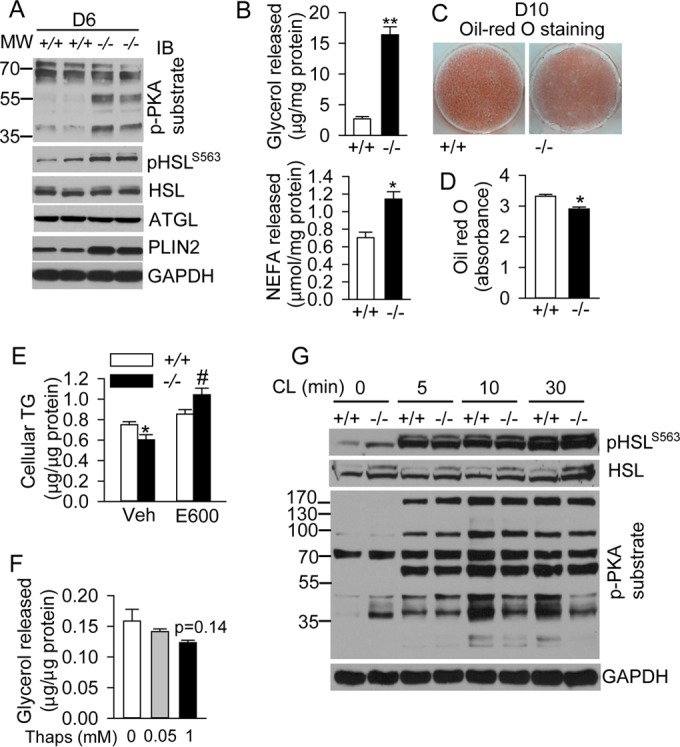
BSCL2 deficiency elevates basal cAMP/PKA mediated lipolysis during brown adipogenesis, resulting in reduced TG accumulation in mature brown adipocytes. (A and B) PKA-mediated phosphorylation and lipase expression (A) and basal glycerol and NFFA release (B) normalized to cellular protein levels in D6-differentiating Bscl2+/+ (+/+) and Bscl2−/− (−/−) brown adipocytes. (C and D) Oil Red O staining and quantification in D10 brown adipocytes. (E) Intracellular TG content in D10 Bscl2+/+ and Bscl2−/− brown adipocytes treated with vehicle (V) or 200 μM E600 added beginning on day 4. Data were normalized to cellular protein levels. (F) Glycerol release from D6 Bscl2+/+ brown adipocytes incubated with 0, 0.05, and 1 mM thapsigargin (Thaps) for 4 h. Data were normalized to total cellular protein. (G) PKA-mediated phosphorylation in D10 Bscl2+/+ and Bscl2−/− brown adipocytes in response to 10 μM CL316,243 at the indicated times. All experiments were performed in triplicate and repeated at least three times. *, P < 0.05; **, P < 0.005.
BSCL2 is a determinant of substrate utilization and uncoupling in brown adipocytes.
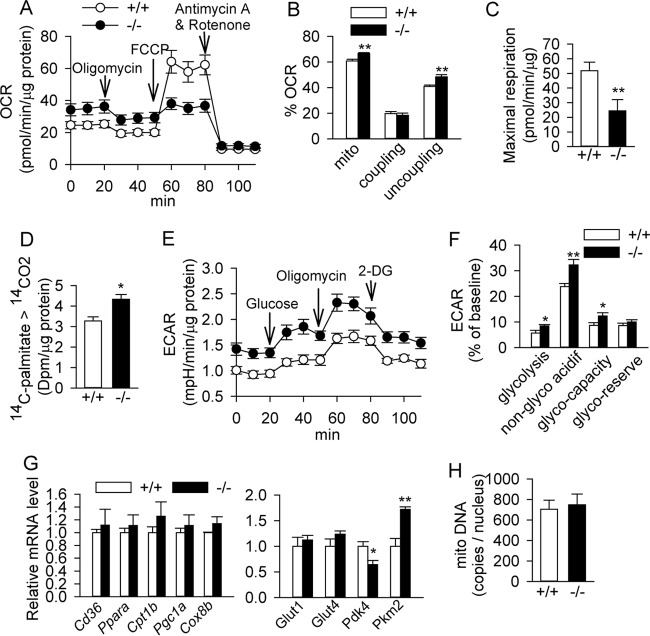
Activation of cAMP/PKA signaling is known to induce both glucose and lipid metabolism in brown adipocytes (1). Thus, we next measured cellular respiration in D6 brown adipocytes. Bscl2 deletion increased basal mitochondrial respiration and uncoupling, at no expense to coupled respiration (Fig. 4A and B), an observation consistent with increased UCP1 expression (Fig. 2). Responses to FCCP were lower in Bscl2−/− brown adipocytes (Fig. 4A), indicative of diminished maximal mitochondrial respiratory capacity with little reserve (Fig. 4C). Measurement of 14C-labeled CO2 released from the complete oxidation of [14C]palmitate in Bscl2−/− brown adipocytes confirmed an elevated FAO rate compared to Bscl2+/+ cells (Fig. 4D). We also assessed glucose metabolism by quantitating the extracellular acidification rate (ECAR) utilizing an XF glycolysis stress test kit. Bscl2−/− adipocytes exhibited elevated nonglycolytic acidification (ECAR after 2-deoxyglucose [2-DG] treatment) produced by the acidification of CO2, the end product of the tricarboxylic acid cycle (47). The addition of glucose increased ECAR in Bscl2+/+ brown adipocytes, and more so in cells deficient in Bscl2, suggesting a greater ability to increase glycolysis. When treated with oligomycin to inhibit mitochondrial ATP production, Bscl2−/− brown adipocytes exhibited a greater response, suggesting an increased glycolytic capacity (Fig. 4E and F). The glycolytic reserve (the difference between glycolytic capacity and glycolysis rate) was not significantly different, however (Fig. 4F). We then assayed the expression of genes controlling fatty acid transport (CD36), β-oxidation (Pparα and Cpt1β), mitochondria biogenesis (Pgc1α and Cox8b), glucose transport (Glut1, Glut4), and glycolysis (pyruvate kinase muscle type 2 [Pkm2] and pyruvate dehydrogenase kinase 4 [Pdk4]) between D6 Bscl2+/+ and Bscl2−/− brown adipocytes and found no differences (Fig. 4G). The total mitochondrial DNA content relative to nuclear DNA in Bscl2−/− brown adipocytes was also not perturbed, confirming unaltered mitochondrial biogenesis (Fig. 4H). These data suggest that Bscl2−/− brown adipocytes are prematurely activated with increased cellular respiration and uncoupling by metabolizing both glucose and lipids.
FIG 4.
BSCL2 deletion increases substrate utilization and uncoupling in brown adipocytes in vitro. (A to C) Oxygen consumption rate (OCR) before and after the sequential injection of oligomycin, FCCP, and antimycin A/rotenone (normalized to protein in panels A and C and expressed as percentage of baseline in panel B). Data are representative of three independent experiments (n = 10). (D) Fatty acid oxidation rate as measured by release of 14CO2 from [14C]palmitic acid. (E and F) ECAR before and after sequential glucose, oligomycin, and 2-deoxyglucose (2-DG) injection (normalized to protein in panel E and expressed as percentage of the baseline in panel F). Data are representative of two independent experiments (n = 10). acidif, acidification. (G) qPCR analysis of genes involved in lipid metabolism and glucose uptake and glycolysis. (H) Mitochondrial DNA copies normalized to nuclear DNA. D6 and D7 brown adipocytes were used. The results in panels G and H are representative of two independent experiments performed in triplicate. *, P < 0.05; **, P < 0.005.
Ablation of BSCL2 in brown preadipocytes derived from the Myf5+ lineage leads to abnormalities in neonatal BAT development mediated through cAMP/PKA signaling.
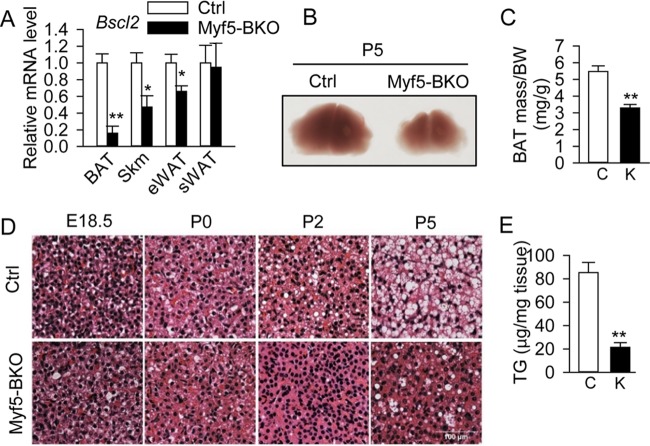
Next, we deleted Bscl2 in the brown fat lineage, but not the white or beige adipocyte lineage, in vivo by intercrossing Myf5Cre mice with Bscl2f/f mice. The resulting Myf5Cre/+; Bscl2f/f (Myf5-BKO) mice were born grossly indistinguishable from their littermate Bscl2f/f (Ctrl) mice. Bscl2 was deleted by >90% in BAT, ∼50% in skeletal muscle, and ∼25% in epididymal white adipose tissue (eWAT) but not in subcutaneous WAT (sWAT) in Myf5-BKO mice (Fig. 5A). By P5, substantially reduced BAT mass was evident in Myf5-BKO mice (Fig. 5B and C). H&E staining revealed similar histologies at E18.5 in BAT from Ctrl and Myf5-BKO mice (Fig. 5D). However, LDs were significantly reduced in BAT of Myf5-BKO mice beginning on P2 (Fig. 5D), with ∼80% reduction in TG content by P5 (Fig. 5E).
FIG 5.
The loss of BSCL2 in Myf5+ lineage brown progenitor cells reduces brown adipose tissue lipid accumulation and mass. (A) Bscl2 expression in BAT, skeletal muscle (Skm), eWAT, and sWAT in 12-week-old male Ctrl and Myf5-BKO mice (n = 5/group). (B) Representative images of BAT (×10) from P5 Ctrl and Myf5-BKO mice. (D) Representative H&E images of BAT at E18.5, P0, P2, and P5. Scale bar, 100 μm. (C and E) Ratio of BAT mass to body weight (BW) (C) and TG content as normalized to tissue weight (E) in P5 neonates of Ctrl (bars C) and Myf5-BKO (bars K) mice (n = 7 to 10). *, P < 0.05; **, P < 0.005 versus Ctrl.
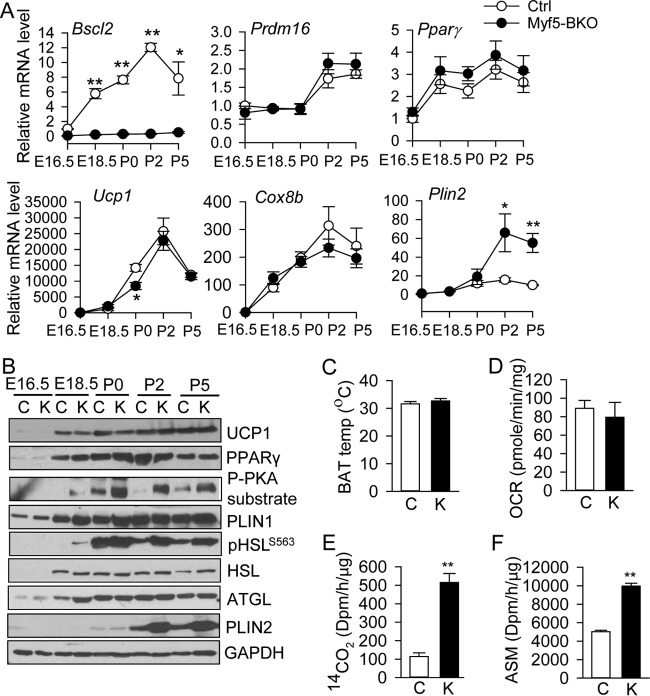
Similar to in vitro differentiating Bscl2−/− brown adipocytes (Fig. 2), loss of BSCL2 in brown adipogenic progenitors had minimal effect on the expression of pan-adipogenic and BAT-specific transcription factors throughout the course of BAT development (Fig. 6A). The protein expression of UCP1 and PPARγ in BAT of Myf5-BKO mice was similar to that in Ctrl mice during BAT development (Fig. 6B), correlating with their mRNA expression (Fig. 6A). Interestingly, in Ctrl mice, cAMP/PKA-mediated phosphorylation was undetectable at E16.5 and very low at E18.5. However, it was sharply activated upon birth (P0) and returned to basal level by P5 (Fig. 6B). In BAT of Myf5-BKO mice, cAMP/PKA-mediated phosphorylation was overtly potentiated between P0 and P5; enhanced cAMP/PKA-mediated phosphorylation was even detected at E18.5, preceding sympathetic nervous system input to BAT, whereas UCP1 expression was not significantly altered (Fig. 6B). The expression of HSL, ATGL, and PLIN1 generally paralleled that of UCP1 and PPARγ in both genotypes (Fig. 6B). However, PLIN2 mRNA and protein was markedly upregulated in BAT of Myf5-BKO mice from P2 to P5 (Fig. 6A and B).
FIG 6.
Loss of BSCL2 in Myf5+ lineage brown progenitor cells activates cAMP/PKA signaling independent of brown adipose tissue development. (A) mRNA expression of Bscl2, BAT adipogenic marker genes, and Plin2 at the denoted embryonic (E) and postnatal (P) days during BAT development (n = 3 pooled from three animals each). *, P < 0.05; **, P < 0.005 versus Ctrl at E16.5. (B) Western blot analyses of brown adipogenic markers and cAMP/PKA signaling [detected by phospho-(Ser/Thr) PKA substrate antibody at PLIN1 size and PKA-mediated HSL phosphorylation at Ser 563] at distinct stages of BAT development in Ctrl (lanes C) and Myf5-BKO (lanes K) mice and (pooled from three animals and repeated in three different litters). (C) Quantification of average skin surface temperature of P5 neonates from infrared images. Bar C (Ctrl mice), n = 12; bar K (Myf5-BKO mice), n = 14. (D) Oxygen consumption rate (OCR) in primary BAT from P10 Ctrl and Myf5-BKO mice (n = 5 in triplicate). (E and F) Fatty acid oxidation rate of P10 BAT homogenates based on conversion of exogenous [14C]palmitic acid to 14CO2 (E) and acid-soluble metabolites (ASM) (F) (n = 6/group). **, P < 0.005.
Surprisingly, we found no differences in skin temperature above the interscapular BAT in newborn P5 mice between the two genotypes despite increased cAMP/PKA signaling in Myf5-BKO mice (Fig. 6C). Moreover, the OCR quantitated directly in BAT explants ex vivo was similar in P10 Ctrl and Myf5-BKO mice when normalized to BAT weight (Fig. 6D). Considering that reduced endogenous TG content (Fig. 5E) may limit fatty acid substrate for oxygen consumption in BAT of the Myf5-BKO mice, we therefore measured FAO rate in BAT homogenates in the presence of exogenous palmitate. Indeed, BAT from P10 Myf5-BKO mice maintained much higher FAO rates when exogenous palmitate was administered (Fig. 6E and F), which is in line with data in in vitro differentiating Bscl2−/− brown adipocytes (Fig. 4D). Thus, diminished TG content in BAT from Myf5-BKO mice limits BAT metabolic activity ex vivo, despite the increased cAMP/PKA signaling. Moreover, confirming our findings in Myf5-BKO mice, enhanced cAMP/PKA-mediated phosphorylation was also detected during the late fetal and early postnatal periods in BAT from global Bscl2−/− mice (Fig. 7A), which correlated with reduced LD formation (Fig. 7B) and BAT mass (Fig. 7C) in these mice.
FIG 7.
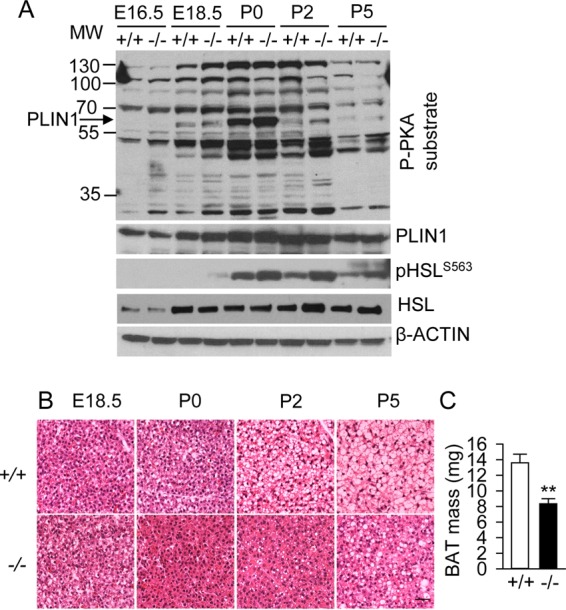
BSCL2 deficiency induces cAMP/PKA signaling during BAT development in global Bscl2−/− mice. (A) Western blot analyses of cAMP/PKA signaling in BAT at distinct stages of BAT development (pooled from three animals and repeated in three different litters). (B) Representative H&E images of BAT at E18.5, P0, P2, and P5. Scale bar, 100 μm. (C) BAT mass in P5 neonates of Bscl2+/+ (+/+) and Bscl2−/− (−/−) mice (n = 7 to 10). **, P < 0.005.
BSCL2 loss in BAT progenitor cells causes BAT paucity and increases whole-body adiposity in adult animals.
To examine the physiological consequences of BSCL2 deletion in BAT progenitors, we monitored Myf5-BKO mice during aging. Although the body weights remained comparable (Fig. 8A), there was a 62% increase in adiposity (Fig. 8B) and an 8% decrease in lean mass (Fig. 8C) in 6-month-old Myf5-BKO mice. Fat depot masses were comparable at 3 months of age, but eWAT and sWAT masses were significantly larger, whereas retroperitoneal WAT (RpWAT) mass was smaller, in 6-month-old Myf5-BKO mice (Fig. 8D). Conversely, the BAT mass in Myf5-BKO mice progressively diminished over time (Fig. 8D) and was reduced by 90% in 9-month-old Myf5-BKO mice compared to Ctrl mice (0.26 ± 0.03 versus 2.63 ± 0.05 mg/g [body weight]), suggesting severe BAT atrophy. Histology of BAT in 6-month-old Myf5-BKO mice demonstrated a diminution in overall LD accumulation with occasional multilocular brown adipocytes (Fig. 8E). The white adipocytes in eWAT and sWAT in Myf5-BKO mice were enlarged (Fig. 8E), supporting white fat hypertrophy. Hepatic mass (Fig. 8D) and lipid deposition (data not shown) were comparable in Ctrl and Myf5-BKO mice. The total DNA content per BAT depot displayed a slight but nonsignificant reduction in 3-month-old Myf5-BKO mice but was reduced by 80% by 6 months of age, suggesting brown adipocyte loss (Fig. 8F). These data suggest that BAT atrophy is associated with increased overall adiposity in aged Myf5-BKO mice.
FIG 8.
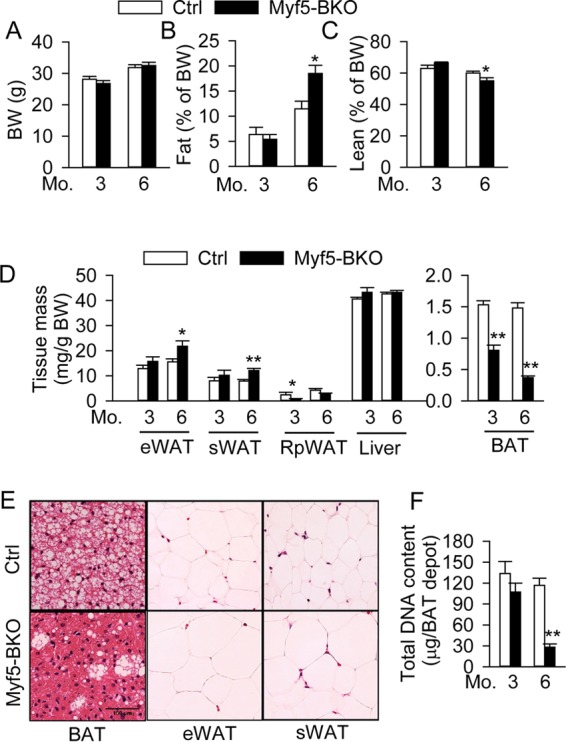
Loss of BSCL2 in BAT progenitor cells promotes BAT atrophy and increases whole-body adiposity in adult animals. (A to C) Body weight (BW) (A) and fat (B) and lean mass (C) normalized to body weight. (D) eWAT, sWAT, RpWAT, liver, and BAT mass normalized to body weight in 3- and 6-month-old male Ctrl and Myf5-BKO mice (n = 8 to 10). (E) Representative H&E images of fat tissues in 6-month-old male Ctrl and Myf5-BKO mice. Scale bar, 100 μm. (F) Total DNA content per BAT depot in 3- and 6-month-old female Ctrl (white bars) and Myf5-BKO (black bars) mice (n = 6/group). *, P < 0.05; **, P < 0.005 versus Ctrl.
Metabolic homeostasis and thermogenesis are not altered in aged Myf5-BKO mice.
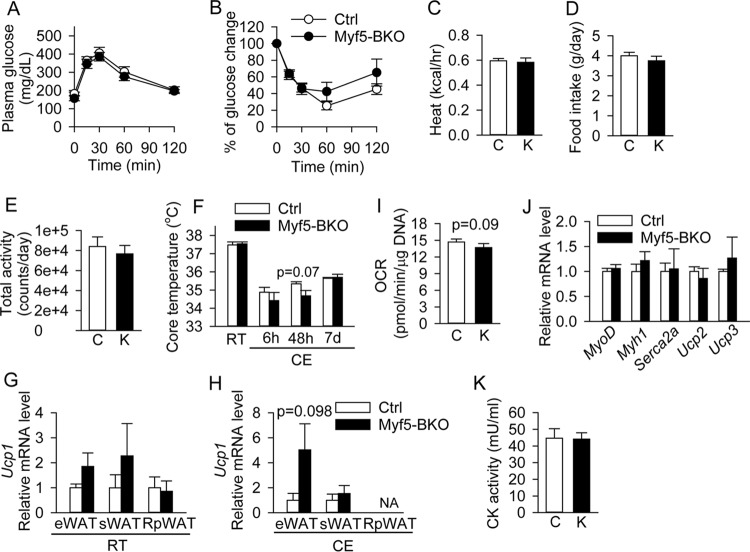
Despite the increased adiposity, 6-month-old Myf5-BKO mice maintained normal glucose tolerance and insulin sensitivity (Fig. 9A and B, respectively). Metabolic testing also revealed no changes in heat production (Fig. 9C), food intake (Fig. 9D), or physical activity levels (Fig. 9E) between the two genotypes. When measuring adaptive thermogenesis, we found that 9-month-old Myf5-BKO mice were able to maintain core temperature at room temperature and after 7 days of cold exposure (CE) (Fig. 9F). This was not associated with overtly increased browning of white fat depots, since we observed only a trend toward higher Ucp1 gene expression in eWAT but not in the other fat depots of Myf5-BKO mice housed at room temperature (Fig. 9G) or after CE (Fig. 9H). The residual BAT of cold-acclimated Myf5-BKO mice had a similar normalized OCR to that of control mice, suggesting that it remained functional (Fig. 9I) and could still contribute to maintenance of thermal homeostasis. Bscl2 deletion in Myf5+ progenitors did not appear to perturb myogenesis or muscle energy metabolism, since the expression of myogenic specific genes and uncoupling factors in skeletal muscle was similar between the two genotypes (Fig. 9J). Moreover, we did not detect increases in cleaved caspase-3 in skeletal muscles of Myf5-BKO mice (data not shown), nor did we observe increased creatine kinase activities in the serum of Myf5-BKO mice after 7 days of cold exposure, pointing against alterations in shivering activity or muscle breakdown in Myf5-BKO mice during cold stress (Fig. 9K).
FIG 9.
Loss of BSCL2 in BAT progenitor cells is not associated with alterations in metabolic homeostasis or adaptive thermogenesis in aged Myf5-BKO mice. (A and B) Glucose (A) and insulin (B) tolerance tests in male 6-month-old Ctrl and Myf5-BKO mice (n = 6 to 8). (C to E) Heat production (C), food intake (D), and activity level (E) in 6-month-old male Ctrl and Myf5-BKO mice (n = 8/group). Bars C, Ctrl mice; bars K, Myf5-BKO mice. (F) Core body temperature of 9-month-old male Ctrl and Myf5-BKO mice at room temperature (RT) and during cold exposure (CE) for up to 7 days (n = 6 to 8/group). (G and H) Ucp1 mRNA expression in eWAT, sWAT, and RpWAT of 6-month-old female Ctrl and Myf5-BKO mice at RT (G) and after CE (H). Analysis could not be performed (NA) on RpWAT after CE given the small amount of tissue (n = 5/group). (I) OCR measured in BAT of 6-month-old female Ctrl and Myf5-BKO mice after 7 days of cold exposure (n = 5/group). Data were normalized to DNA content. (J) Gene expression of myogenic markers and uncoupling factors in skeletal muscle of 6-month-old male Myf5-BKO mice (n = 6/group). (K) Creatinine kinase (CK) activity in serum of 6-month-old female Ctrl and Myf5-BKO mice after 7 days of cold exposure (n = 6 to 8).
BSCL2 loss in brown progenitor cells causes brown adipocyte inflammation and apoptosis which could be partially rescued by housing at thermoneutrality.
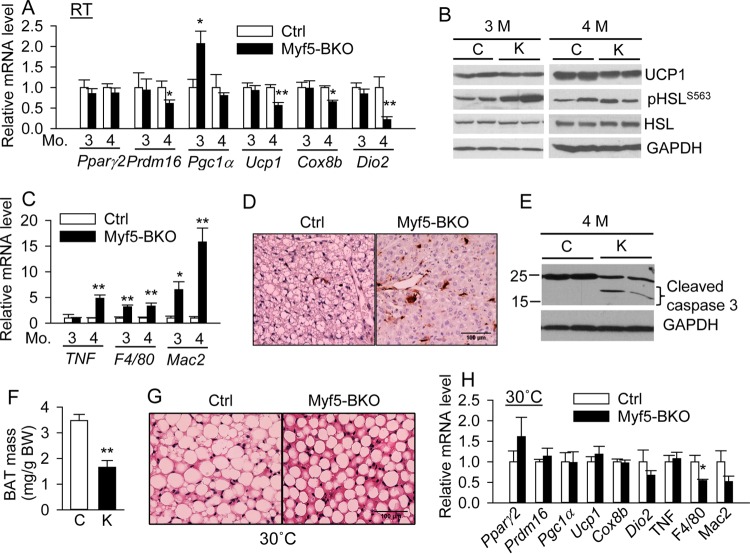
The underlying mechanisms of brown adipocyte loss were analyzed in BAT from Ctrl and Myf5-BKO mice. In 3-month-old mice, the expression of most BAT-selective genes remained comparable, with a 2-fold upregulation of Pgc1α in Myf5-BKO mice (Fig. 10A). However, by 4 months, the expression of most BAT-selective genes was significantly reduced in BAT of Myf5-BKO mice, whereas expression of the WAT gene PPARγ was unaltered (Fig. 10A). Western blotting confirmed the downregulation of UCP1 in 4-month-old Myf5-BKO mice. Interestingly, cAMP/PKA-mediated HSL phosphorylation remained elevated in BAT of 3-month-old Myf5-BKO mice but normalized by 4 months of age (Fig. 10B). The expression of macrophage marker genes (F4/80 and Mac2) and the proinflammatory cytokine tumor necrosis factor alpha (TNF-α) was elevated in BAT of Myf5-BKO mice, particularly at 4 months of age (Fig. 10C). Immunohistochemistry confirmed elevated Mac-2 expression in BAT of Myf5-BKO mice (Fig. 10D). Increased caspase 3 cleavage in BAT of 4-month-old Myf5-BKO mice was also evident (Fig. 10E), suggesting enhanced apoptosis.
FIG 10.
Brown adipose tissue inflammation and apoptosis in Myf5-BKO mice at room temperature (A to E) and after thermoneutral acclimation (F to H). (A to C) qPCR analysis of BAT-specific gene expression (n = 6/group) (A), Western blotting of UCP1 expression and PKA-mediated HSL phosphorylation (representative blots from three independent experiments) (B), and qPCR analysis of inflammatory gene markers (n = 6/group) (C) in BAT of 3- and 4-month-old male Ctrl and Myf5-BKO mice. (D) Representative images of Mac-2 immunostaining in BAT of 3-month-old Ctrl and Myf5-BKO mice. Scale bar, 100 μm. (E) Representative blot of cleaved caspase 3 level in BAT of 4-month-old Ctrl and Myf5-BKO mice (n = 4 total). (F to H) BAT mass normalized to body weight (F), representative images of H&E staining (scale bar, 100 μm) (G), and qPCR analysis of BAT-specific and inflammatory marker genes (H) in 18-week-old male Ctrl and Myf5-BKO mice housed at thermoneutrality (30°C) for 12 weeks beginning at 6 weeks of age (n = 5 or 6/group). *, P < 0.05; **, P < 0.005 versus Ctrl.
To test whether thermoneutrality could rescue the BAT phenotype in Myf5-BKO mice, we housed mice at 30°C starting at 6 weeks of age for up to 12 weeks. The BAT mass of Myf5-BKO mice remained 53% lower that of Ctrl mice (Fig. 10F), a finding consistent with the reduction in BAT mass noted in Myf5-BKO mice housed at room temperature. However, the morphologies of BAT were similar between two genotypes under thermoneutrality, with both displaying largely unilocular lipid droplets (Fig. 10G). Moreover, the mRNA expression of BAT-specific genes was not reduced in 4-month-old Myf5-BKO mice housed at thermoneutrality (Fig. 10H) compared to that of same aged mice housed at room temperature (Fig. 10A). There was also no increase in the mRNA expression of macrophage marker genes (F4/80 and Mac2) or the proinflammatory cytokine TNF-α (Fig. 10G). These data suggest that cold-stimulated PKA signaling accelerates BAT inflammation and apoptosis in Myf5-BKO mice, which can be partially prevented by thermoneutral housing.
DISCUSSION
In this study, we investigated the cell-autonomous function of BSCL2 in controlling classical BAT development and metabolic function. In contrast to the suppressive effect on white adipocyte differentiation, lack of BSCL2 promotes premature activation of brown adipocytes during differentiation. This is associated with activation of cAMP/PKA signaling, lipolysis, and mitochondrial respiration. Using a mouse model with BSCL2 specifically deleted in brown progenitor cells, we further demonstrate that prolonged overactivation of cAMP/PKA signaling during perinatal BAT development is associated with brown adipocyte apoptosis and BAT atrophy in adult animals, leading to increased adiposity, a phenotype which is opposite to that observed in mice with global (19–21) and fat-specific (23, 34) deletion of BSCL2. These studies underscore the important role for BSCL2 in mediating BAT development and provide novel links between cAMP/PKA signaling and BAT mass/activity.
Our current and published data (19) are consistent with a role for BSCL2 in regulating cAMP/PKA signaling in both brown and white adipogenesis. Yet the same BSCL2-mediated signaling pathway elicits different outcomes with regard to white versus brown adipocyte differentiation. While BSCL2-mediated lipolysis dedifferentiates white adipocytes by terminating the white adipogenic transcription program (19), deletion of BSCL2 in brown progenitor cells elicits uncontrolled cAMP/PKA mediated signaling to activate metabolic function in differentiating brown adipocytes, without affecting the brown adipogenic transcription program. Elevated lipolysis and uncoupling in white adipocytes has been postulated to induce dedifferentiation of white adipocytes (48). Considering that brown adipocytes contain higher intrinsic capacity to metabolize lipids through uncoupling, brown adipogenesis may be resistant to inhibition by increased cAMP/PKA-mediated lipolytic signaling, although this remains to be definitively proven.
Sympathetic activation modulates UCP1 expression and thermogenesis in BAT of adult rodents through cAMP/PKA (1). However, the role of cAMP/PKA signaling during perinatal BAT development is poorly understood. Beta-adrenergic modulation of gene expression in brown fat, including the postnatal rise in UCP1 expression in response to postnatal thermal stress, was thought to be established at birth (49). Our data in wild-type neonatal pups support the notion that the SNS activates UCP1 expression and BAT to maintain thermoregulation in the neonatal period. However, BSCL2 deletion-induced upregulated cAMP/PKA signaling during BAT development is associated with BAT atrophy and accentuated white fat mass accumulation in adult animals (Fig. 8). This novel finding suggests that prolonged overactivation of BAT especially during neonatal BAT development may be detrimental to BAT mass expansion and whole-body metabolic homeostasis in adulthood.
cAMP/PKA signaling activates UCP1 expression and couples lipolysis with mitochondrial oxidative phosphorylation (50, 51). This finding was recapitulated in cultured Bscl2−/− brown adipocytes but not in the developing BAT of Myf5-BKO mice in vivo. We speculate that this discrepancy could be due to the unique regulation of UCP1 expression and activity by cellular metabolism, i.e., the limited fatty acid substrate (52). While the in vitro cultured system provides ample energy substrates (both glucose and lipids) to sustain the heightened uncoupling activity, lipid substrate appears to be exhausted in Myf5-BKO mice in vivo, thus limiting BAT metabolism. In addition, deletion of BSCL2 ultimately causes apoptosis of brown adipocytes in Myf5-BKO mice but not in differentiated BSCL2-deleted brown adipocytes cultured up to 20 days with nutritional replenishment (data not shown). Increased BAT inflammation was evident in BAT of lipodystrophic global Bscl2−/− mice (unpublished data) and in mice with fat-specific BSCL2 deletion (23), which is consistent with increased systemic inflammation associated with lipodystrophy (53). However, the presence of macrophage infiltration in BAT of Myf5-BKO mice suggests that BSCL2 ablation in brown adipocytes induces production of mediators of inflammation that may trigger apoptotic death. One candidate mediator is TNF-α, since the upregulation of TNF-α is closely correlated with the suppression of BAT-specific genes in BAT of Myf5-BKO mice (Fig. 10). Interestingly, macrophage infiltration and reduced expression of BAT marker genes can be prevented by thermoneutral housing, further emphasizing that chronic overactivation of cAMP/PKA signaling may be detrimental to brown adipocyte maintenance.
Our data implicate a different mechanism of BSCL2 in regulating fat metabolism in brown adipocytes compared to Drosophila fat body (28). BSCL2 deletion activates cAMP/PKA signaling in the absence of norepinephrine stimulation during brown adipogenesis in vitro, suggesting that BSCL2 may act independent of β-AR to induce cAMP/PKA signaling and enhance lipid combustion and uncoupling in brown adipocytes (Fig. 3). In support of this notion, increased cAMP/PKA signaling was noted in BAT of E18.5 Myf5-BKO and Bscl2−/− mice, prior to sympathetic innervation of the depot (Fig. 6 and 7). Moreover, β3-AR antagonists did not block cAMP/PKA-mediated lipolysis in cultured Bscl2−/− brown adipocytes (data not shown). These findings suggest that BSCL2 mediates cAMP/PKA signaling and brown adipocyte metabolism through a novel mechanism that remains to be established.
Despite the paucity of BAT, Myf5-BKO mice manifested no differences in adaptive thermogenesis, energy expenditure, or food intake. BAT atrophy was reported to cause compensatory browning in eWAT and sWAT (36). However, we only observed a tendency toward higher Ucp1 expression in eWAT of our Myf5-BKO mice housed at room temperature and after CE. Whether such minimal upregulation of Ucp1 contributes to the maintenance of thermogenesis is not clear. Of note, increased fat layers (especially subcutaneous fat) are assumed to have an insulating effect (54). Whether this plays a role in maintaining thermogenesis of old Myf5-BKO mice warrants further study. Nevertheless, Myf5-BKO mice showed no evidence of alterations in muscle formation and function despite reduced BSCL2 expression, suggesting skeletal muscle does not contribute to the metabolic phenotype. Thus, it is possible that reduced BAT mass increases metabolic efficiency of WAT to trigger WAT hypertrophy in Myf5-BKO mice, similar to what is observed in mice with diphtheria toxin-mediated BAT ablation (8).
In summary, our findings identify BSCL2 as a key player in brown adipocyte development and function. These findings highlight that fine-tuning of cAMP/PKA activation during BAT development might be crucial for optimizing adult BAT expansion, maintenance, and metabolic function.
ACKNOWLEDGMENTS
We thank James Mintz (Vascular Biology Center at Augusta University) for assisting with body composition analyses.
This study was supported by American Heart Association Scientist Development grant 12SDG9080000 and Augusta University start-up funds to W.C. and by National Heart, Lung, and Blood Institute grants HL132182 to W.C. and HL112640 and HL126949 to N.L.W.
The funders had no role in study design, data collection and interpretation, or the decision to submit the work for publication.
H.Z. and T.W.B. researched data. W.C. designed and performed the experiments and wrote the manuscript. N.L.W. reviewed/edited manuscript. S.M.B. performed the seahorse experiment and reviewed/edited the manuscript.
Funding Statement
The funders had no role in study design, data collection and interpretation, or the decision to submit the work for publication.
REFERENCES
- 1.Cannon B, Nedergaard J. 2004. Brown adipose tissue: function and physiological significance. Physiol Rev 84:277–359. doi: 10.1152/physrev.00015.2003. [DOI] [PubMed] [Google Scholar]
- 2.Nedergaard J, Bengtsson T, Cannon B. 2011. New powers of brown fat: fighting the metabolic syndrome. Cell Metab 13:238–240. doi: 10.1016/j.cmet.2011.02.009. [DOI] [PubMed] [Google Scholar]
- 3.Vijgen GH, Bouvy ND, Teule GJ, Brans B, Hoeks J, Schrauwen P, van Marken Lichtenbelt WD. 2012. Increase in brown adipose tissue activity after weight loss in morbidly obese subjects. J Clin Endocrinol Metab 97:E1229–E1233. doi: 10.1210/jc.2012-1289. [DOI] [PubMed] [Google Scholar]
- 4.Vijgen GH, Bouvy ND, Teule GJ, Brans B, Schrauwen P, van Marken Lichtenbelt WD. 2011. Brown adipose tissue in morbidly obese subjects. PLoS One 6:e17247. doi: 10.1371/journal.pone.0017247. [DOI] [PMC free article] [PubMed] [Google Scholar]
- 5.Saito M, Okamatsu-Ogura Y, Matsushita M, Watanabe K, Yoneshiro T, Nio-Kobayashi J, Iwanaga T, Miyagawa M, Kameya T, Nakada K, Kawai Y, Tsujisaki M. 2009. High incidence of metabolically active brown adipose tissue in healthy adult humans: effects of cold exposure and adiposity. Diabetes 58:1526–1531. doi: 10.2337/db09-0530. [DOI] [PMC free article] [PubMed] [Google Scholar]
- 6.Yoneshiro T, Aita S, Matsushita M, Okamatsu-Ogura Y, Kameya T, Kawai Y, Miyagawa M, Tsujisaki M, Saito M. 2011. Age-related decrease in cold-activated brown adipose tissue and accumulation of body fat in healthy humans. Obesity 19:1755–1760. doi: 10.1038/oby.2011.125. [DOI] [PubMed] [Google Scholar]
- 7.Rothwell NJ, Stock MJ. 1983. Effects of age on diet-induced thermogenesis and brown adipose tissue metabolism in the rat. Int J Obes 7:583–589. [PubMed] [Google Scholar]
- 8.Lowell BB, Hamann V SSA, Lawitts JA, Himms-Hagen J, Boyer BB, Kozak LP, Flier JS. 1993. Development of obesity in transgenic mice after genetic ablation of brown adipose tissue. Nature 366:740–742. doi: 10.1038/366740a0. [DOI] [PubMed] [Google Scholar]
- 9.Cypess AM, Kahn CR. 2010. Brown fat as a therapy for obesity and diabetes. Curr Opin Endocrinol Diabetes Obes 17:143–149. doi: 10.1097/MED.0b013e328337a81f. [DOI] [PMC free article] [PubMed] [Google Scholar]
- 10.Tseng YH, Cypess AM, Kahn CR. 2010. Cellular bioenergetics as a target for obesity therapy. Nat Rev Drug Discov 9:465–482. doi: 10.1038/nrd3138. [DOI] [PMC free article] [PubMed] [Google Scholar]
- 11.Kaufman MH. 1992. The atlas of mouse development. Academic Press, Ltd, London, United Kingdom. [Google Scholar]
- 12.Farmer SR. 2006. Transcriptional control of adipocyte formation. Cell Metab 4:263–273. doi: 10.1016/j.cmet.2006.07.001. [DOI] [PMC free article] [PubMed] [Google Scholar]
- 13.Seale P, Bjork B, Yang W, Kajimura S, Chin S, Kuang S, Scime A, Devarakonda S, Conroe HM, Erdjument-Bromage H, Tempst P, Rudnicki MA, Beier DR, Spiegelman BM. 2008. PRDM16 controls a brown fat/skeletal muscle switch. Nature 454:961–967. doi: 10.1038/nature07182. [DOI] [PMC free article] [PubMed] [Google Scholar]
- 14.Seale P, Kajimura S, Spiegelman BM. 2009. Transcriptional control of brown adipocyte development and physiological function: of mice and men. Genes Dev 23:788–797. doi: 10.1101/gad.1779209. [DOI] [PMC free article] [PubMed] [Google Scholar]
- 15.Chen W, Yechoor VK, Chang BH, Li MV, March KL, Chan L. 2009. The human lipodystrophy gene product BSCL2/seipin plays a key role in adipocyte differentiation. Endocrinology 150:4552–4561. doi: 10.1210/en.2009-0236. [DOI] [PMC free article] [PubMed] [Google Scholar]
- 16.Magre J, Delepine M, Khallouf E, Gedde-Dahl T Jr, Van Maldergem L, Sobel E, Papp J, Meier M, Megarbane A, Bachy A, Verloes A, d'Abronzo FH, Seemanova E, Assan R, Baudic N, Bourut C, Czernichow P, Huet F, Grigorescu F, de Kerdanet M, Lacombe D, Labrune P, Lanza M, Loret H, Matsuda F, Navarro J, Nivelon-Chevalier A, Polak M, Robert JJ, Tric P, Tubiana-Rufi N, Vigouroux C, Weissenbach J, Savasta S, Maassen JA, Trygstad O, Bogalho P, Freitas P, Medina JL, Bonnicci F, Joffe BI, Loyson G, Panz VR, Raal FJ, O'Rahilly S, Stephenson T, Kahn CR, Lathrop M, Capeau J. 2001. Identification of the gene altered in Berardinelli-Seip congenital lipodystrophy on chromosome 11q13. Nat Genet 28:365–370. doi: 10.1038/ng585. [DOI] [PubMed] [Google Scholar]
- 17.Payne VA, Grimsey N, Tuthill A, Virtue S, Gray SL, Nora ED, Semple RK, O'Rahilly S, Rochford JJ. 2008. The human lipodystrophy gene BSCL2/seipin may be essential for normal adipocyte differentiation. Diabetes 57:2055–2060. doi: 10.2337/db08-0184. [DOI] [PMC free article] [PubMed] [Google Scholar]
- 18.Windpassinger C, Auer-Grumbach M, Irobi J, Patel H, Petek E, Horl G, Malli R, Reed JA, Dierick I, Verpoorten N, Warner TT, Proukakis C, Van den Bergh P, Verellen C, Van Maldergem L, Merlini L, De Jonghe P, Timmerman V, Crosby AH, Wagner K. 2004. Heterozygous missense mutations in BSCL2 are associated with distal hereditary motor neuropathy and Silver syndrome. Nat Genet 36:271–276. doi: 10.1038/ng1313. [DOI] [PubMed] [Google Scholar]
- 19.Chen W, Chang B, Saha P, Hartig SM, Li L, Reddy VT, Yang Y, Yechoor V, Mancini MA, Chan L. 2012. Berardinelli-Seip congenital lipodystrophy 2/seipin is a cell-autonomous regulator of lipolysis essential for adipocyte differentiation. Mol Cell Biol 32:1099–1111. doi: 10.1128/MCB.06465-11. [DOI] [PMC free article] [PubMed] [Google Scholar]
- 20.Cui X, Wang Y, Tang Y, Liu Y, Zhao L, Deng J, Xu G, Peng X, Ju S, Liu G, Yang H. 2011. Seipin ablation in mice results in severe generalized lipodystrophy. Hum Mol Genet 20:3022–3030. doi: 10.1093/hmg/ddr205. [DOI] [PubMed] [Google Scholar]
- 21.Prieur X, Dollet L, Takahashi M, Nemani M, Pillot B, Le May C, Mounier C, Takigawa-Imamura H, Zelenika D, Matsuda F, Feve B, Capeau J, Lathrop M, Costet P, Cariou B, Magre J. 2013. Thiazolidinediones partially reverse the metabolic disturbances observed in Bscl2/seipin-deficient mice. Diabetologia 56:1813–1825. doi: 10.1007/s00125-013-2926-9. [DOI] [PubMed] [Google Scholar]
- 22.Ebihara C, Ebihara K, Aizawa-Abe M, Mashimo T, Tomita T, Zhao M, Gumbilai V, Kusakabe T, Yamamoto Y, Aotani D, Yamamoto-Kataoka S, Sakai T, Hosoda K, Serikawa T, Nakao K. 2015. Seipin is necessary for normal brain development and spermatogenesis in addition to adipogenesis. Hum Mol Genet 24:4238–4249. doi: 10.1093/hmg/ddv156. [DOI] [PubMed] [Google Scholar]
- 23.Liu L, Jiang Q, Wang X, Zhang Y, Lin RC, Lam SM, Shui G, Zhou L, Li P, Wang Y, Cui X, Gao M, Zhang L, Lv Y, Xu G, Liu G, Zhao D, Yang H. 2014. Adipose-specific knockout of seipin/BSCL2 results in progressive lipodystrophy. Diabetes 63:2320–2331. doi: 10.2337/db13-0729. [DOI] [PubMed] [Google Scholar]
- 24.Fei W, Shui G, Gaeta B, Du X, Kuerschner L, Li P, Brown AJ, Wenk MR, Parton RG, Yang H. 2008. Fld1p, a functional homologue of human seipin, regulates the size of lipid droplets in yeast. J Cell Biol 180:473–482. doi: 10.1083/jcb.200711136. [DOI] [PMC free article] [PubMed] [Google Scholar]
- 25.Szymanski KM, Binns D, Bartz R, Grishin NV, Li WP, Agarwal AK, Garg A, Anderson RG, Goodman JM. 2007. The lipodystrophy protein seipin is found at endoplasmic reticulum lipid droplet junctions and is important for droplet morphology. Proc Natl Acad Sci U S A 104:20890–20895. doi: 10.1073/pnas.0704154104. [DOI] [PMC free article] [PubMed] [Google Scholar]
- 26.Wolinski H, Kolb D, Hermann S, Koning RI, Kohlwein SD. 2011. A role for seipin in lipid droplet dynamics and inheritance in yeast. J Cell Sci 124:3894–3904. doi: 10.1242/jcs.091454. [DOI] [PubMed] [Google Scholar]
- 27.Boutet E, El Mourabit H, Prot M, Nemani M, Khallouf E, Colard O, Maurice M, Durand-Schneider AM, Chretien Y, Gres S, Wolf C, Saulnier-Blache JS, Capeau J, Magre J. 2009. Seipin deficiency alters fatty acid Delta9 desaturation and lipid droplet formation in Berardinelli-Seip congenital lipodystrophy. Biochimie 91:796–803. doi: 10.1016/j.biochi.2009.01.011. [DOI] [PubMed] [Google Scholar]
- 28.Bi J, Wang W, Liu Z, Huang X, Jiang Q, Liu G, Wang Y, Huang X. 2014. Seipin promotes adipose tissue fat storage through the ER Ca2+-ATPase SERCA. Cell Metab 19:861–871. doi: 10.1016/j.cmet.2014.03.028. [DOI] [PubMed] [Google Scholar]
- 29.Sim MF, Dennis RJ, Aubry EM, Ramanathan N, Sembongi H, Saudek V, Ito D, O'Rahilly S, Siniossoglou S, Rochford JJ. 2012. The human lipodystrophy protein seipin is an ER membrane adaptor for the adipogenic PA phosphatase lipin 1. Mol Metab 2:38–46. doi: 10.1016/j.molmet.2012.11.002. [DOI] [PMC free article] [PubMed] [Google Scholar]
- 30.Talukder MM, Sim MF, O'Rahilly S, Edwardson JM, Rochford JJ. 2015. Seipin oligomers can interact directly with AGPAT2 and lipin 1, physically scaffolding critical regulators of adipogenesis. Mol Metab 4:199–209. doi: 10.1016/j.molmet.2014.12.013. [DOI] [PMC free article] [PubMed] [Google Scholar]
- 31.Reusch JE, Colton LA, Klemm DJ. 2000. CREB activation induces adipogenesis in 3T3-L1 cells. Mol Cell Biol 20:1008–1020. doi: 10.1128/MCB.20.3.1008-1020.2000. [DOI] [PMC free article] [PubMed] [Google Scholar]
- 32.Klaus S, Seivert A, Boeuf S. 2001. Effect of the β3-adrenergic agonist Cl316,243 on functional differentiation of white and brown adipocytes in primary cell culture. Biochim Biophys Acta 1539:85–92. doi: 10.1016/S0167-4889(01)00093-3. [DOI] [PubMed] [Google Scholar]
- 33.Li H, Fong C, Chen Y, Cai G, Yang M. 2010. Beta-adrenergic signals regulate adipogenesis of mouse mesenchymal stem cells via cAMP/PKA pathway. Mol Cell Endocrinol 323:201–207. doi: 10.1016/j.mce.2010.03.021. [DOI] [PubMed] [Google Scholar]
- 34.Zhou H, Lei X, Benson T, Mintz J, Xu X, Harris RB, Weintraub NL, Wang X, Chen W. 2015. Berardinelli-Seip congenital lipodystrophy 2 regulates adipocyte lipolysis, browning, and energy balance in adult animals. J Lipid Res 56:1912–1925. doi: 10.1194/jlr.M060244. [DOI] [PMC free article] [PubMed] [Google Scholar]
- 35.Armengol J, Villena JA, Hondares E, Carmona MC, Sul HS, Iglesias R, Giralt M, Villarroya F. 2012. Pref-1 in brown adipose tissue: specific involvement in brown adipocyte differentiation and regulatory role of C/EBPδ. Biochem J 443:799–810. doi: 10.1042/BJ20111714. [DOI] [PubMed] [Google Scholar]
- 36.Schulz TJ, Huang P, Huang TL, Xue R, McDougall LE, Townsend KL, Cypess AM, Mishina Y, Gussoni E, Tseng YH. 2013. Brown-fat paucity due to impaired BMP signaling induces compensatory browning of white fat. Nature 495:379–383. doi: 10.1038/nature11943. [DOI] [PMC free article] [PubMed] [Google Scholar]
- 37.Tseng YH, Kokkotou E, Schulz TJ, Huang TL, Winnay JN, Taniguchi CM, Tran TT, Suzuki R, Espinoza DO, Yamamoto Y, Ahrens MJ, Dudley AT, Norris AW, Kulkarni RN, Kahn CR. 2008. New role of bone morphogenetic protein 7 in brown adipogenesis and energy expenditure. Nature 454:1000–1004. doi: 10.1038/nature07221. [DOI] [PMC free article] [PubMed] [Google Scholar]
- 38.Fasshauer M, Klein J, Kriauciunas KM, Ueki K, Benito M, Kahn CR. 2001. Essential role of insulin receptor substrate 1 in differentiation of brown adipocytes. Mol Cell Biol 21:319–329. doi: 10.1128/MCB.21.1.319-329.2001. [DOI] [PMC free article] [PubMed] [Google Scholar]
- 39.Klein J, Fasshauer M, Klein HH, Benito M, Kahn CR. 2002. Novel adipocyte lines from brown fat: a model system for the study of differentiation, energy metabolism, and insulin action. Bioessays 24:382–388. doi: 10.1002/bies.10058. [DOI] [PubMed] [Google Scholar]
- 40.Bligh EG, Dyer WJ. 1959. A rapid method of total lipid extraction and purification. Can J Biochem Physiol 37:911–917. doi: 10.1139/o59-099. [DOI] [PubMed] [Google Scholar]
- 41.Chen W, Zhou H, Saha P, Li L, Chan L. 2014. Molecular mechanisms underlying fasting modulated liver insulin sensitivity and metabolism in male lipodystrophic Bscl2/seipin-deficient mice. Endocrinology 155:4215–4225. doi: 10.1210/en.2014-1292:en20141292. [DOI] [PMC free article] [PubMed] [Google Scholar]
- 42.Vergnes L, Chin R, Young SG, Reue K. 2011. Heart-type fatty acid-binding protein is essential for efficient brown adipose tissue fatty acid oxidation and cold tolerance. J Biol Chem 286:380–390. doi: 10.1074/jbc.M110.184754. [DOI] [PMC free article] [PubMed] [Google Scholar]
- 43.Cypess AM, White AP, Vernochet C, Schulz TJ, Xue R, Sass CA, Huang TL, Roberts-Toler C, Weiner LS, Sze C, Chacko AT, Deschamps LN, Herder LM, Truchan N, Glasgow AL, Holman AR, Gavrila A, Hasselgren PO, Mori MA, Molla M, Tseng YH. 2013. Anatomical localization, gene expression profiling and functional characterization of adult human neck brown fat. Nat Med 19:635–639. doi: 10.1038/nm.3112. [DOI] [PMC free article] [PubMed] [Google Scholar]
- 44.Lagouge M, Argmann C, Gerhart-Hines Z, Meziane H, Lerin C, Daussin F, Messadeq N, Milne J, Lambert P, Elliott P, Geny B, Laakso M, Puigserver P, Auwerx J. 2006. Resveratrol improves mitochondrial function and protects against metabolic disease by activating SIRT1 and PGC-1α. Cell 127:1109–1122. doi: 10.1016/j.cell.2006.11.013. [DOI] [PubMed] [Google Scholar]
- 45.Hirschey MD, Shimazu T, Goetzman E, Jing E, Schwer B, Lombard DB, Grueter CA, Harris C, Biddinger S, Ilkayeva OR, Stevens RD, Li Y, Saha AK, Ruderman NB, Bain JR, Newgard CB, Farese RV Jr, Alt FW, Kahn CR, Verdin E. 2010. SIRT3 regulates mitochondrial fatty acid oxidation by reversible enzyme deacetylation. Nature 464:121–125. doi: 10.1038/nature08778. [DOI] [PMC free article] [PubMed] [Google Scholar]
- 46.Chang BH, Li L, Paul A, Taniguchi S, Nannegari V, Heird WC, Chan L. 2006. Protection against fatty liver but normal adipogenesis in mice lacking adipose differentiation-related protein. Mol Cell Biol 26:1063–1076. doi: 10.1128/MCB.26.3.1063-1076.2006. [DOI] [PMC free article] [PubMed] [Google Scholar]
- 47.TeSlaa T, Teitell MA. 2014. Techniques to monitor glycolysis. Methods Enzymol 542:91–114. doi: 10.1016/B978-0-12-416618-9.00005-4. [DOI] [PMC free article] [PubMed] [Google Scholar]
- 48.Tejerina S, De Pauw A, Vankoningsloo S, Houbion A, Renard P, De Longueville F, Raes M, Arnould T. 2009. Mild mitochondrial uncoupling induces 3T3-L1 adipocyte dedifferentiation by a PPARγ-independent mechanism, whereas TNFα-induced dedifferentiation is PPARγ dependent. J Cell Sci 122:145–155. doi: 10.1242/jcs.027508. [DOI] [PubMed] [Google Scholar]
- 49.Giralt M, Martin I, Iglesias R, Vinas O, Villarroya F, Mampel T. 1990. Ontogeny and perinatal modulation of gene expression in rat brown adipose tissue: unaltered iodothyronine 5′-deiodinase activity is necessary for the response to environmental temperature at birth. Eur J Biochem 193:297–302. [DOI] [PubMed] [Google Scholar]
- 50.Cao W, Daniel KW, Robidoux J, Puigserver P, Medvedev AV, Bai X, Floering LM, Spiegelman BM, Collins S. 2004. p38 mitogen-activated protein kinase is the central regulator of cyclic AMP-dependent transcription of the brown fat uncoupling protein 1 gene. Mol Cell Biol 24:3057–3067. doi: 10.1128/MCB.24.7.3057-3067.2004. [DOI] [PMC free article] [PubMed] [Google Scholar]
- 51.Collins S. 2011. β-Adrenoceptor signaling networks in adipocytes for recruiting stored fat and energy expenditure. Front Endocrinol 2:102. doi: 10.3389/fendo.2011.00102. [DOI] [PMC free article] [PubMed] [Google Scholar]
- 52.Fedorenko A, Lishko PV, Kirichok Y. 2012. Mechanism of fatty-acid-dependent UCP1 uncoupling in brown fat mitochondria. Cell 151:400–413. doi: 10.1016/j.cell.2012.09.010. [DOI] [PMC free article] [PubMed] [Google Scholar]
- 53.Herrero L, Shapiro H, Nayer A, Lee J, Shoelson SE. 2010. Inflammation and adipose tissue macrophages in lipodystrophic mice. Proc Natl Acad Sci U S A 107:240–245. doi: 10.1073/pnas.0905310107. [DOI] [PMC free article] [PubMed] [Google Scholar]
- 54.Nedergaard J, Cannon B. 2014. The browning of white adipose tissue: some burning issues. Cell Metab 20:396–407. doi: 10.1016/j.cmet.2014.07.005. [DOI] [PubMed] [Google Scholar]


